Free online data flow diagram maker
Make data flow diagrams on our beginner-friendly platform with an intuitive interface similar to MS office. Easily get started with our massive collection of templates.
Why Use EdrawMax Data Flow Diagram Maker?
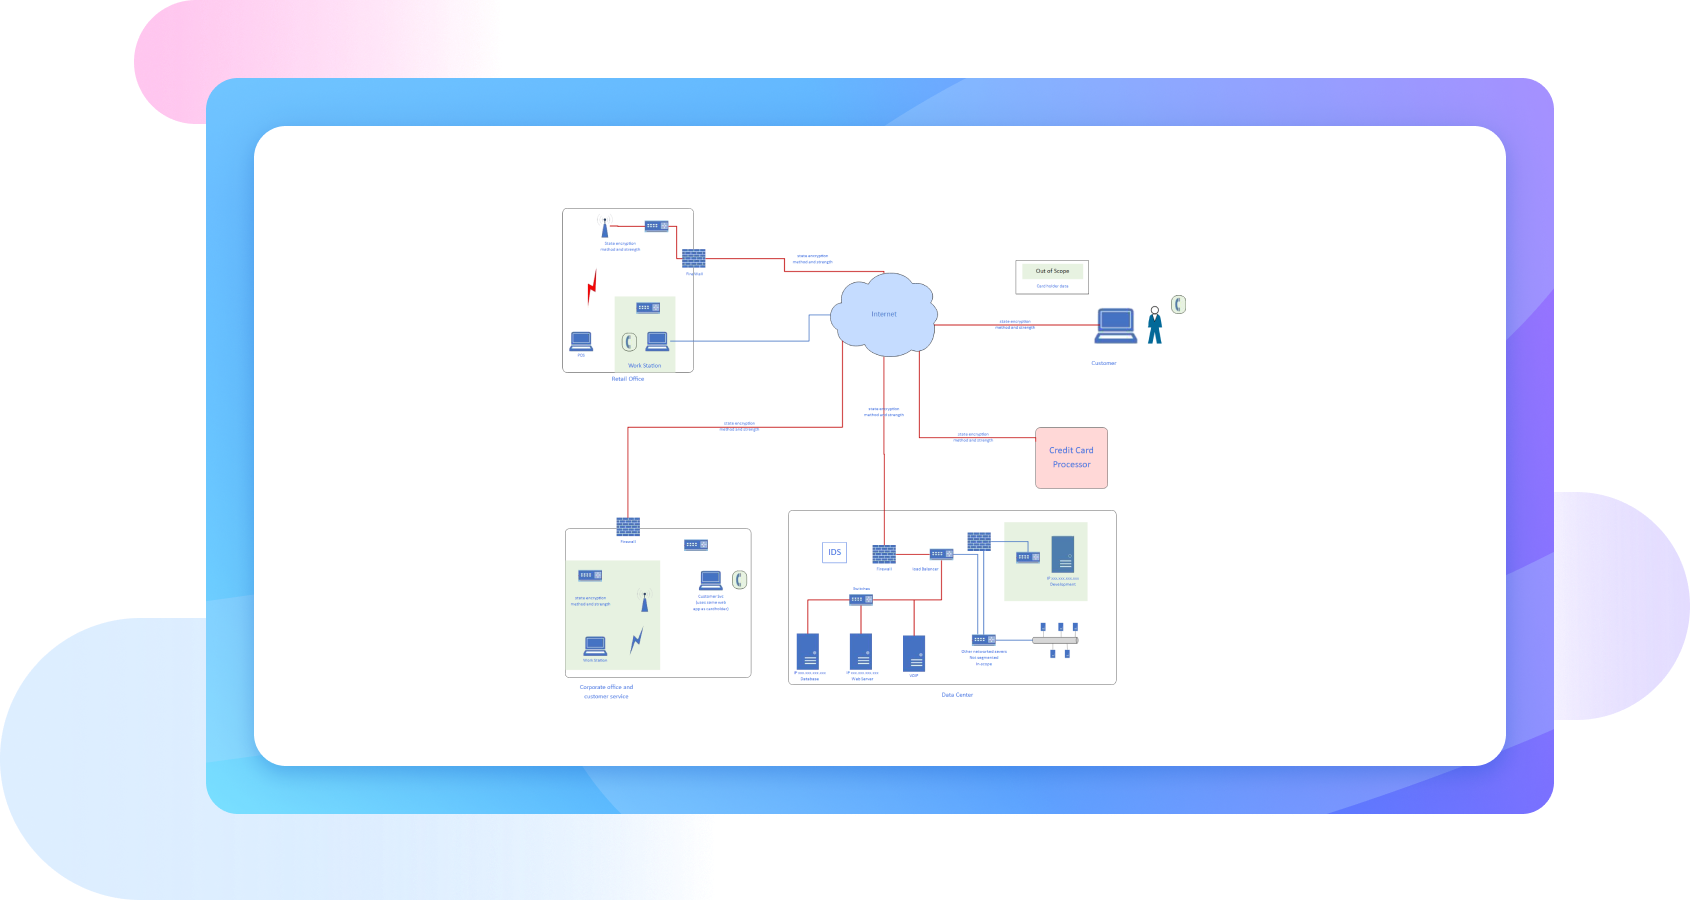
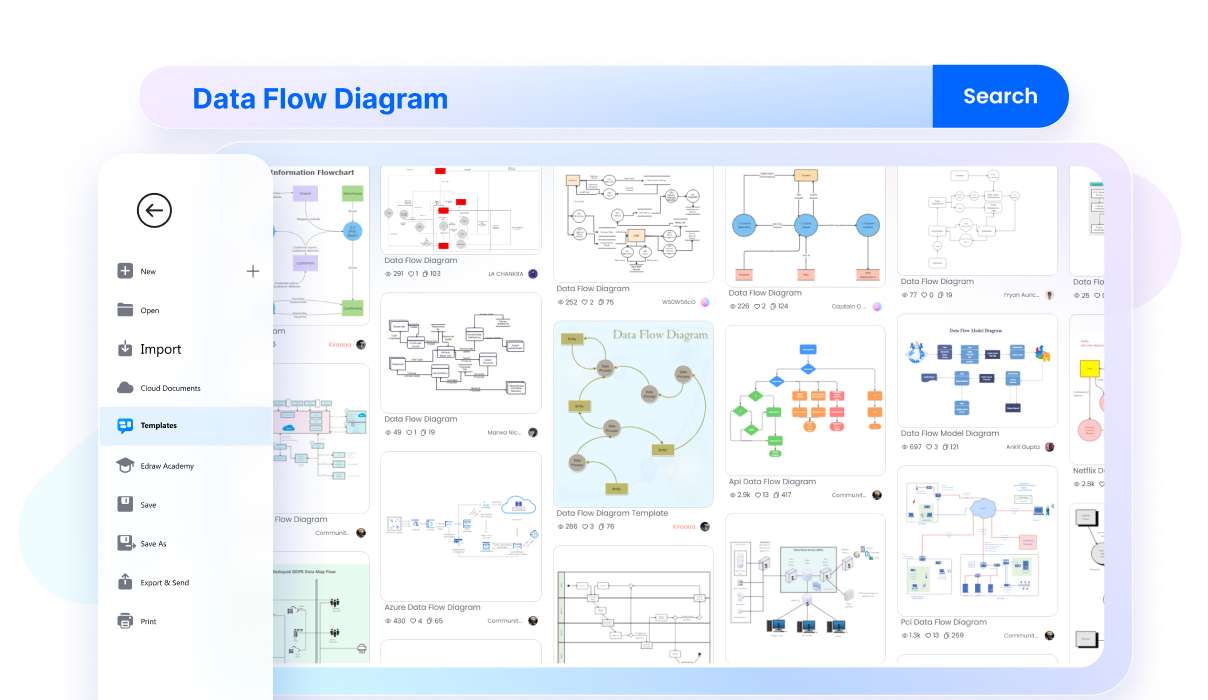
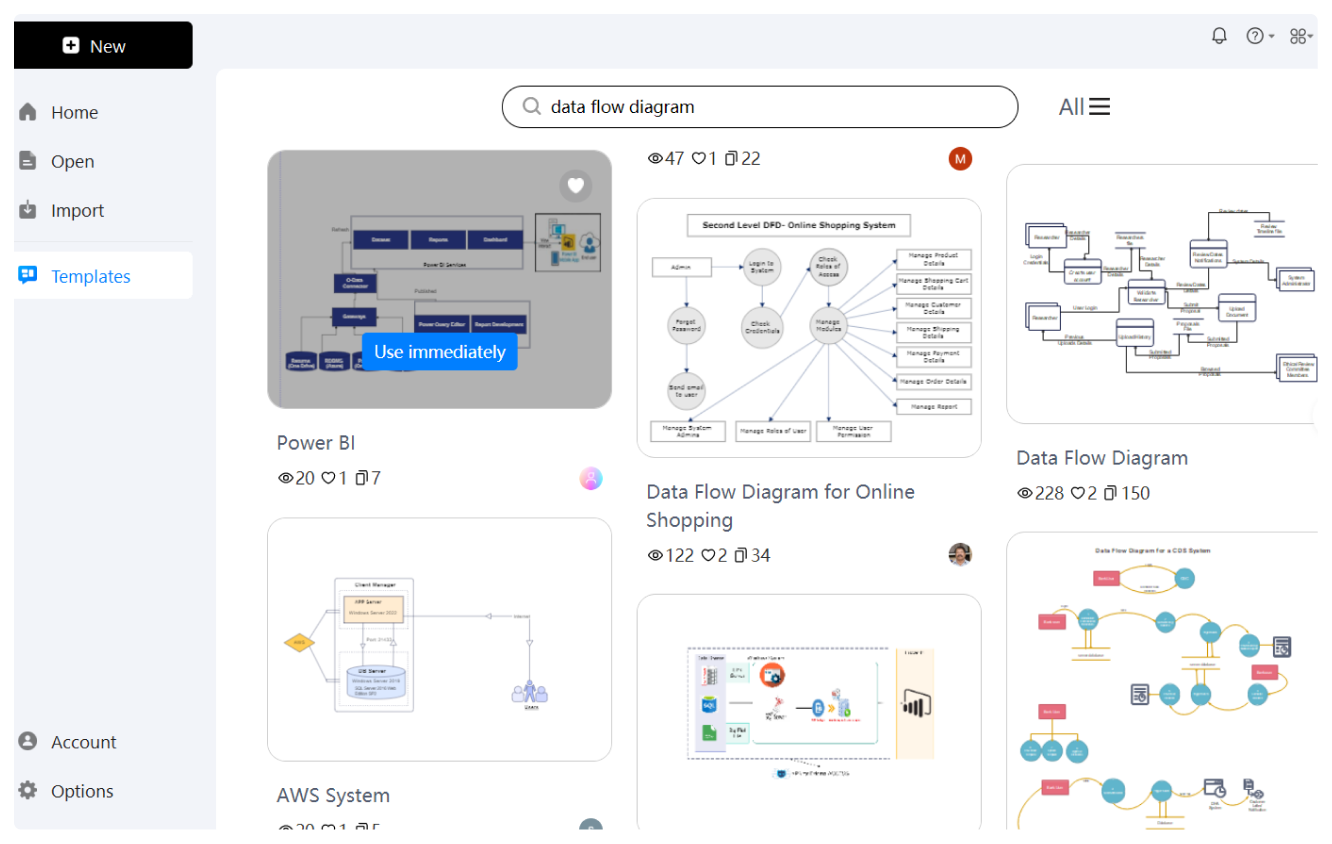
Explore nearly 20,000 templates and 26,000 symbols for over 210 types of diagrams including numerous data flow diagrams. Whether you are looking for one of online shopping, hotel management, hospital management, or others, EdrawMax has you covered.
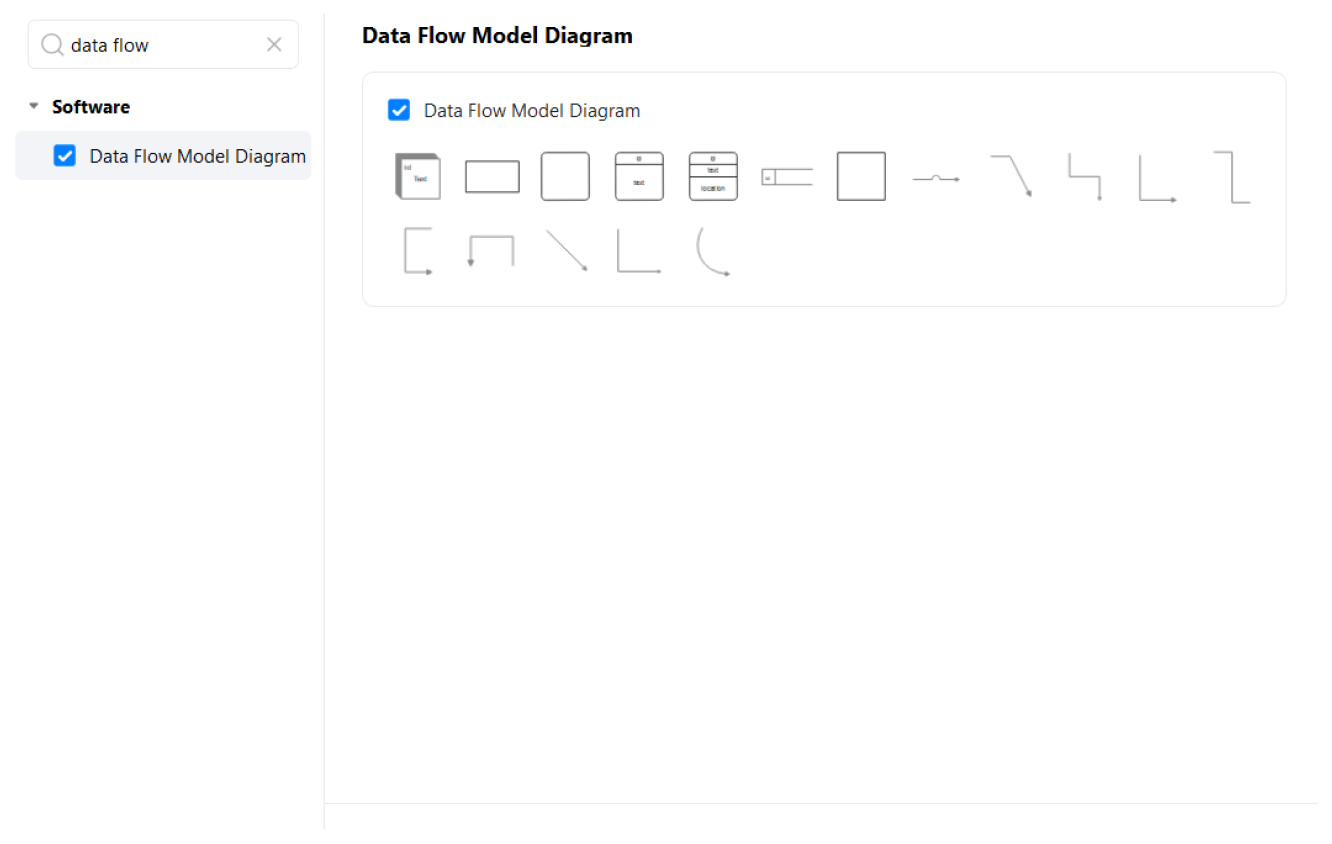
Drag and drop symbols from the libraries that appear automatically after you choose a template. Try One-click Beautify function to increase efficiency. Create your personal templates and save self-made elements in your own libraries for future use. Group objects.
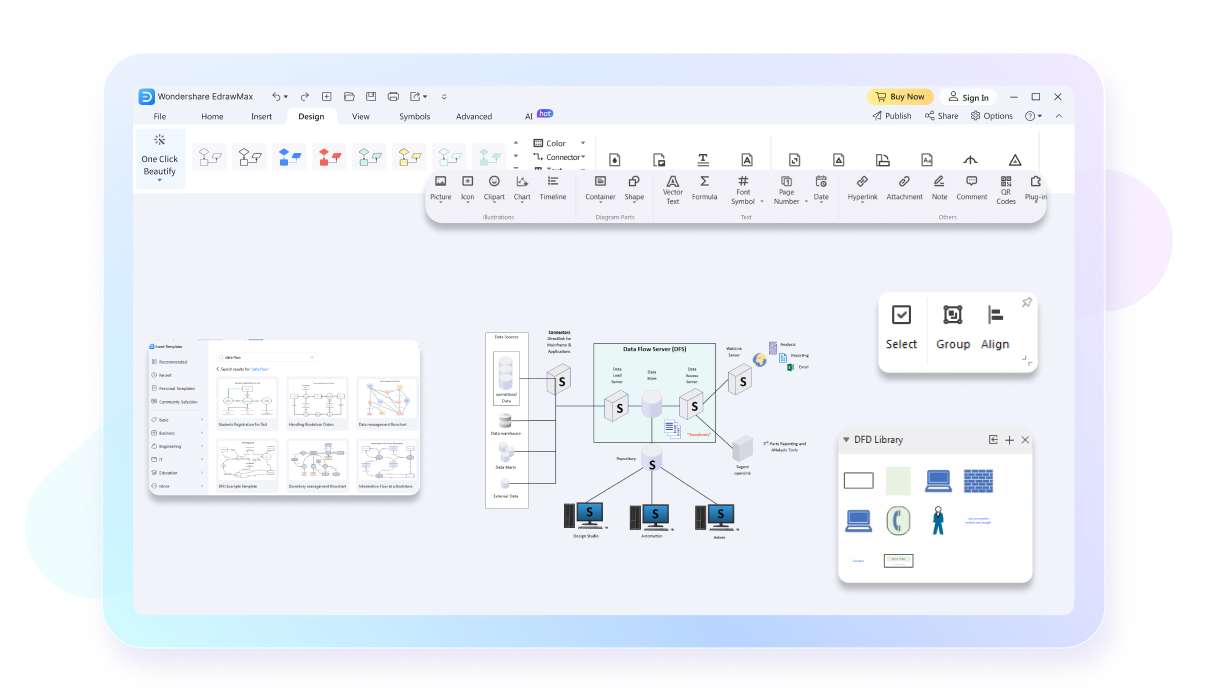
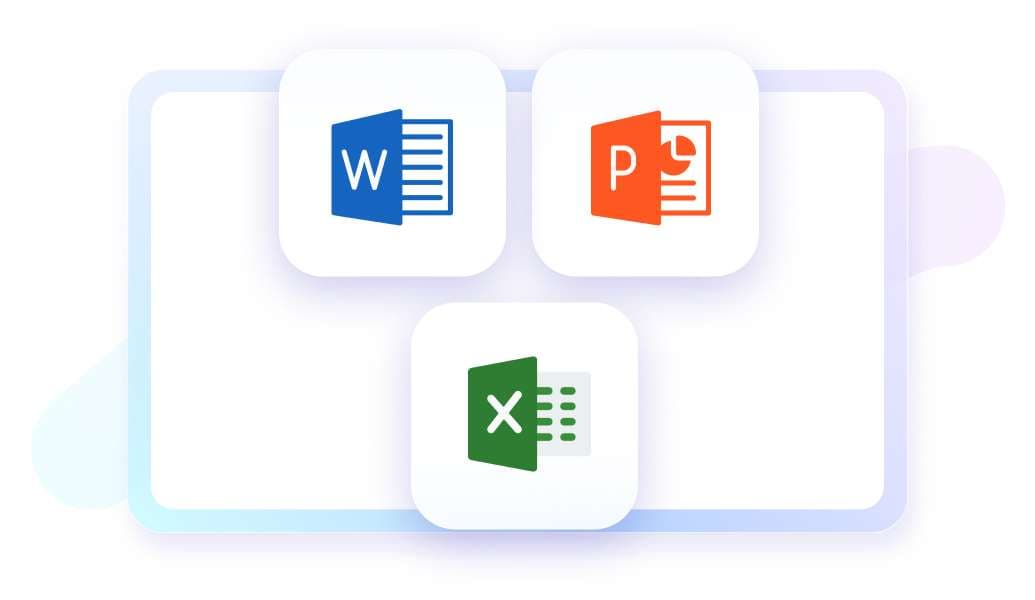
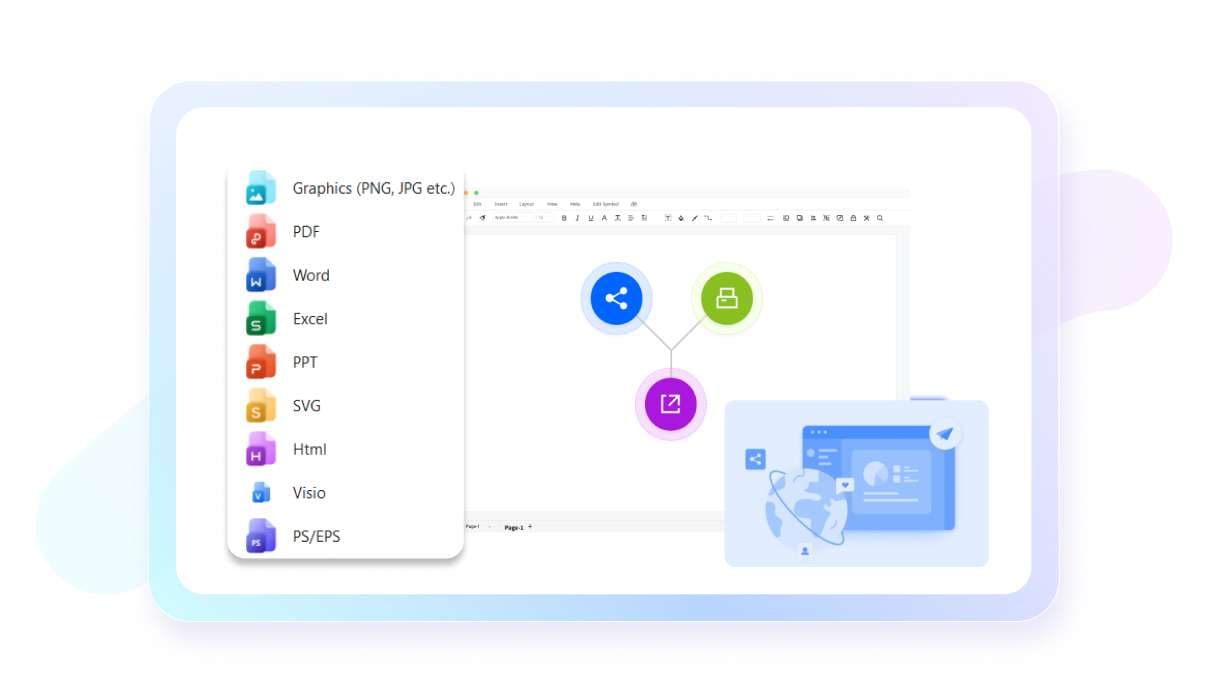
Circle areas of the diagram to directly generate a slideshow. Preview and export it in the ppt format. Also, you can choose to export your diagrams in the format of word or excel and edit them there.
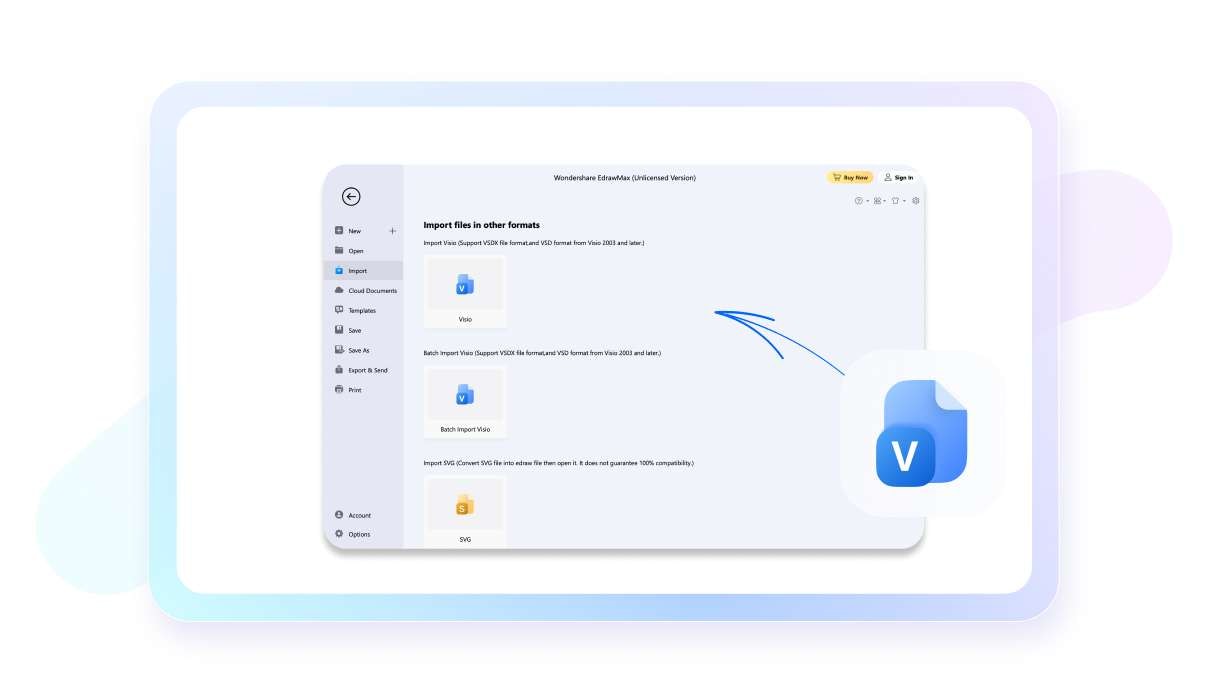
Try EdrawMax, which is available on macOS and has a free version, as a replacement of Visio. Import a VSDX file or export a diagram to cooperate with other team members using Visio.
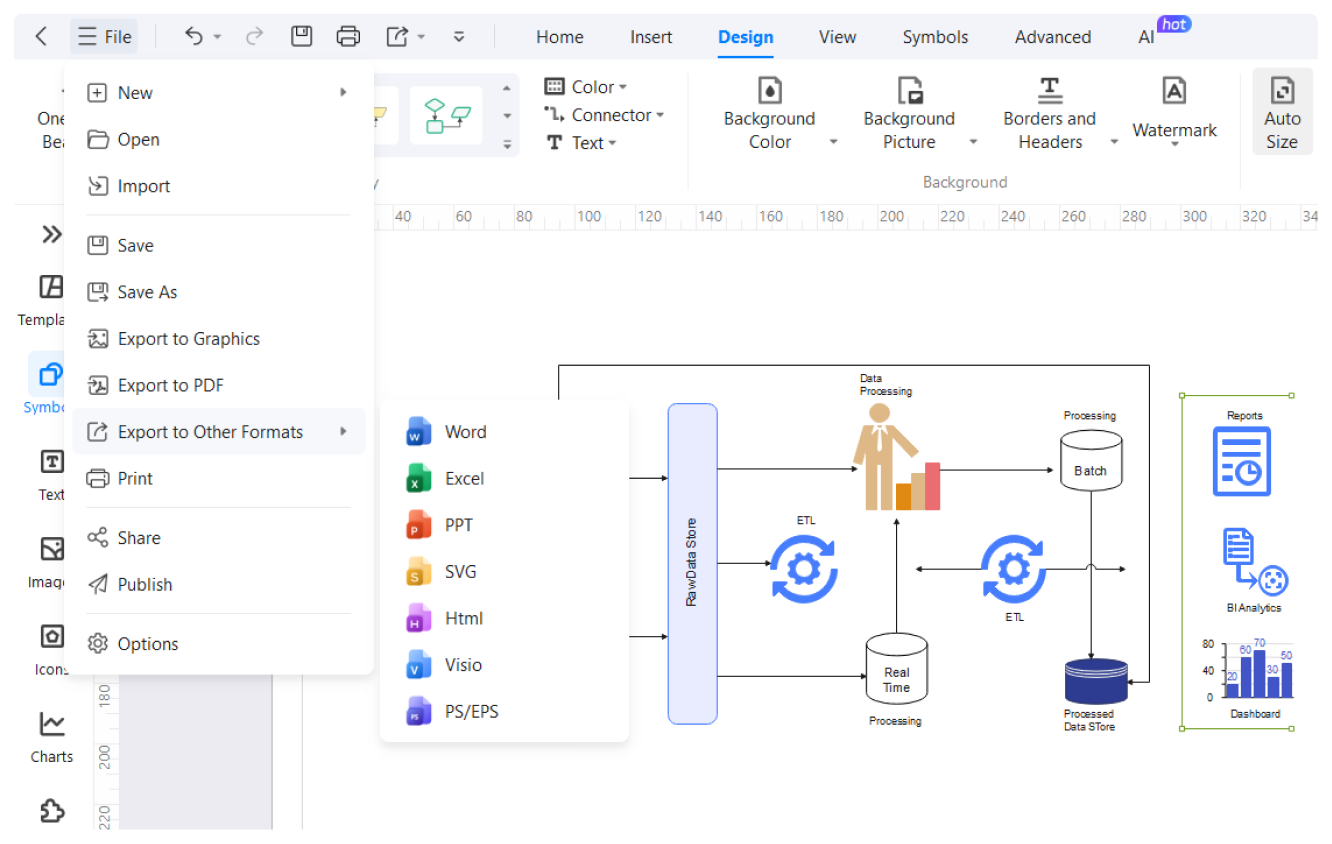
Export your diagrams in JPG or PNG format for viewing, PDF format sharing, or SVG format for further editing. EdrawMax offers over 10 export options to suit your needs.
How to Make a Data Flow Diagram in 3 Simple Steps
What our users say
More Data Flow Diagram Tools
Discover more AI-powered diagram makers to boost your productivity.
FAQs about data flow diagram makers
-
What is a data flow diagram?A data flow diagram maker is a software tool or platform specifically designed to create professional and visually appealing data flow diagrams. It provides a user-friendly interface with a range of pre-built symbols, shapes, and templates that users can utilize to design their data flow diagrams.
-
What are the four primary components of a DFD?A standard DFD consists of four main elements: external entities, which are sources or destinations of data; processes, which represent activities that transform data; data stores, where information is held for later use; and data flows, which are the paths that information takes between the other three components.
-
What is the difference between a Level 0 and a Level 1 DFD?A Level 0 DFD, or context diagram, provides a high-level overview of the entire system as a single process. A Level 1 DFD breaks that central process down into more detailed sub-processes. This allows viewers to see the internal functional modules and specific data paths within the system.
-
How does a DFD differ from a traditional flowchart?While flowcharts focus on the sequence of steps, logic, and control flow of a program, DFDs focus strictly on the movement of data. A DFD shows what happens to the information rather than the timing or the specific order of operations, making it better for high-level system analysis.
-
What are the most common notation styles for DFDs?The two most popular notation styles are Yourdon & DeMarco and Gane-Sarson. Both use similar concepts but different shapes. For example, Yourdon & DeMarco uses circles for processes, while Gane-Sarson uses rounded rectangles. Choosing a consistent style is important for maintaining clear and professional technical documentation.
Learn about Data Flow Diagram
Stop drawing. Start describing.
AI diagramming isn't just text-to-diagram.
AI now understands any input, fetches live data, adapts through dialogue, and works everywhere.
Free data flow diagram templates from EdrawMax