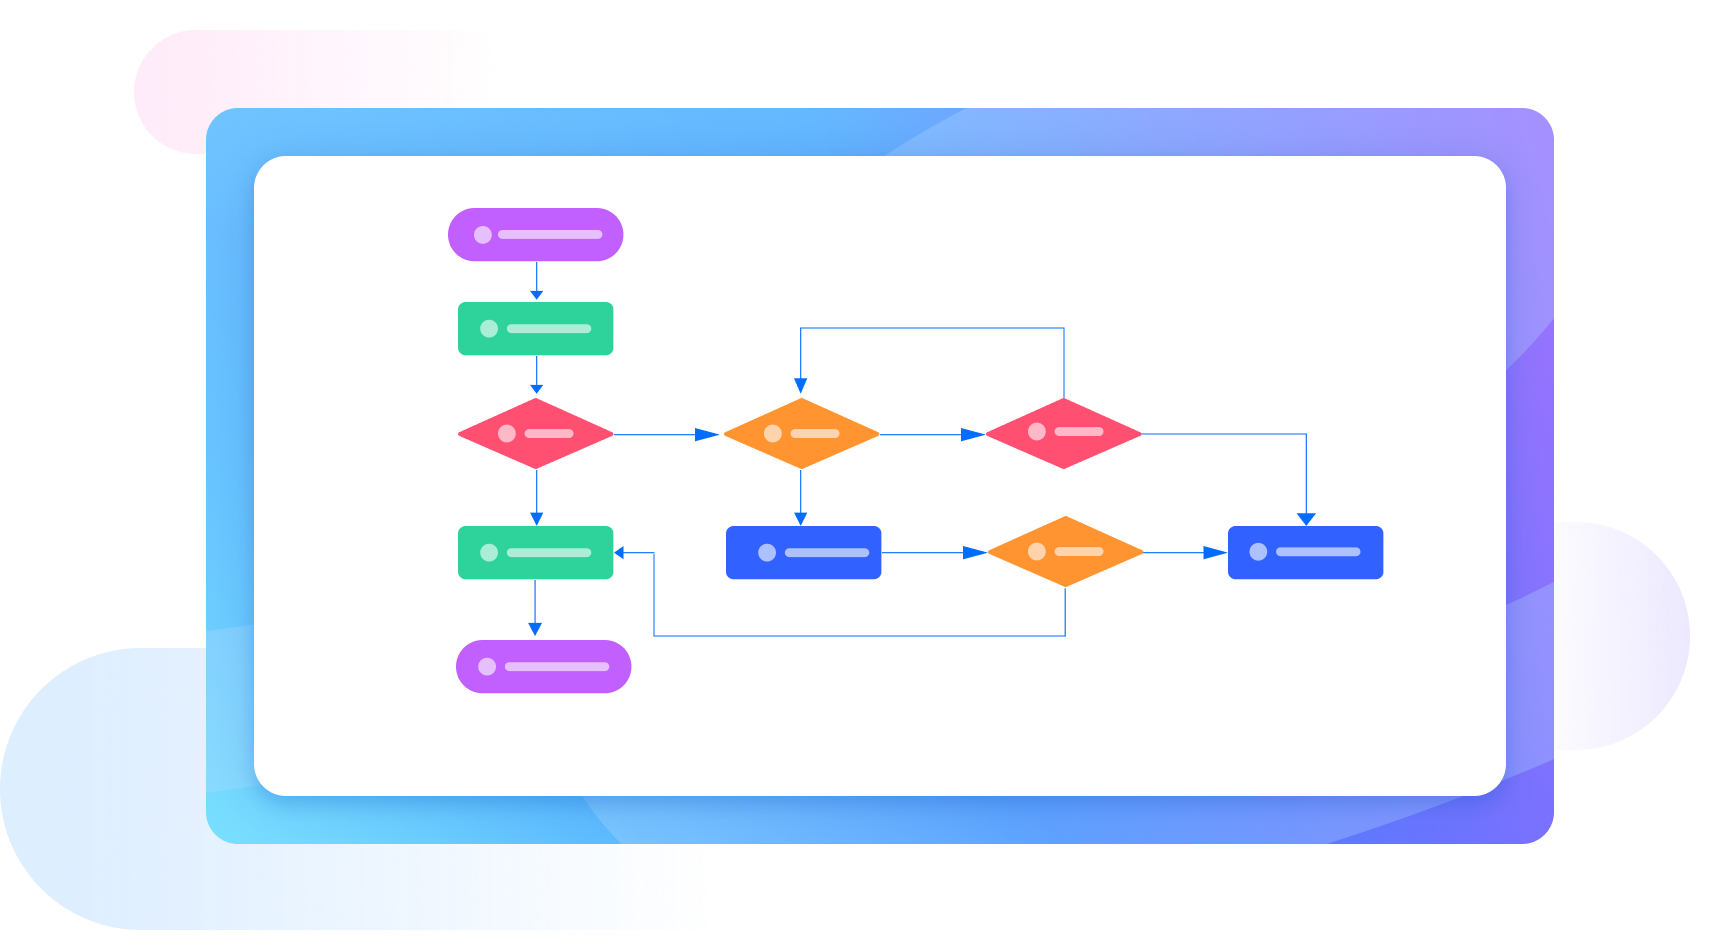
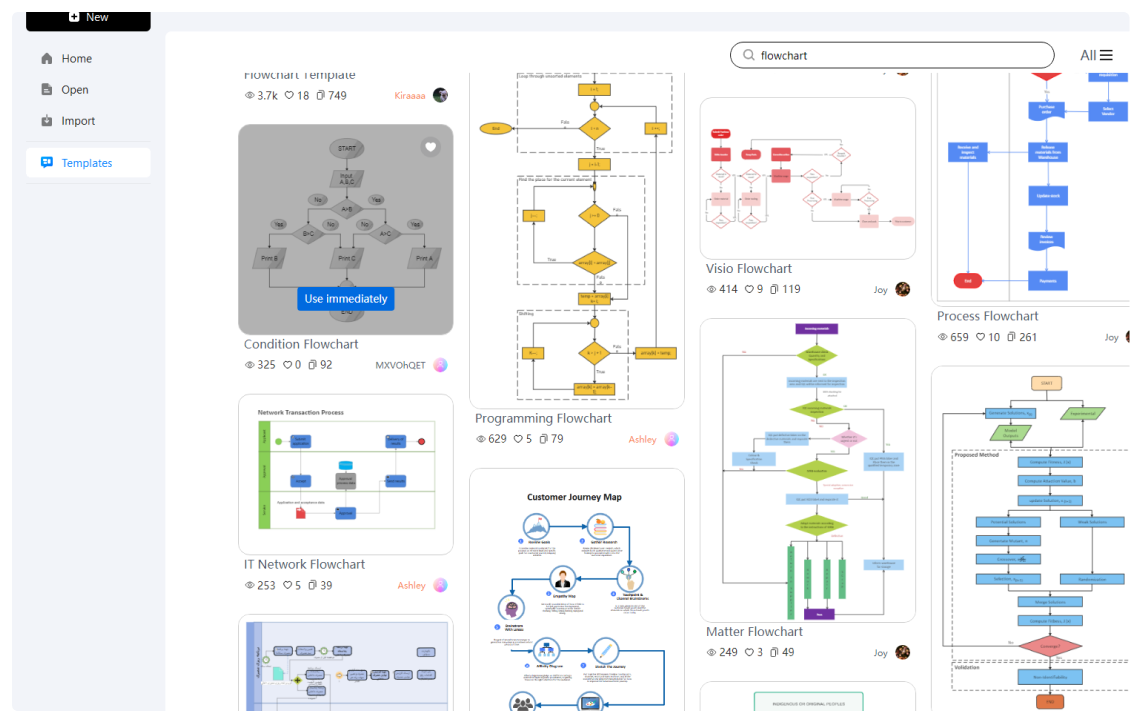
Simple flowchart maker with free templates
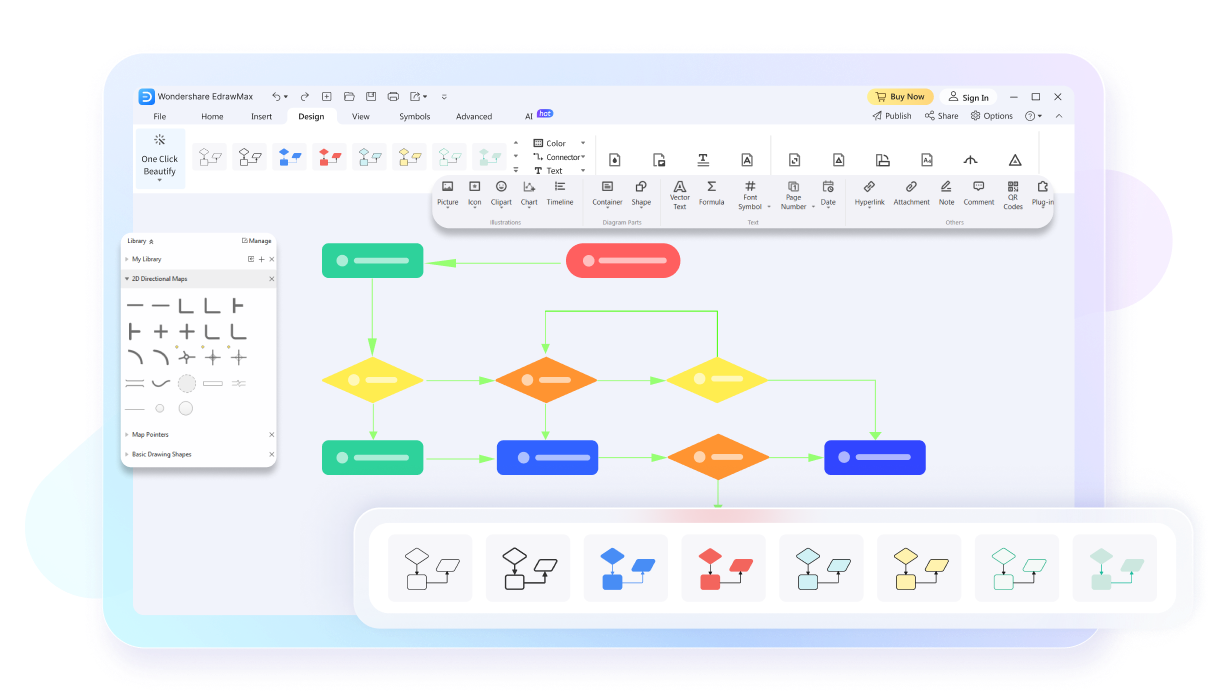
Create professional flowcharts in minutes with EdrawMax flowchart tool. Whether you’re documenting workflows, mapping processes, or planning projects, our drag-and-drop tool transforms complex ideas into clear, visual diagrams.
Why Use EdrawMax Flowchart Generator?
Give your flowcharts a personalized, human touch with EdrawMax’s hand-drawn style. Unlike rigid digital diagrams, this feature:
- Adds authenticity to presentations and brainstorming sessions.
- Makes complex processes feel more approachable for stakeholders.
- Perfect for educators, creative teams, and client-facing materials.

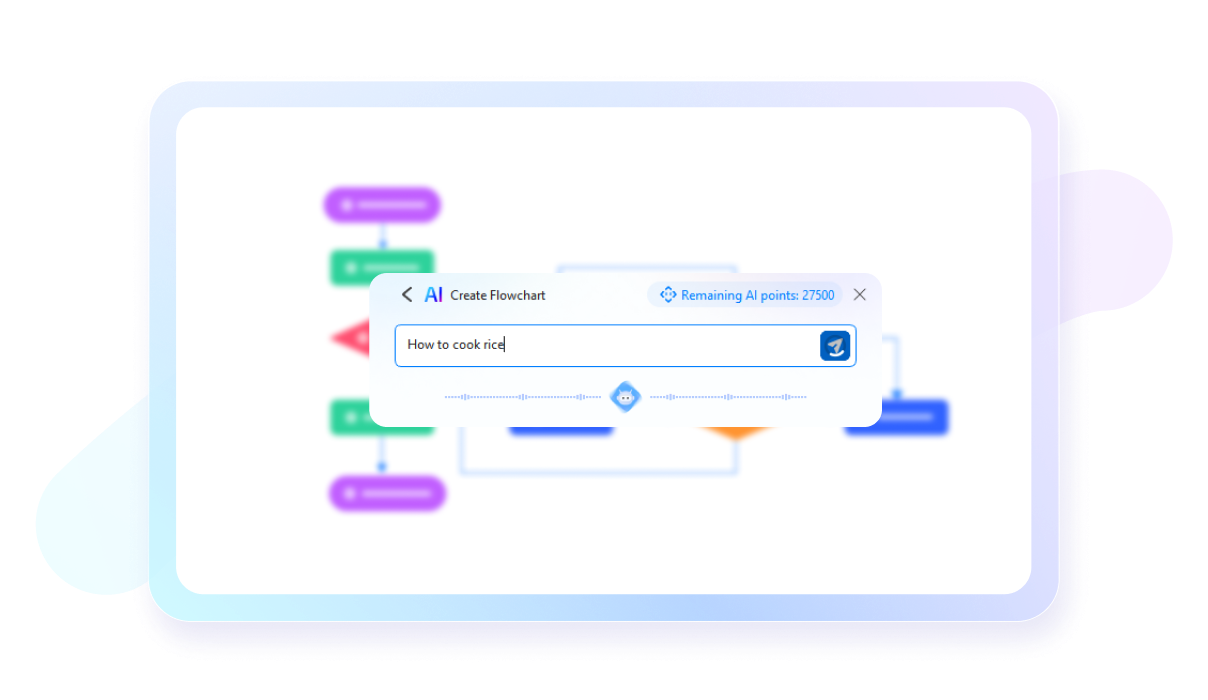
Turn plain text or code into polished flowcharts automatically with flowcharts.js integration:
- Simply paste your structured text (e.g., pseudocode, step-by-step instructions).
- EdrawMax instantly generates a professional layout, saving hours of manual work.
- Ideal for developers documenting algorithms or managers streamlining SOPs.
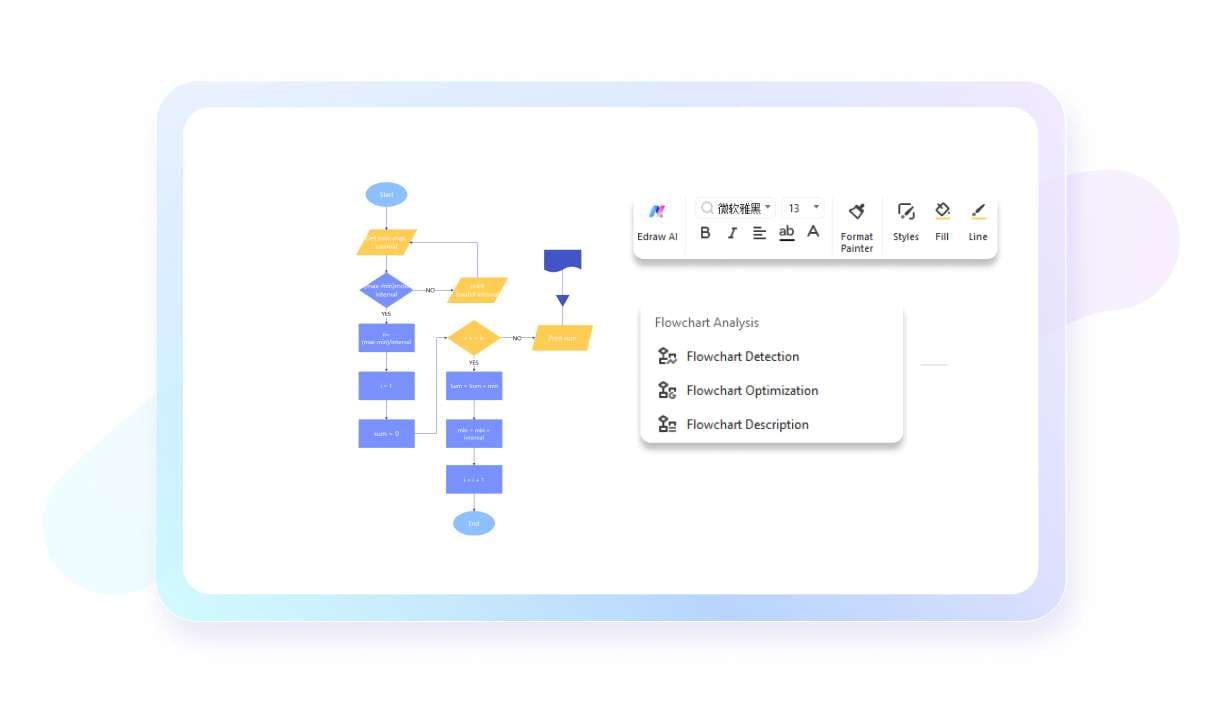
Let EdrawMax’s AI assistant analyze and refine your diagrams:
- Spot redundancies: AI identifies and removes unnecessary steps.
- Improve clarity: Suggests better layouts or symbols for readability.
- Learn as you go: Adapts to your industry’s best practices (e.g., UML for software).
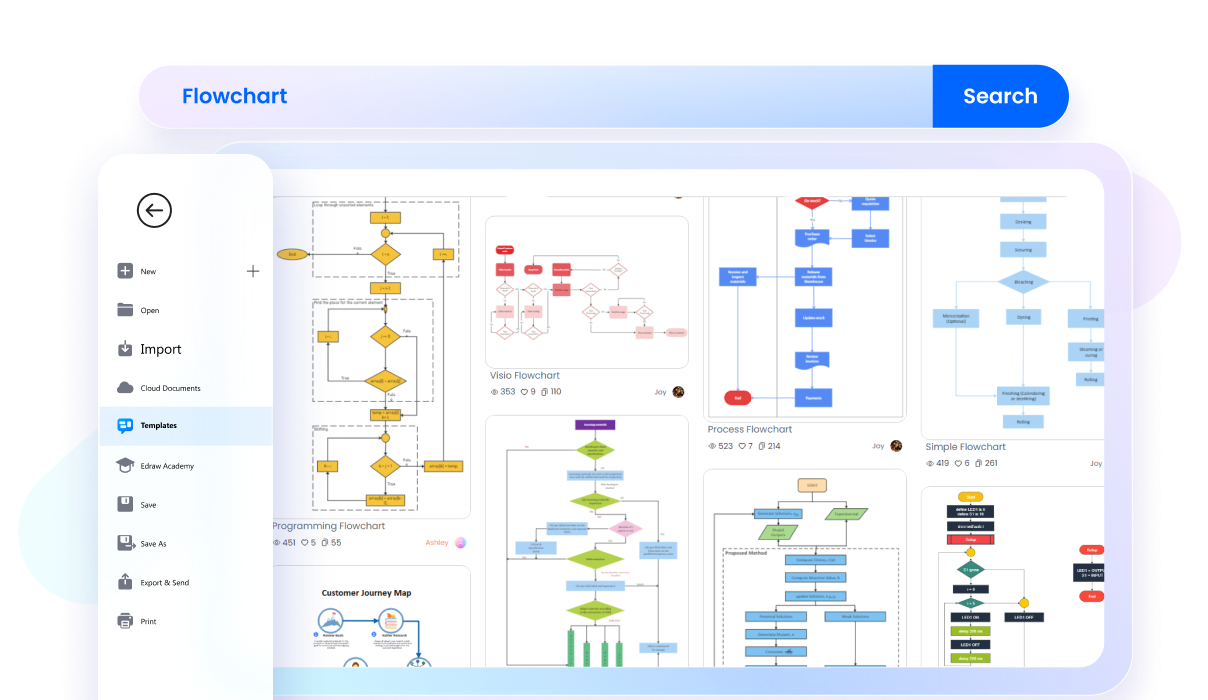
Jumpstart your diagrams with industry-specific templates:
- Software Development: UML, DevOps pipelines.
- Business: Org charts, SWOT analysis.
- Education: Lesson plans, grading systems.
Fully tailor every element to your needs:
- Drag-and-drop symbols from 30+ specialized libraries (BPMN, ANSI, etc.).
- Apply company colors/fonts for brand consistency.
- Save custom elements to personal libraries for reuse.
Work seamlessly with teams:
- Simultaneous editing: Multiple users update live.
- Share via link/QR code: No login required for viewers.
- Version history: Track changes and revert if needed.
How to Make a Flowchart in 3 Simple Steps
What our users say
More EdrawMax floor plan tools
Discover more AI-powered diagram makers to boost your productivity.
FAQs About EdrawMax Flowchart Tools
-
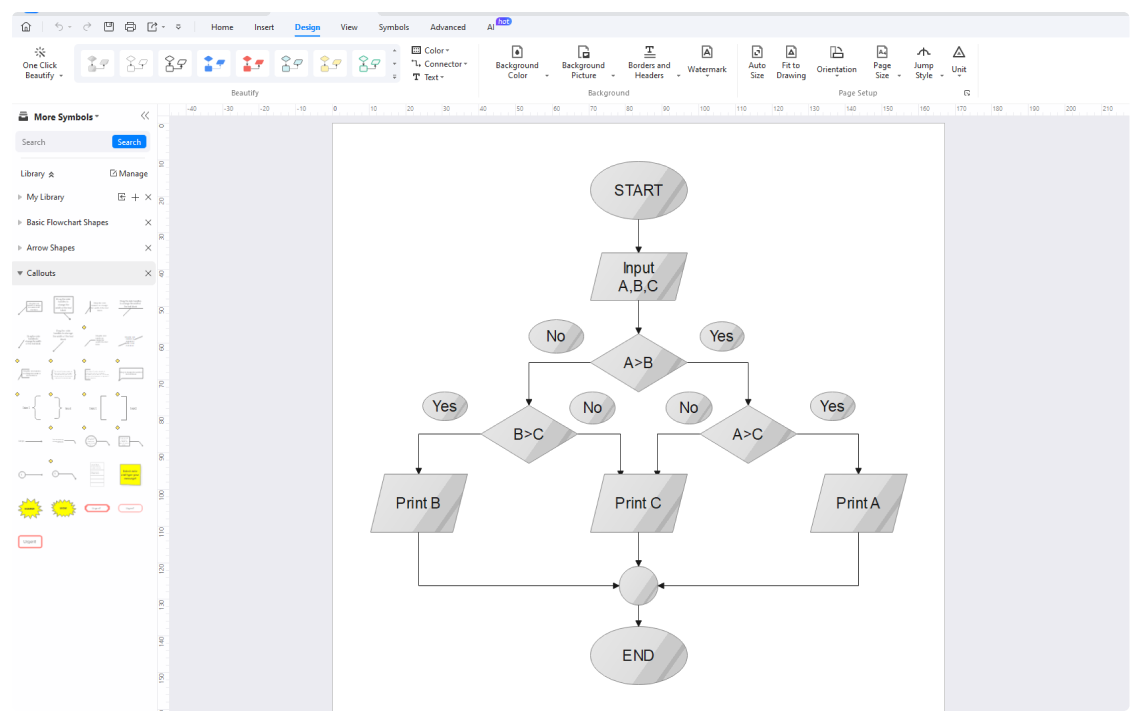
What is a flowchart?A flowchart is a visual representation of a process, system, or computer algorithm. It uses various shapes, like rectangles and diamonds, connected by arrows to show the step-by-step flow of information or actions. They are widely used to document, study, plan, and communicate complex processes in clear, visual diagrams.
-
What do the different shapes in a flowchart represent?Standard symbols have specific meanings: ovals represent the start or end points, rectangles signify a process or action step, and diamonds indicate a decision point requiring a "yes" or "no" answer. Parallelograms are used for inputs or outputs. Using these consistently ensures that anyone can interpret the diagram correctly.
-
What is the difference between a flowchart and a process map?While often used interchangeably, a flowchart is a general term for any diagram showing a sequence of steps. A process map is a specific type of flowchart that provides more detail about who is responsible for each task and includes performance metrics, often used in business process improvement initiatives.
-
How do I choose the right direction for my flowchart?Most flowcharts are designed to be read from top to bottom or from left to right. This standard orientation follows natural reading patterns, making the diagram easier to follow. It is important to maintain a consistent flow direction throughout the document to avoid confusing the viewer or creating visual clutter.
-
What are swimlane flowcharts?A swimlane flowchart organizes process steps into horizontal or vertical columns called "lanes." Each lane represents a specific department, team, or individual responsible for those actions. This format is particularly useful for showing how tasks hand off between different groups and identifying where delays might occur in cross-functional processes.
Learn about Flowchart
Stop drawing. Start describing.
AI diagramming isn't just text-to-diagram.
AI now understands any input, fetches live data, adapts through dialogue, and works everywhere.
Free flowchart templates from EdrawMax