Free AI infographic maker

Experience the power of EdrwaMax: effortlessly create stunning infographics with our vast collection of templates and symbols. Bring your vision to lifewith AI drawing and collaborate seamlessly with your team, anytime and anywhere.

Create without limits, collaborate without obstacles

Generate infographics using AI
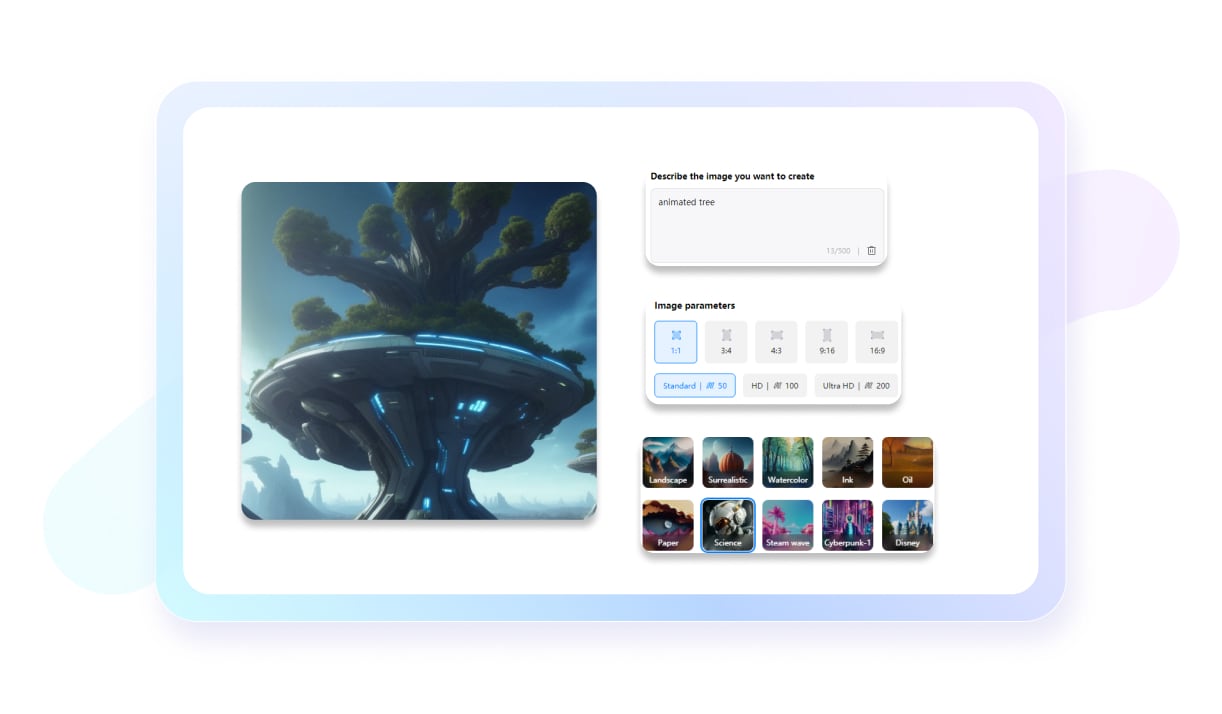
Unleash the power of AI to transform your ideas into stunning visuals. Whether it's generating drawings from text prompts or enhancing existing images, let your creativity soar. Elevate your infographics with visually appealing and impactful designs that captivate your audience. The possibilities are limitless!
Explore templates for all needs
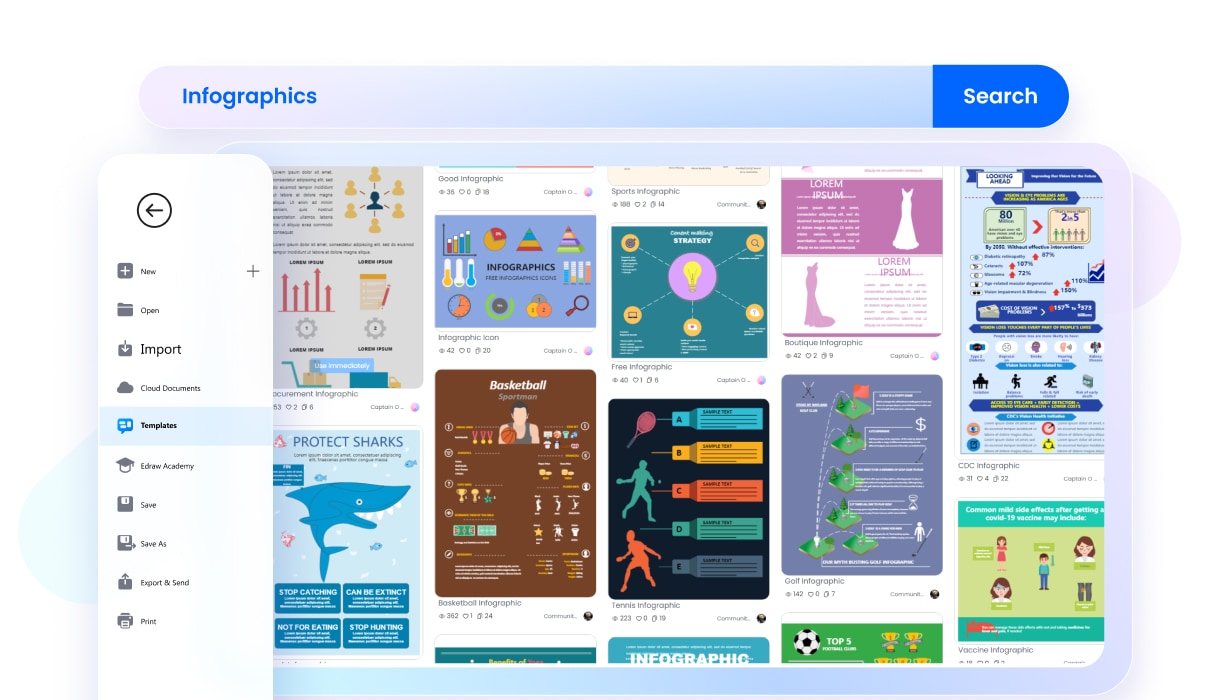
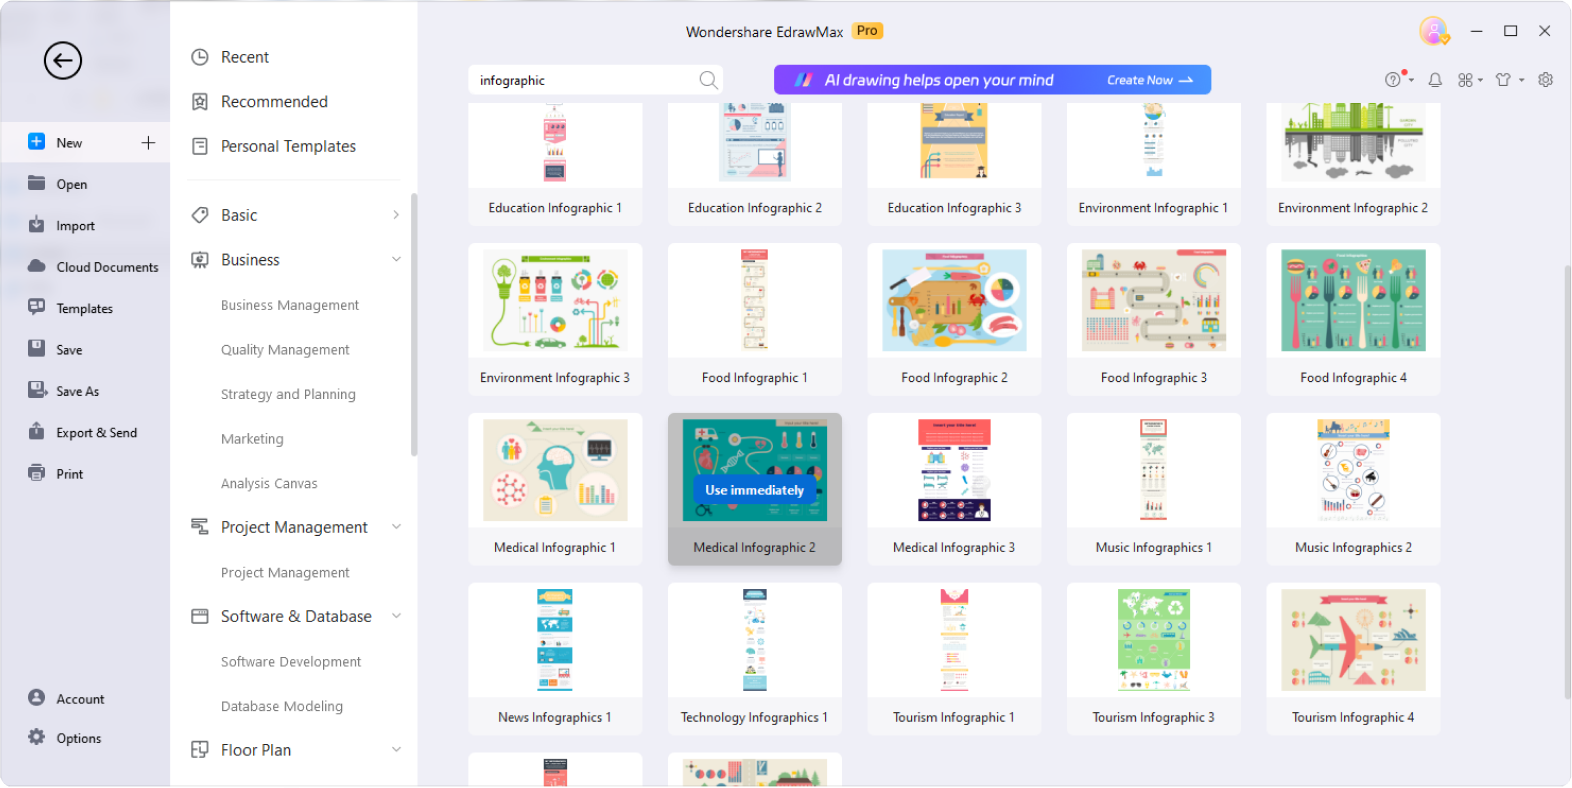
Embark on a creative journey with our thriving community, offering an extensive collection of over 16,000 templates. Explore and discover the perfect match for your needs. Let inspiration guide you as you effortlessly kickstart your project, ensuring a seamless and successful endeavor.
Customize at will.
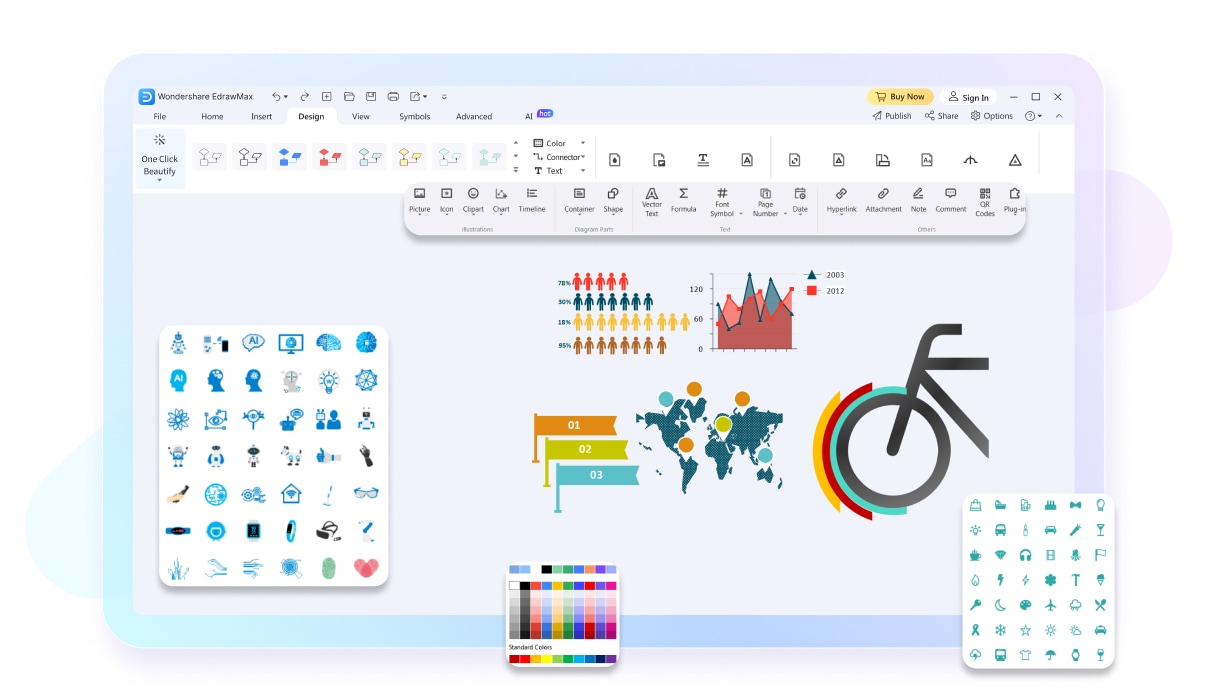
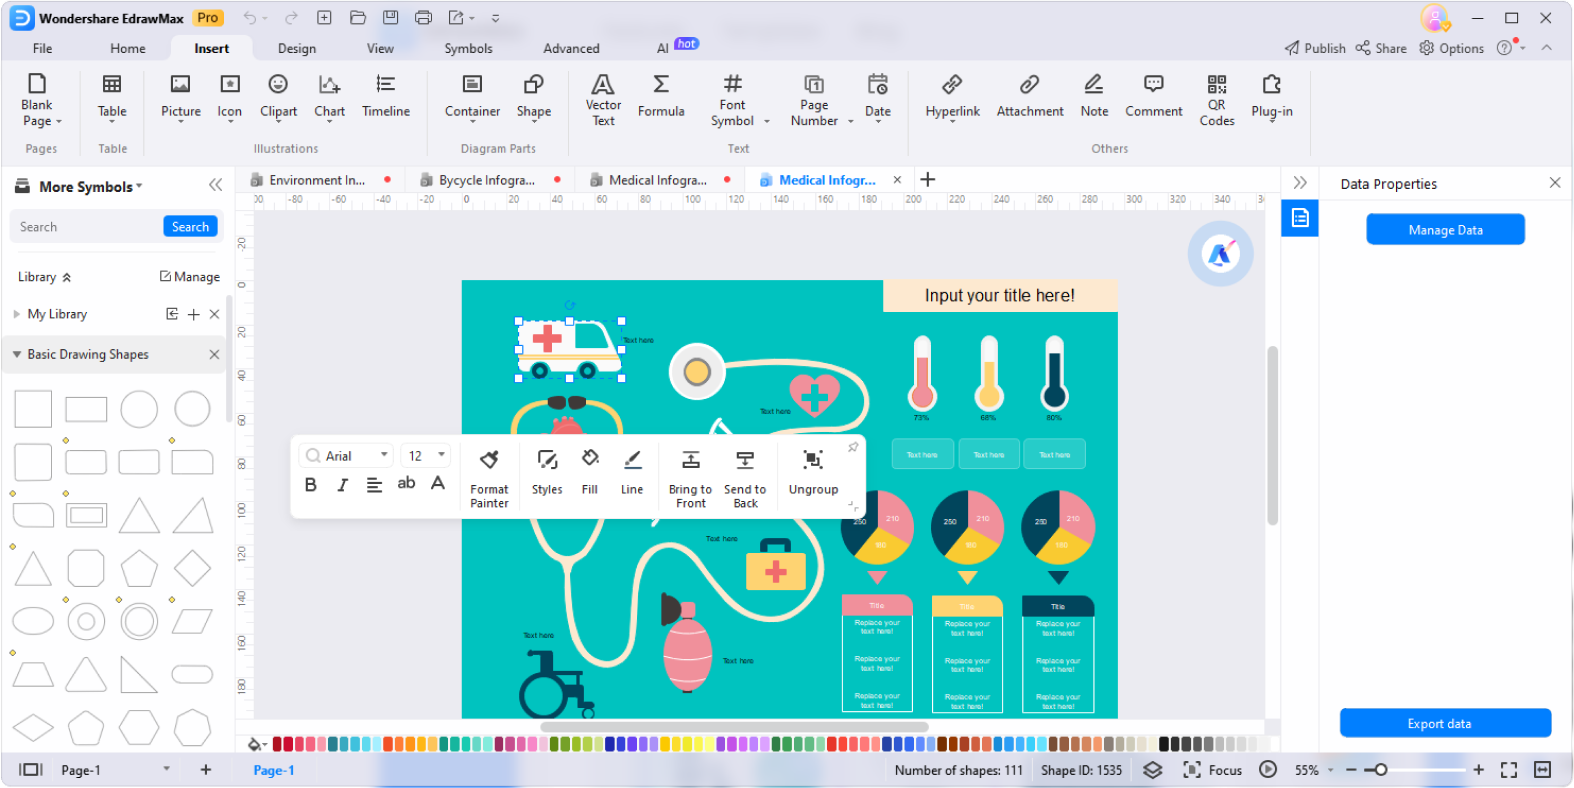
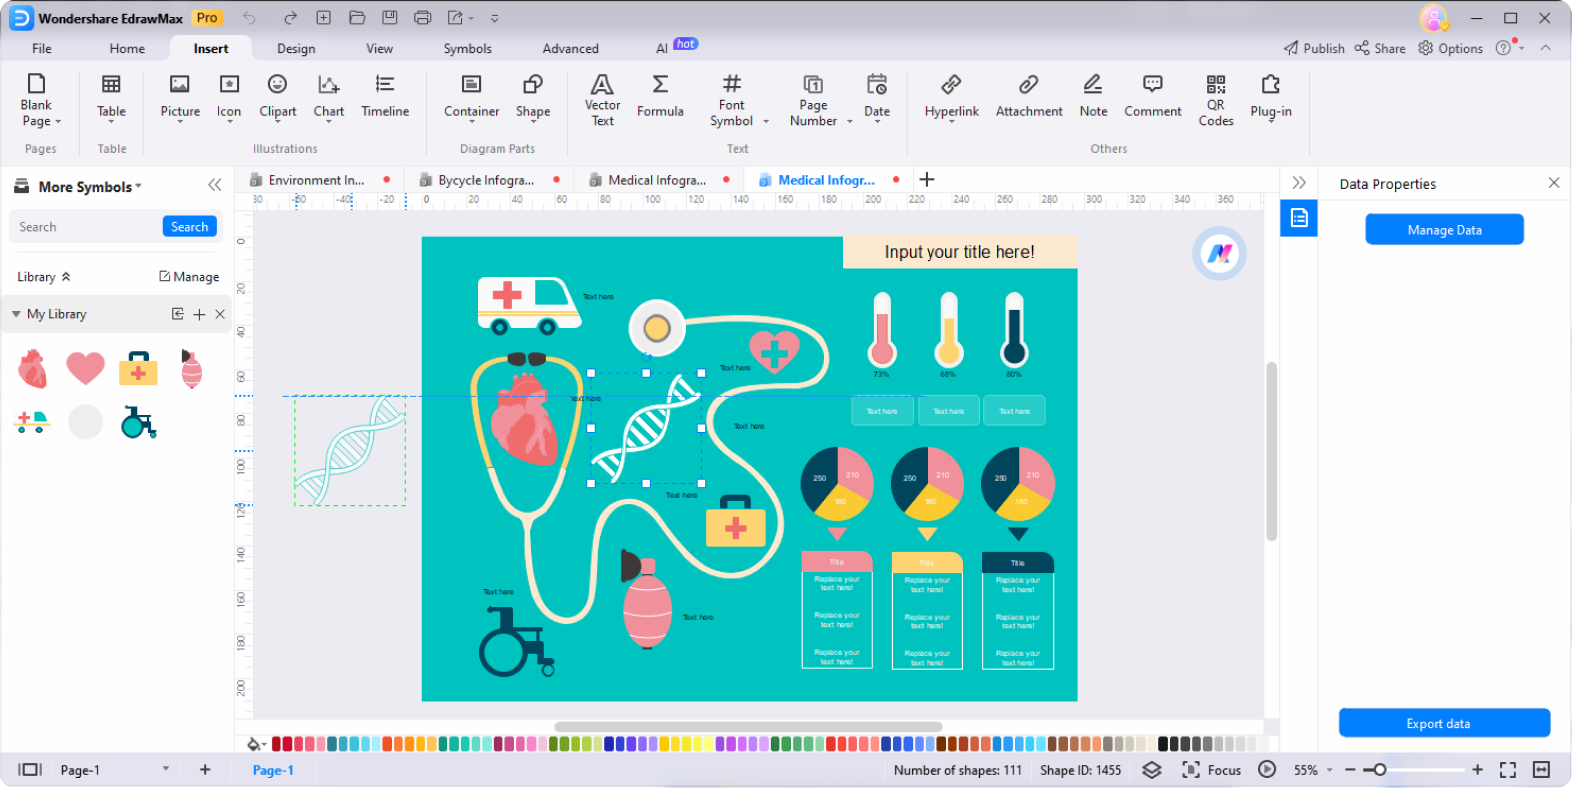
Unlock your creativity with EdrawMax's vast library of 26,000 symbols, including self-crafted and third-party pictures, icons, and cliparts. Utilize powerful shape tools to craft unique infographics. Seamlessly save your creations in personal libraries for future use, ensuring convenience and preserving your artistic brilliance.
Share documents in any format you like.
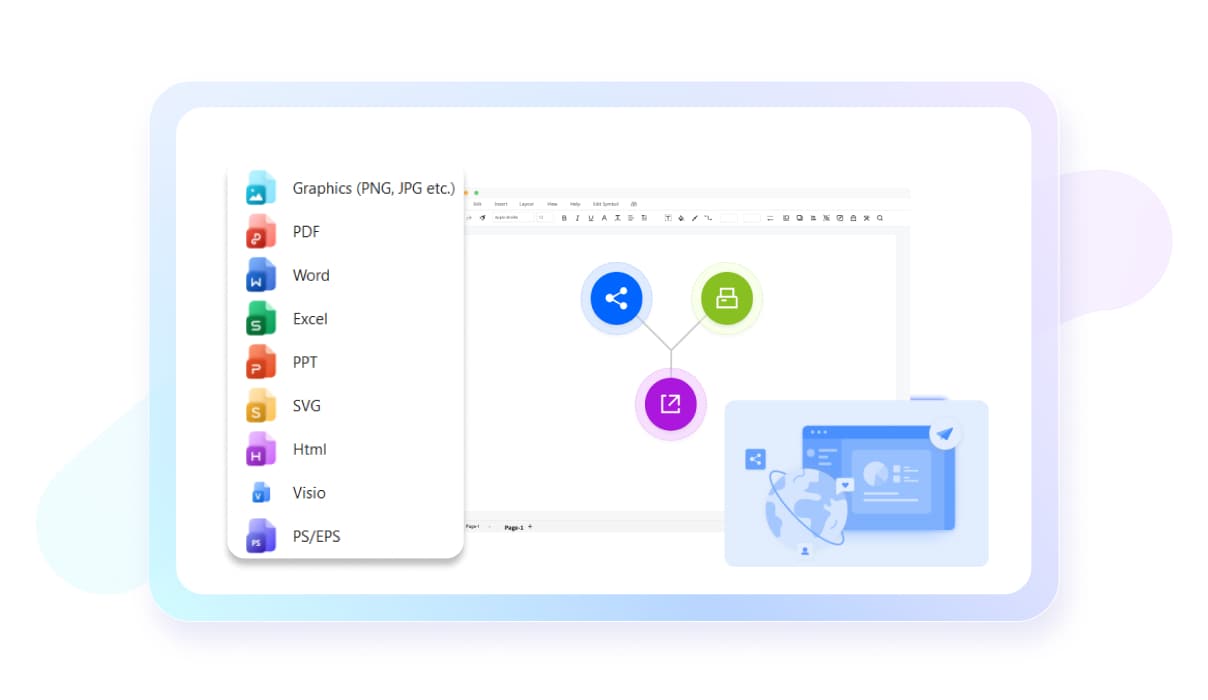
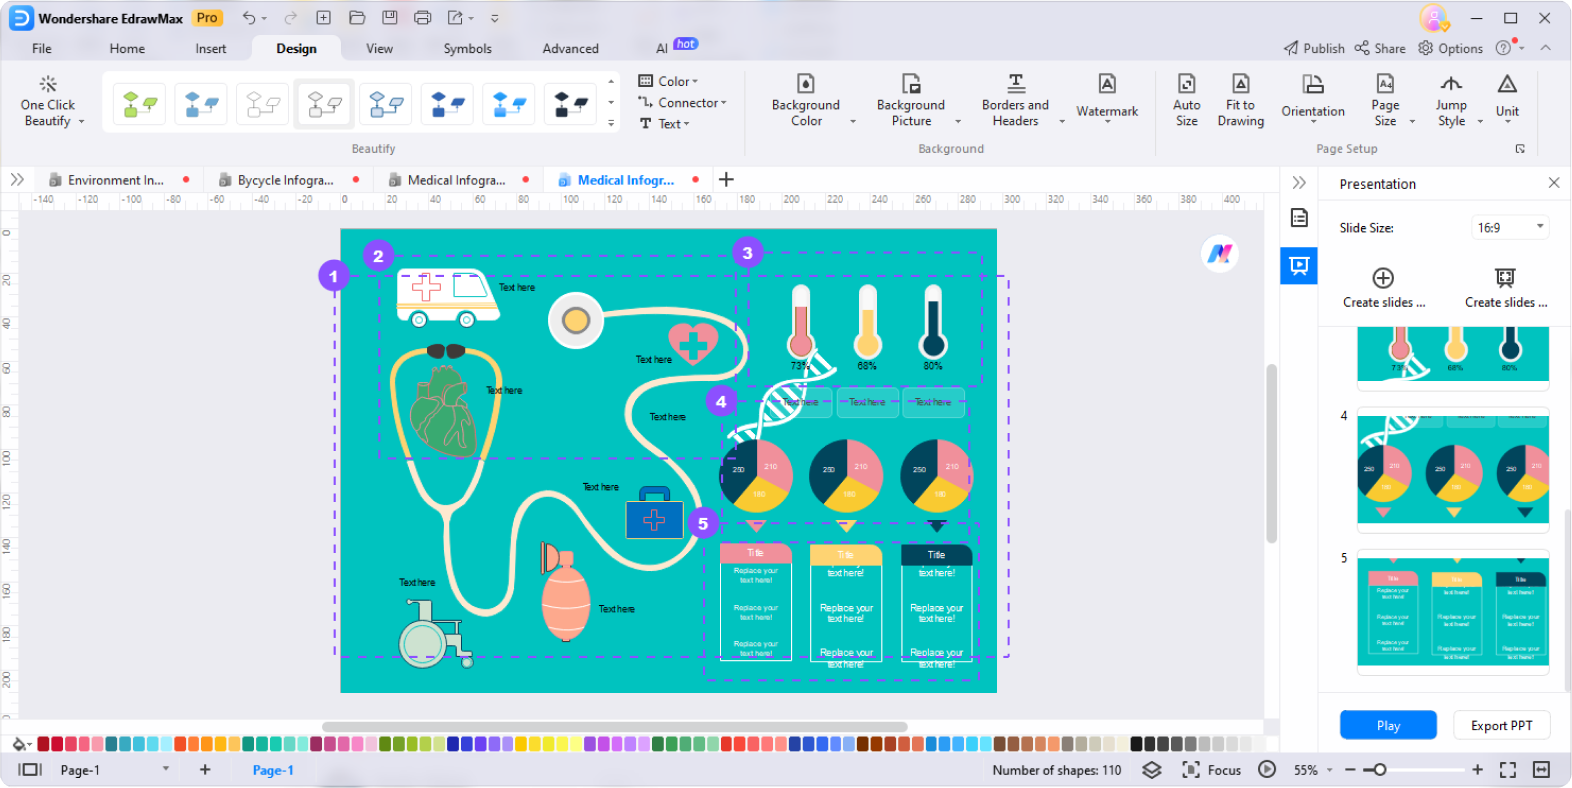
Effortlessly share your masterpieces with a multitude of export options. From PowerPoint to JPG, PDF to SVG and HTML, choose from a dozen formats to suityour needs. Seamlessly collaborate with team members and stakeholders, ensuring easy access and smooth communication for all.
Access infographics anywhere, anytime.
Experience the freedom of accessing and editing your infographics anytime, anywhere. With EdrawMax, enjoy seamless compatibility across all major operating systems and online platforms. Whether it's through your device or the cloud, empower your team members to effortlessly access and collaborate on your files, regardless of their operating system. Embrace flexibility like never before.

Infographic maker for everyone.

banner
Marketers
Use Infographics to enhance communication and engagement by presenting complex data in a visually appealing manner.
banner
Educators
Simplify complex concepts to promote comprehension and knowledge retention, making them useful for educators to enhance teaching materials.
banner
Journalists
Visually represent data and trends to make news articles more compelling and informative, thereby assisting journalists in storytelling.
banner
Social Media Managers
Use engaging creating viral content that drives traffic and increases brand visibility on social media platforms.
banner
NGO Employees
Infographics are powerful tools for raising awareness about social issues, visualizing statistics, and conveying compelling messages to drive action and support.
banner
Researchers
Present research findings in a concise and visually compelling format, facilitating the dissemination of information to a wider audience.

Why teams choose EdrawMax?

banner
Seamless Teamwork
EdrawMax facilitates real-time collaboration, allowing team members to work together on diagrams and share feedback instantly, fostering teamwork, and accelerating project progress.
banner
Enhanced Efficiency
With its intuitive interface, pre-made templates, and extensive symbol libraries, EdrawMax enables teams to create professional-quality diagrams quickly, saving time, reducing effort, and increasing productivity.
banner
All in One
EdrawMax allows for making 280+ types of diagrams including flowcharts, mind mapps, Gantt charts, timelines and more, streamlining workflows and eliminating the need for multiple software, enhancing convenience.
banner
Improved Communication
Use visually compelling diagrams to convey complex ideas, facilitating clear and concise communication within teams and with stakeholders, boosting understanding and decision-making processes.
What is
an infographic

An infographic is a visual representation of information, data, or knowledge that presents complex ideas or concepts in a clear, concise, and engaging manner. It combines text, visuals, and design elements to communicate information effectively and efficiently. Infographics are designed to simplify complex topics, making them easier to understand and remember.

The key feature of an infographic is its visual storytelling approach. It uses visuals such as charts, graphs, icons, illustrations, and images to present data or information in a visually appealing format. The use of colors, typography, and layout techniques further enhances the visual impact and readability of the infographic.

Infographics are widely used in various fields, including journalism, marketing, education, and data analysis. They help break down large amounts of information into digestible and shareable content, making it easier for audiences to grasp key insights or messages. By combining information and visuals, infographics have the power to engage and captivate viewers, making them an effective tool for communication and knowledge dissemination.

Benefits of
the infographic

Infographics offer several benefits that make them a popular and effective communication tool. First, infographics are highly visual, making complex information more accessible and engaging. By incorporating charts, graphs, icons, and illustrations, infographics help break down data and concepts into easily understandable visual representations.

Second, infographics are memorable. The combination of visuals and concise text in an infographic helps enhance information retention. Studies have shown that people remember visual content better than plain text, and infographics leverage this principle to deliver information in a more memorable and impactful way.

Third, infographics are shareable and versatile. Their visually appealing nature makes them highly shareable on social media platforms, websites, and presentations. Infographics can be easily resized, allowing them to be adapted for various mediums and purposes, such as blog posts, reports, or educational materials.

History of
the infographic

Infographics have a rich history that can be traced back centuries. However, modern infographics as we know them emerged in the 20th century. Pioneers like Brinton and Neurath developed methods for visually presenting statistical data, laying the foundation for information design.

With the advent of computer technology in the 1980s and 1990s, infographics underwent a significant transformation. Software programs like Adobe Illustrator empowered designers to create intricate and visually captivating visualizations. The rise of the internet further propelled the popularity of infographics, as they became easily shareable through websites and social media platforms.

In recent years, the accessibility of online infographic tools and templates has democratized infographic creation. Platforms such as Canva, Piktochart, and EdrawMax offer user-friendly interfaces and pre-designed templates, making it easier for individuals and businesses to create professional-looking infographics without extensive design skills.

Today, infographics continue to evolve, adapting to new technologies and design trends. They have become an integral part of visual communication, employed across various fields to simplify complex information and engage audiences in our visually-driven world.

Types of infographic.

Roadmap Inforgraphic
Flowchart Infographic
Timeline Inforgraphic

How to make infographics?

  • Determine your message, audience, and collect relevant data and information to include in your infographic.
  • Select a user-friendly tool like Canva or Piktochart that offers templates and design elements suitable for your infographic.
  • Browse through the available templates and choose one that aligns with your content and visual style preferences.
  • Modify the template by adding your data, text, charts, icons, and visuals. Arrange and format the elements to create a visually appealing and organized layout.
  • Incorporate images, illustrations, or graphs to visually represent your data and make your infographic more engaging and informative.
  • Incorporate images, illustrations, or graphs to visually represent your data and make your infographic more engaging and informative.

What our customers say.

Olivia Carter, teacher
As a teacher, I find EdrawMax to be an invaluable tool for creating visually appealing and informative infographics for my lessons. The wide range of templates and easy-to-use interface allows me to quickly design engaging visuals that enhance student understanding and make complex topics more accessible.
Marcus Davis, marketer
EdrawMax has become my go-to tool for creating stunning infographics that captivate my audience. The vast collection of design elements, including icons, charts, and customizable templates, allows me to craft visually compelling and informative graphics for my marketing campaigns. It's an essential asset in my toolkit for creating visually striking content that drives conversions.
Aisha Williams, social media manager
Managing social media accounts can be demanding, but EdrawMax has simplified the process of creating engaging infographics. The platform's user-friendly interface and extensive library of visual assets enable me to design captivating graphics that stand out in the crowded social media landscape. EdrawMax has significantly enhanced our brand's social media presence and boosted our audience interaction.

FAQs about infographic maker.

  • Yes, you can create basic infographics in Microsoft Word by utilizing its built-in shapes, charts, and text formatting options. However, for more complex and visually appealing infographics, dedicated infographic design software or online tools like EdrawMax would be more suitable.
  • Yes, you can create infographics in PowerPoint by leveraging its features such as shapes, SmartArt graphics, charts, and text formatting options. PowerPoint offers a variety of design tools and customization options to create visually appealing infographics for presentations, reports, or online sharing. While PowerPoint provides basic design features, tools specifically designed for infographic creation like EdrawMax offer a wider range of templates, icons, charts, and customization options.
  • There are plenty of infographic makers. For example, you can use online tools like EdrawMax. Sign up or log in, select a template or start with a blank canvas, customize the design by adding text, images, and visual elements, and finalize your infographic. Download or share it as needed.
  • There are several great infographic makers available, each with its own strengths. Some popular options include Canva, Piktochart, Venngage, Adobe Illustrator, and EdrawMax. The best infographic maker depends on your specific needs, preferences, and level of design expertise.
  • The easiest way to make infographics is to choose beginner-friendly tools with easy-to-use customization tools and start with a ready-made template. We recommend you try EdrawMax and choose a template to start with. You will find it a breeze to create visually appealing infographics without any design experience.