Free Gantt chart maker powered by AI


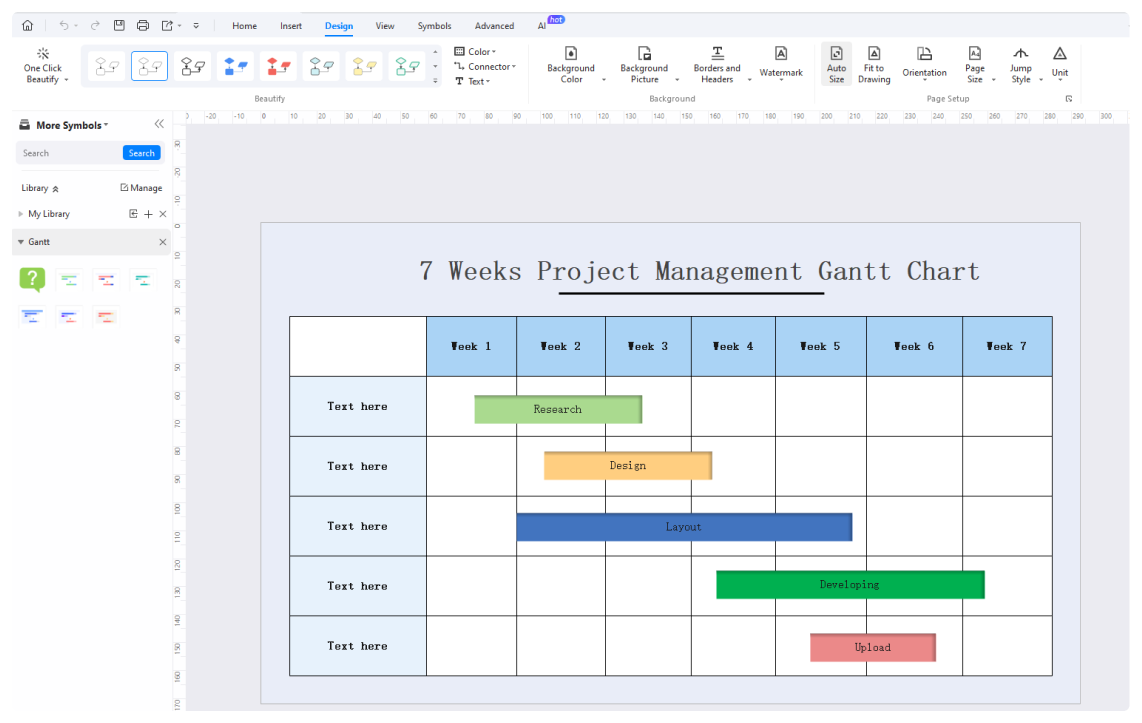
Create a Gantt chart easily with our rich templates and intuitive UI. Analyze and modify Gantt charts using AI with a click for better project management.

Available for:
Simple flowchart maker with free templates

Free Gantt chart templates from EdrawMax

Construction Gantt Chart
Simple Gantt Chart
Research Gantt Chart
Blank Gantt Chart
Blank Gantt Chart
Website Operation Gantt Chart
Explore More Templates

Why Use EdrawMax Gantt Chart Maker?

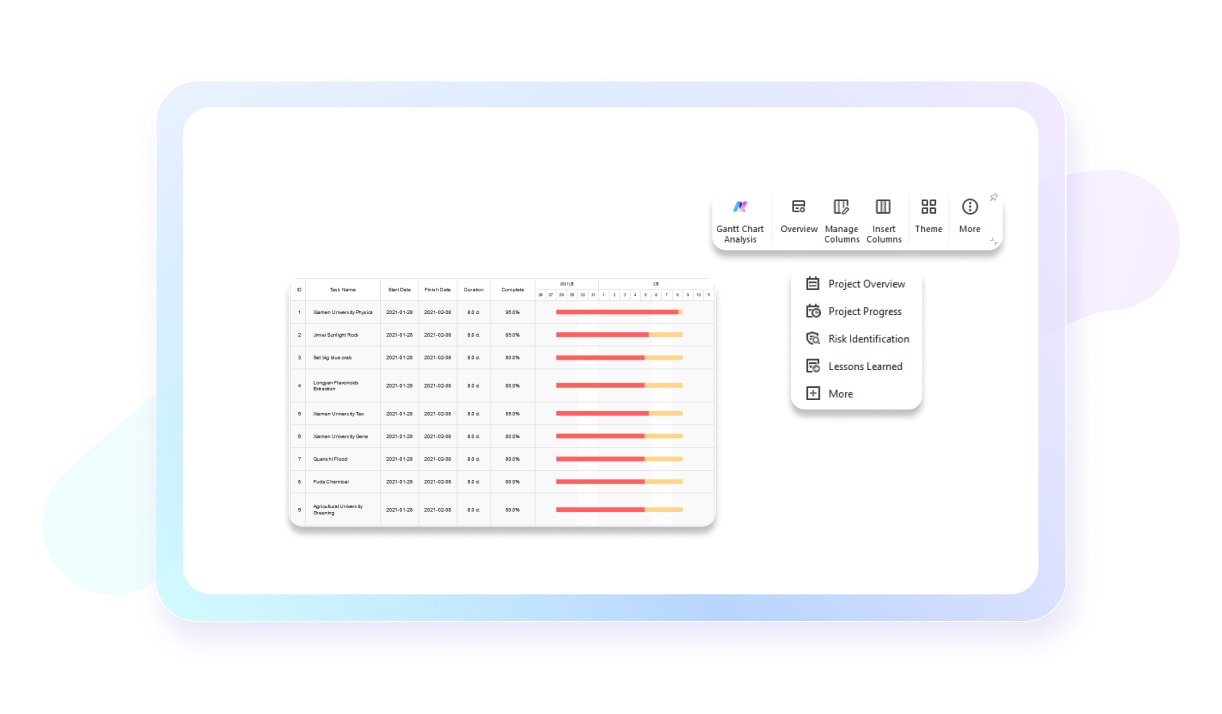
Optimize your Gantt charts with AI

Analyze your Gantt chart with the AI Gantt chart Analysis feature to generate reports on project overview, progress, and risk assessment. Ask AI to give suggestions. Edit and optimize the Gantt charts to ensure a successful project.
ai
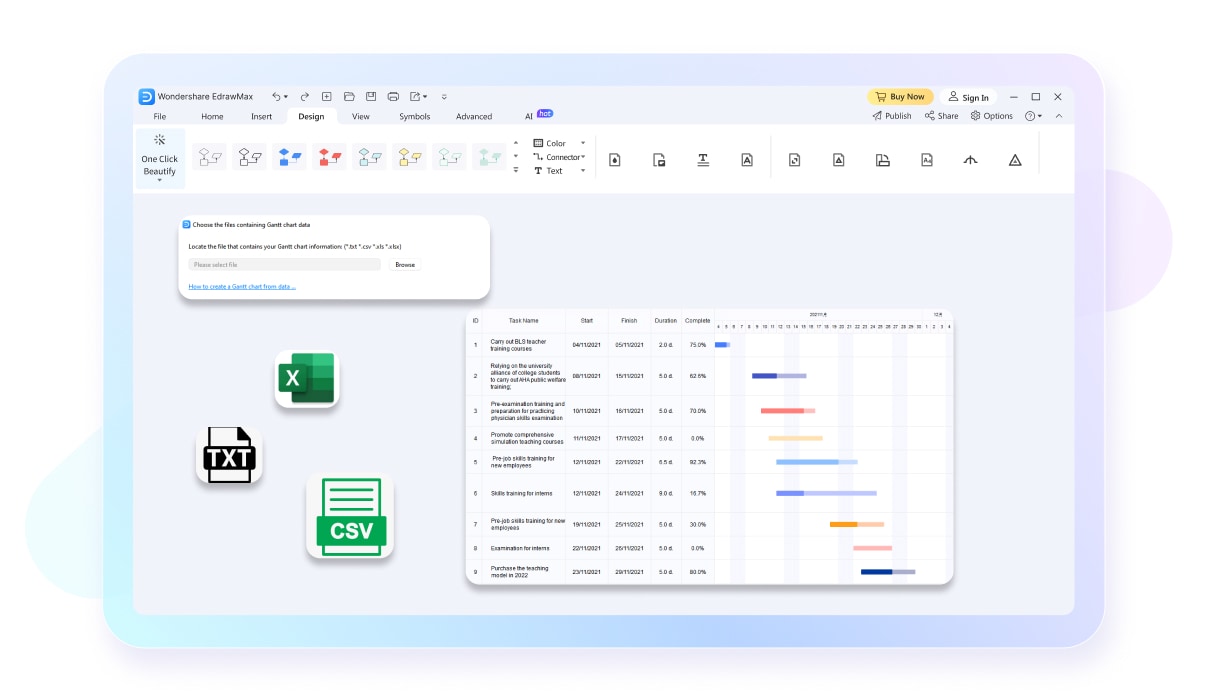
Convert files to Gantt charts

Simply import Gantt chart data from .txt, .csv, .xls, and .xlsx files. One step to convert data into a Gantt Chart. Saves your time from one-by-one entry.
templates
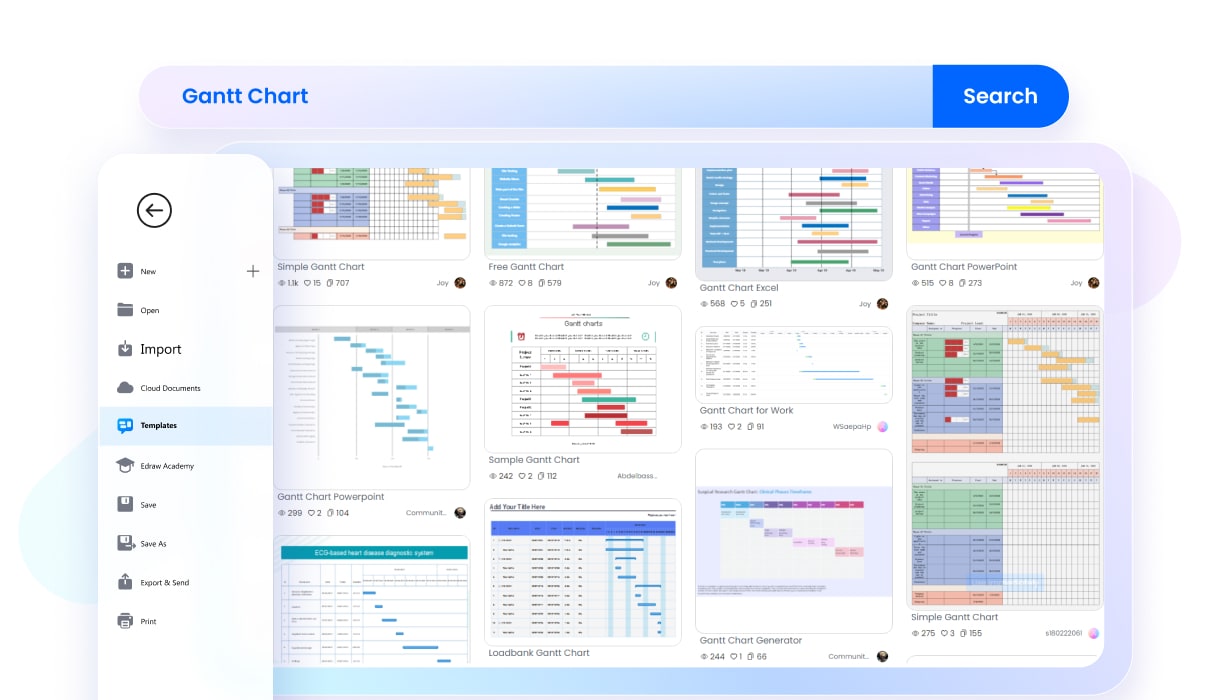
Explore a huge collection of free templates

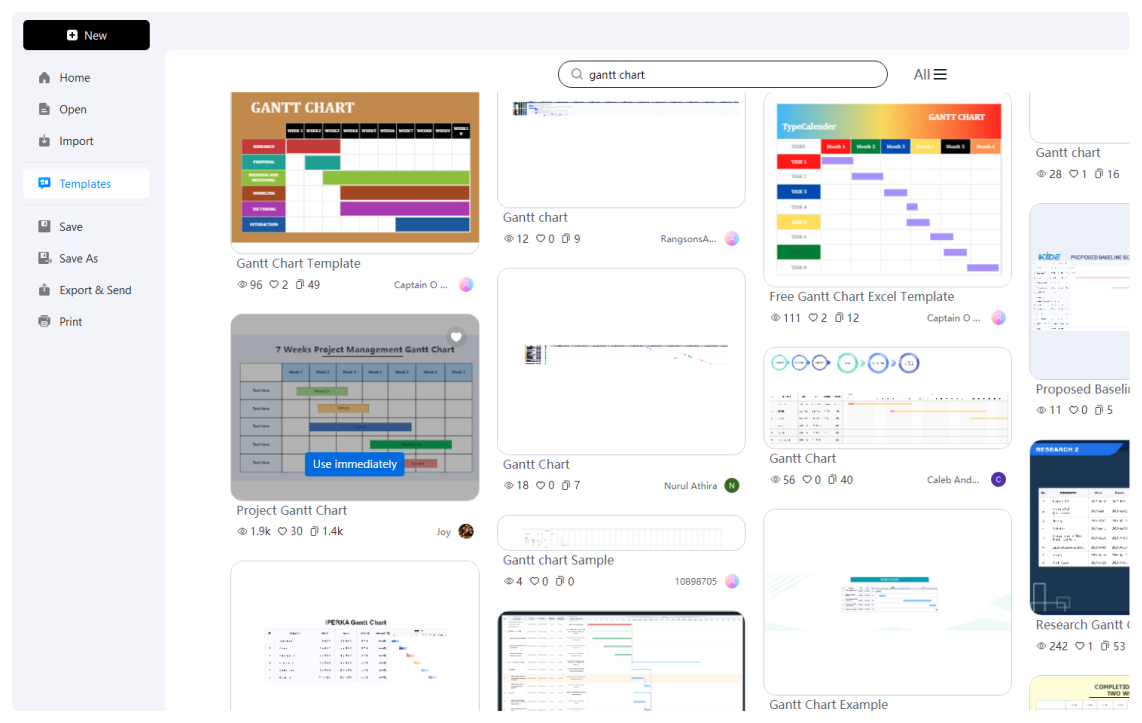
Explore EdrawMax template community which boasts over 20,000 templates in total including a number of Gantt charts. Browse to select an ideal Gantt chart. Use it directly. Replace the data and done!
ai
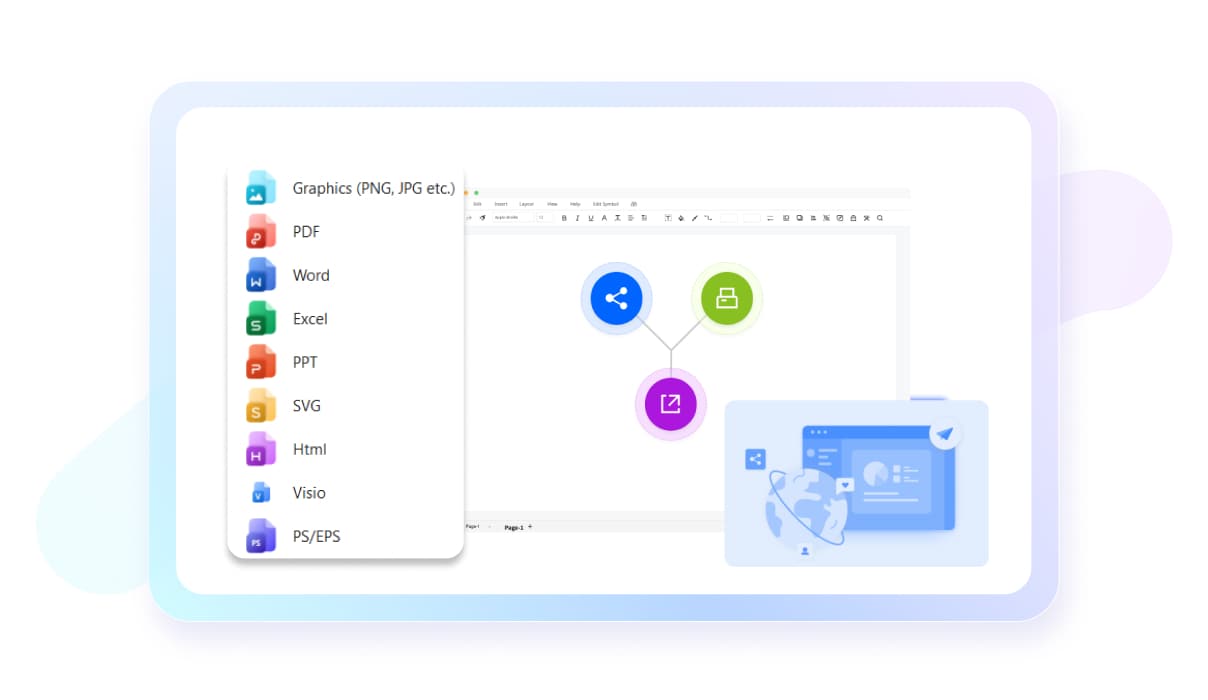
Export and share your Gantt charts

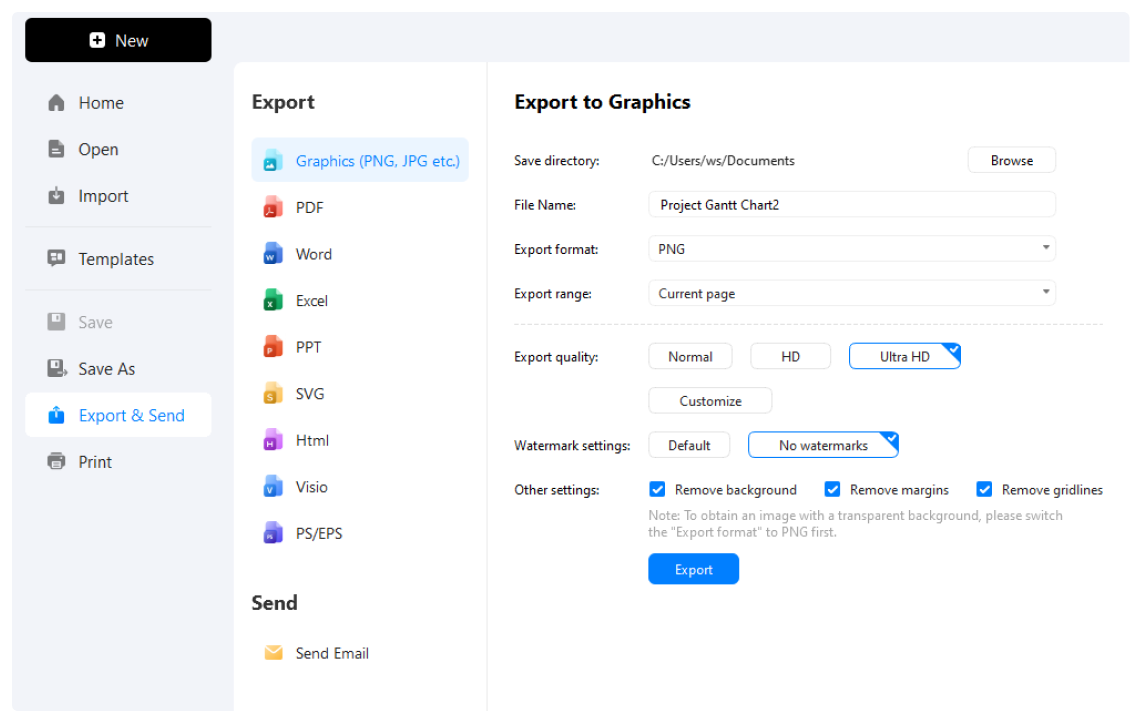
Export a Gantt chart in formats like PDF, JPG, PowerPoint, Word, and more. Share the Gantt chart with anybody via emails or DMs. View and edit the Gantt chart easily.
templates
Edit Gantt charts on the cloud

Diagram on a computer or a mobile device. Or, you can create a Gantt Chart on the web and work on it together with your team.

customize

What our users say

Sophie Walker, Senior Project Manager
Honestly, I was about ten seconds away from pulling my hair out with Excel trackers. Trying to build a Gantt chart in a spreadsheet is a total nightmare and usually ends in a broken formula. I switched to the Wondershare tool and it’s been a total game changer for our sprint planning. It’s not bloated like some of the enterprise software I’ve used in the past—it’s just snappy and intuitive. Dragging and dropping dependencies actually works without breaking the whole timeline. If you’re tired of fighting with clunky legacy tools, this is a solid bet for your sanity.
Mason Reed, Site Supervisor
Needed something to show the lads and the clients where we’re at without it being a right faff. Most of the software out there is way too over-complicated for what we actually need on-site. Wondershare’s Gantt maker is spot on—dead easy to set up and the visuals are clear as day. I can tweak a deadline on the fly and the whole chart updates itself without throwing a wobbly. It’s saved us a massive headache when explaining project shifts to the top brass. Proper bit of kit, this.
Aiden Cole, Product Owner
We’re a pretty lean team, so I can’t afford to spend half my week just managing a project board. I’ve tried the big-name "heavy hitters" and they just felt like total overkill for our workflow. This tool hits the absolute sweet spot. It’s got enough bells and whistles to handle complex dependencies and resource mapping, but it doesn't have that steep learning curve that kills productivity. The export options are clutch for our weekly stakeholder syncs. It just works, no fluff.

FAQs about Gantt chart makers

  • A Gantt chart is a visual project management tool that displays tasks against a timeline. It uses horizontal bars to represent the start date, duration, and end date of each activity. This layout helps teams see the entire project schedule at a glance, making it easier to track progress and deadlines.
  • A standard Gantt chart includes several essential elements: a list of tasks, a timeline across the top, bars representing task duration, and milestones for significant events. It also shows task dependencies, which indicate the relationships between activities, and identifies the team members responsible for completing each specific project task.
  • In a Gantt chart, a dependency is a relationship between two tasks where the start or finish of one depends on the other. For example, you cannot paint a wall until it is built. These links are usually shown as arrows, helping teams understand the correct sequence of operations.
  • Yes, Gantt charts can be adapted for Agile projects, though they are traditionally associated with Waterfall methods. In Agile, they are often used to visualize high-level roadmaps or release plans rather than daily tasks. This allows teams to maintain a long-term vision while still working in flexible, iterative short-term sprints.
  • While both are project management tools, a Gantt chart focuses on a timeline and task durations using a bar format. A PERT chart uses a network diagram to focus on task dependencies and logical flow. Gantt charts are better for progress tracking, whereas PERT charts excel at initial planning.

Stop drawing. Start describing.

AI diagramming isn't just text-to-diagram.
AI now understands any input, fetches live data, adapts through dialogue, and works everywhere.