Free online ER diagram maker
Effortlessly make ER diagrams online for free with our rich templates and symbols.
Why Use EdrawMax ER Diagram Maker?
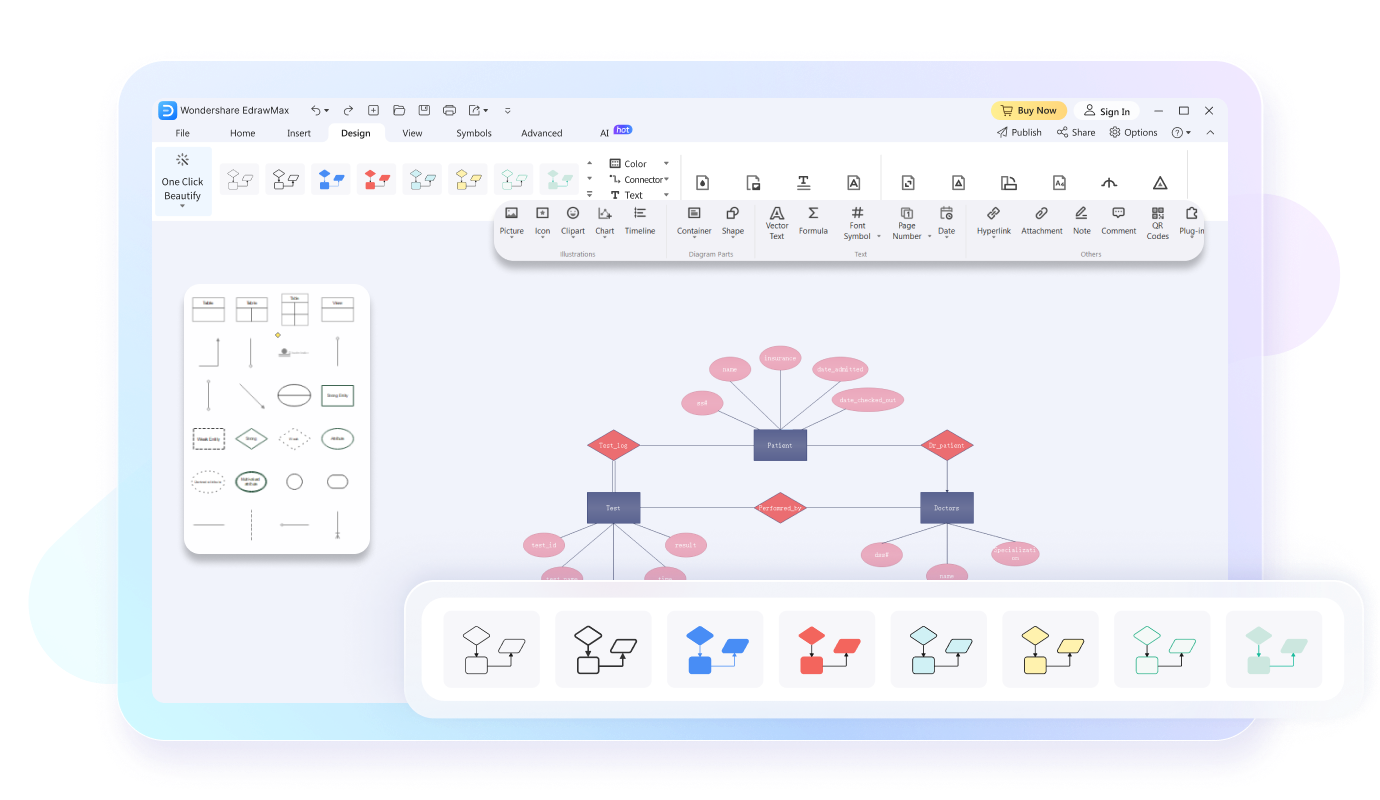
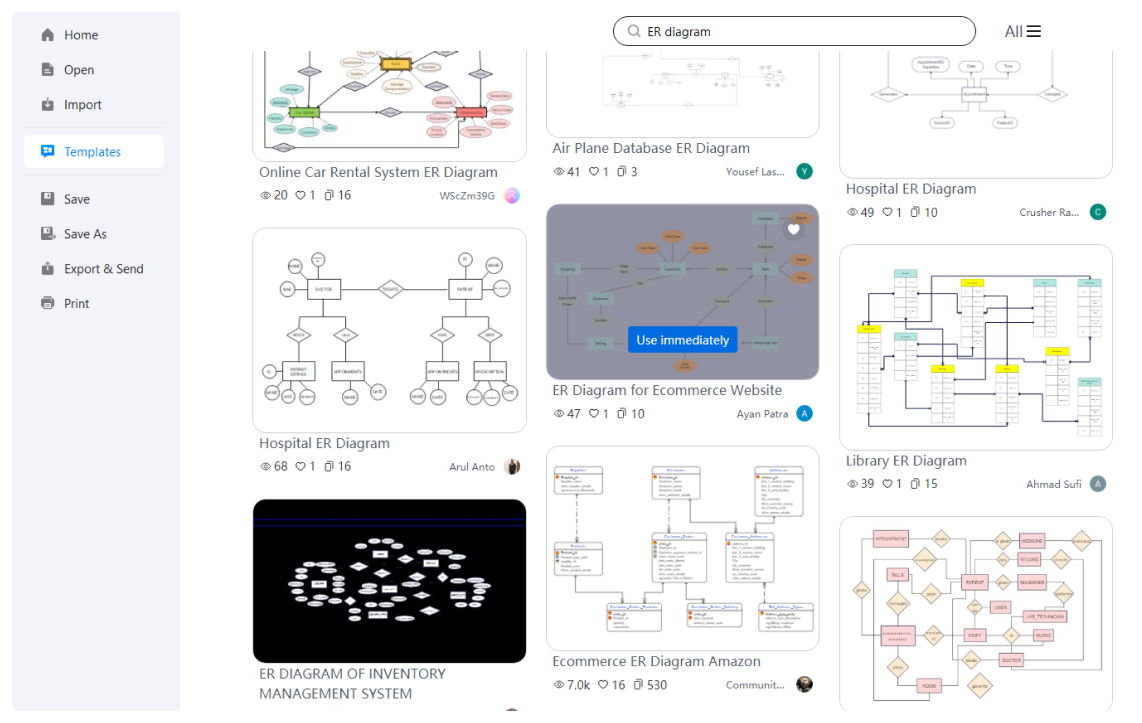
Draw inspiration from one of our professionally made templates. Browse through a wide range of templates tailored to various industries and purposes, helping yourself save time and effort by providing a starting point for your diagrams.
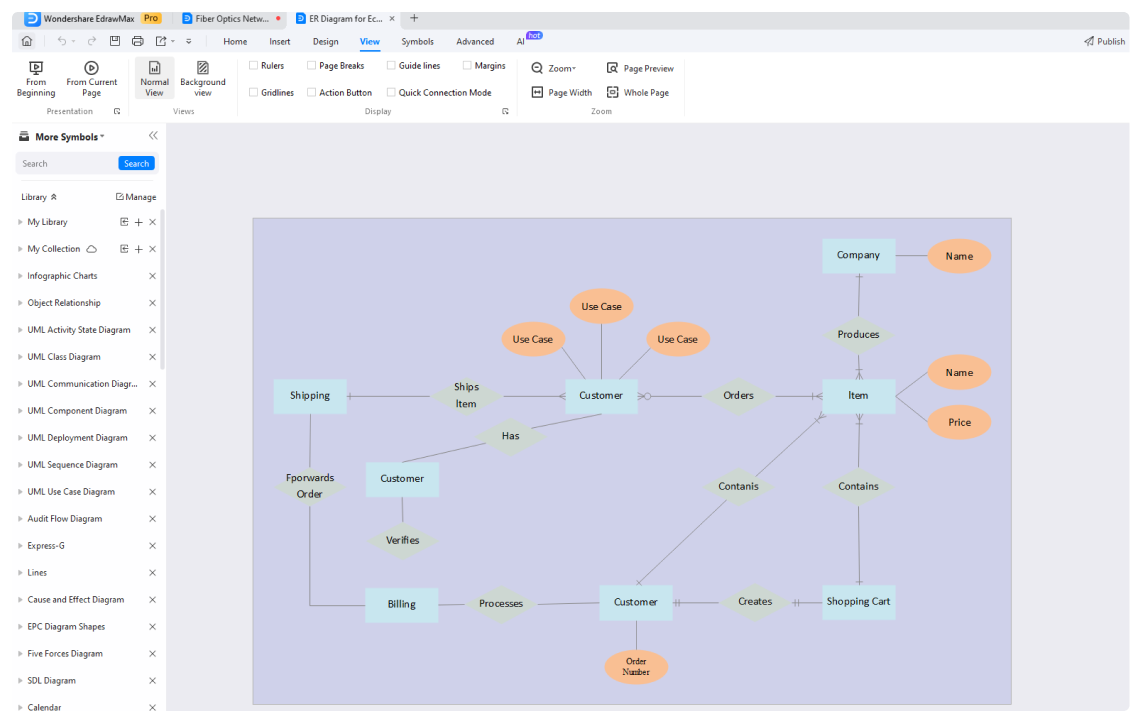
With a sleek and intuitive interface, EdrawMax offers similar powerful functions as Visio but is much easier to use. Streamline diagram creation with EdrawMax’s drag-and-drop functionality, extensive library of shapes and symbols, and rich editing tools.
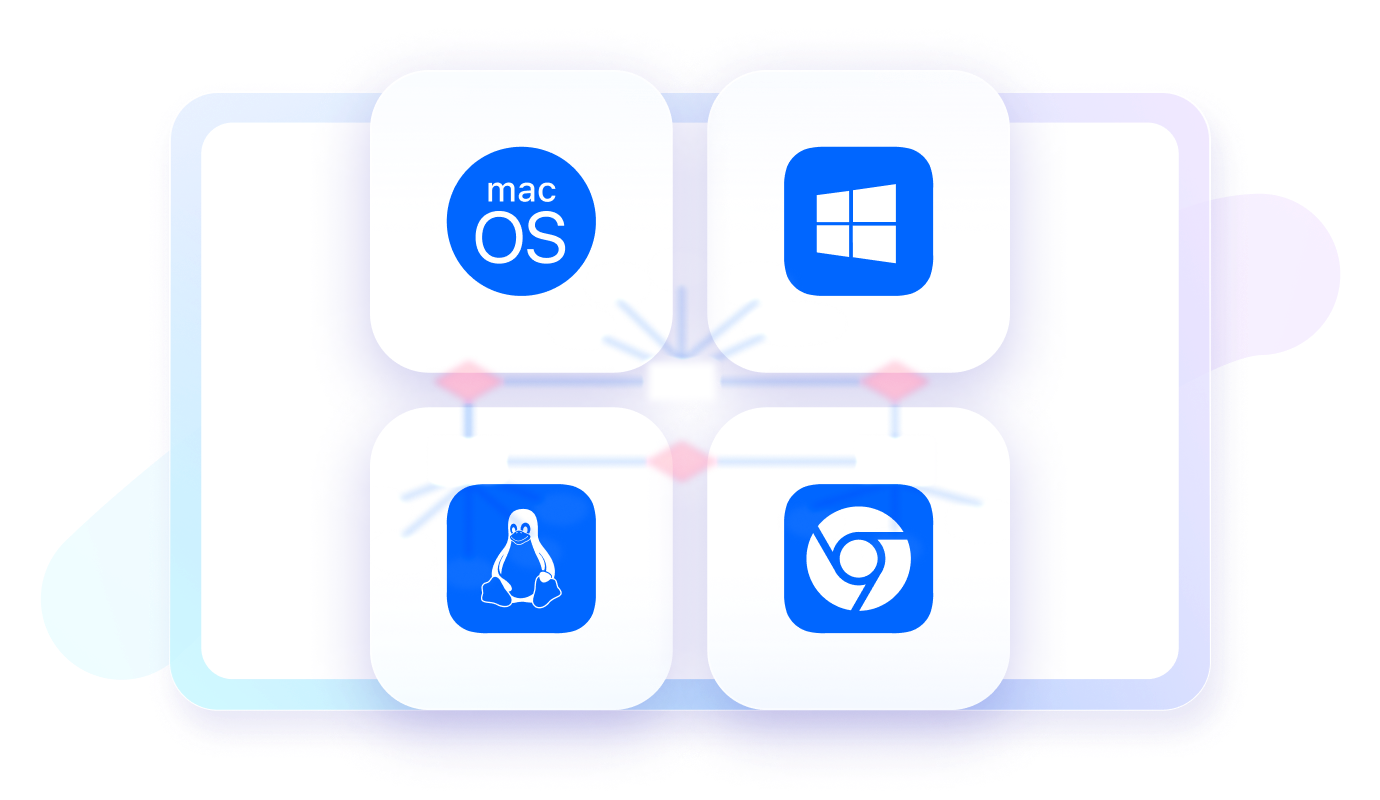
Access your diagrams on Windows, Mac OS, Linux, or even mobile devices. Edit your diagrams online whenever you have a connection to the Internet. Make changes, updates, or collaborate with team members regardless of your location.
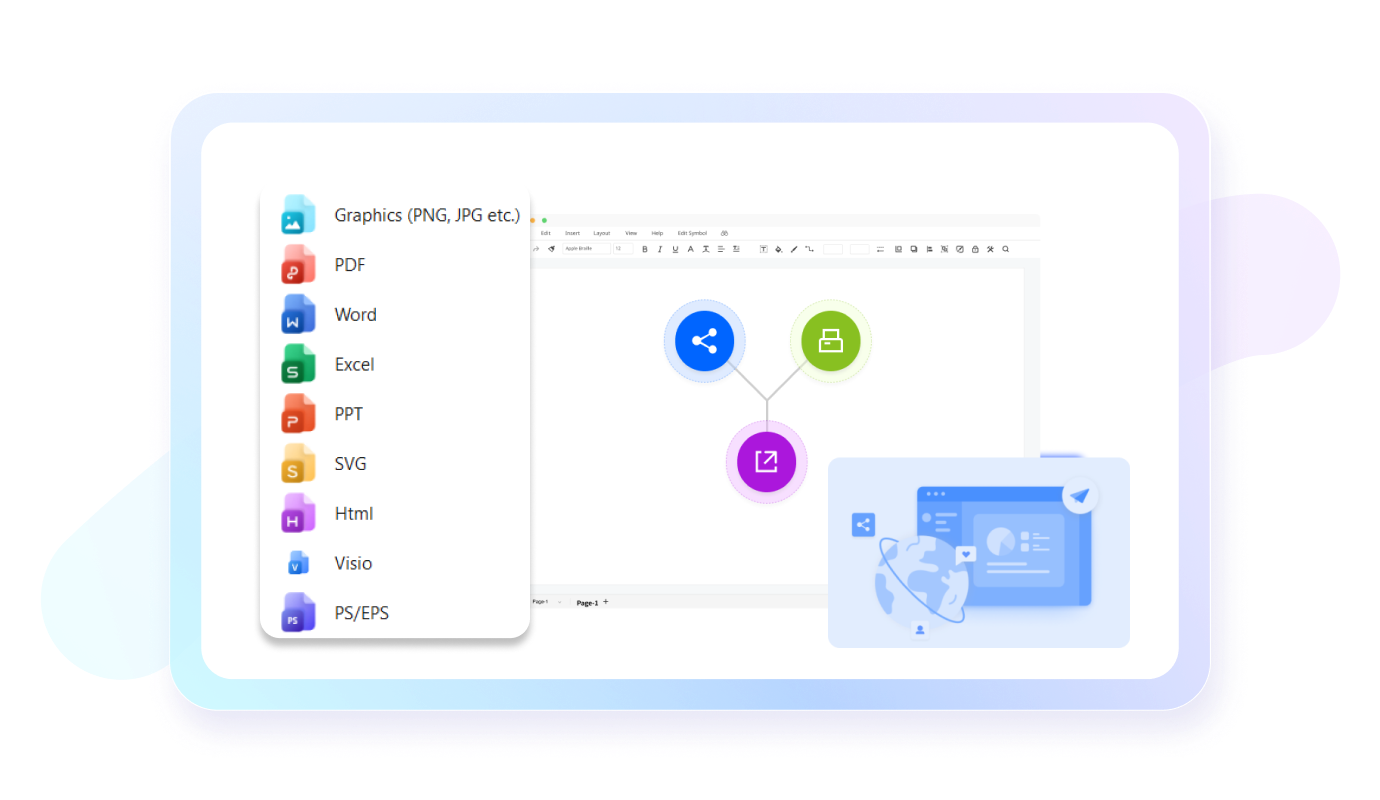
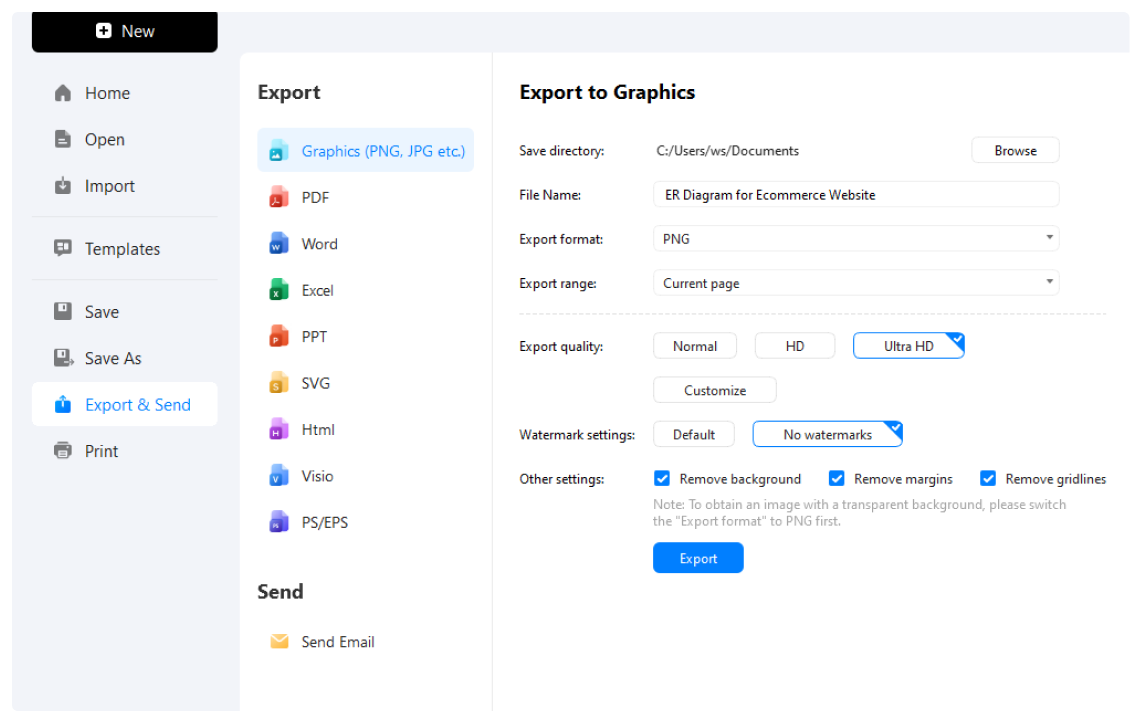
Easily share your diagrams with colleagues or stakeholders, regardless of their preferred file format, as EdrawMax offers a wide range of export options like PDF or PNG or even editable formats like Word, Excel, or PowerPoint.
How to make an ER diagram in 3 Simple Steps
What our users say
More ER diagram Tools
Discover more AI-powered diagram makers to boost your productivity.
FAQs About EdrawMax ER Diagram Tools
-
What is an Entity-Relationship (ER) diagram?An Entity-Relationship (ER) diagram is a visual tool used in database design to represent the logical structure of a system. It illustrates how different entities, such as people, objects, or concepts, relate to one another within a database. These diagrams help developers plan and communicate complex data requirements clearly.
-
What are the primary components of an ER diagram?The three fundamental components are entities, attributes, and relationships. Entities represent real-world objects or concepts, while attributes describe the specific properties of those entities. Relationships define how the entities interact with each other. Together, these elements provide a comprehensive blueprint for organizing data logically before implementing a physical database.
-
What exactly is an entity in the context of database modeling?In an ER diagram, an entity is a distinct object, person, or event that stores data. For example, in a school system, "Student," "Teacher," and "Course" are entities. They are typically represented by rectangles. Entities are the building blocks of the database, representing the core things being tracked.
-
What does cardinality represent in an ER model?Cardinality defines the numerical constraints of a relationship between entities, such as one-to-one, one-to-many, or many-to-many. It clarifies how many instances of one entity can be associated with instances of another. This is crucial for maintaining data integrity and understanding the specific business rules of the database system.
-
How does an ER diagram differ from a relational schema?An ER diagram is a high-level conceptual model focusing on business requirements and relationships. In contrast, a relational schema is a more technical representation that details the actual table structures, including data types and foreign keys. The ER diagram serves as the initial blueprint for the final relational schema.
Learn about ER diagram
Stop drawing. Start describing.
AI diagramming isn't just text-to-diagram.
AI now understands any input, fetches live data, adapts through dialogue, and works everywhere.
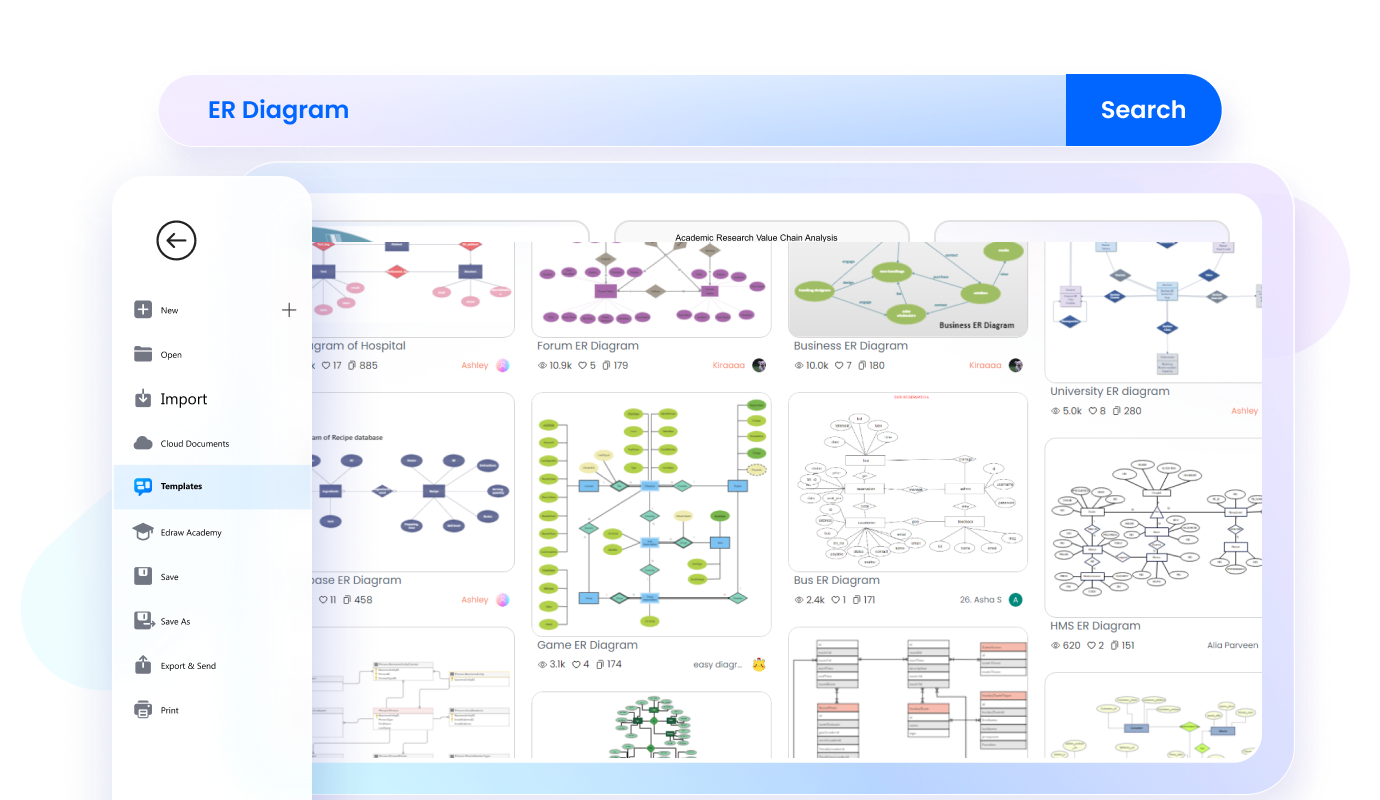
Free ER diagrams templates from EdrawMax