Simple pedigree Chart Maker
Create pedigree charts online with EdrawMax, an intuitive pedigree chart maker with a rich set of symbols and interactive graphic elements. Choose from a wide selection of pedigree templates and quickstart your journey of tracing genealogy.

Why Use EdrawMax Pedigree Chart Maker?
Get inspired by professionally crafted pedigree charts from the EdrawMax template community. It has over 26,000+ user-generated templates, including autosomal and X-linked pedigree charts. These templates are your visual guide to understand pedigree and restructure it.

EdrawMax features flexible style options, from vector symbols to design elements. Incorporate these interactive elements in your pedigree charts and import them into a personalized library for a simplified creation process. Make use of diagram themes and font details for visual appeal.

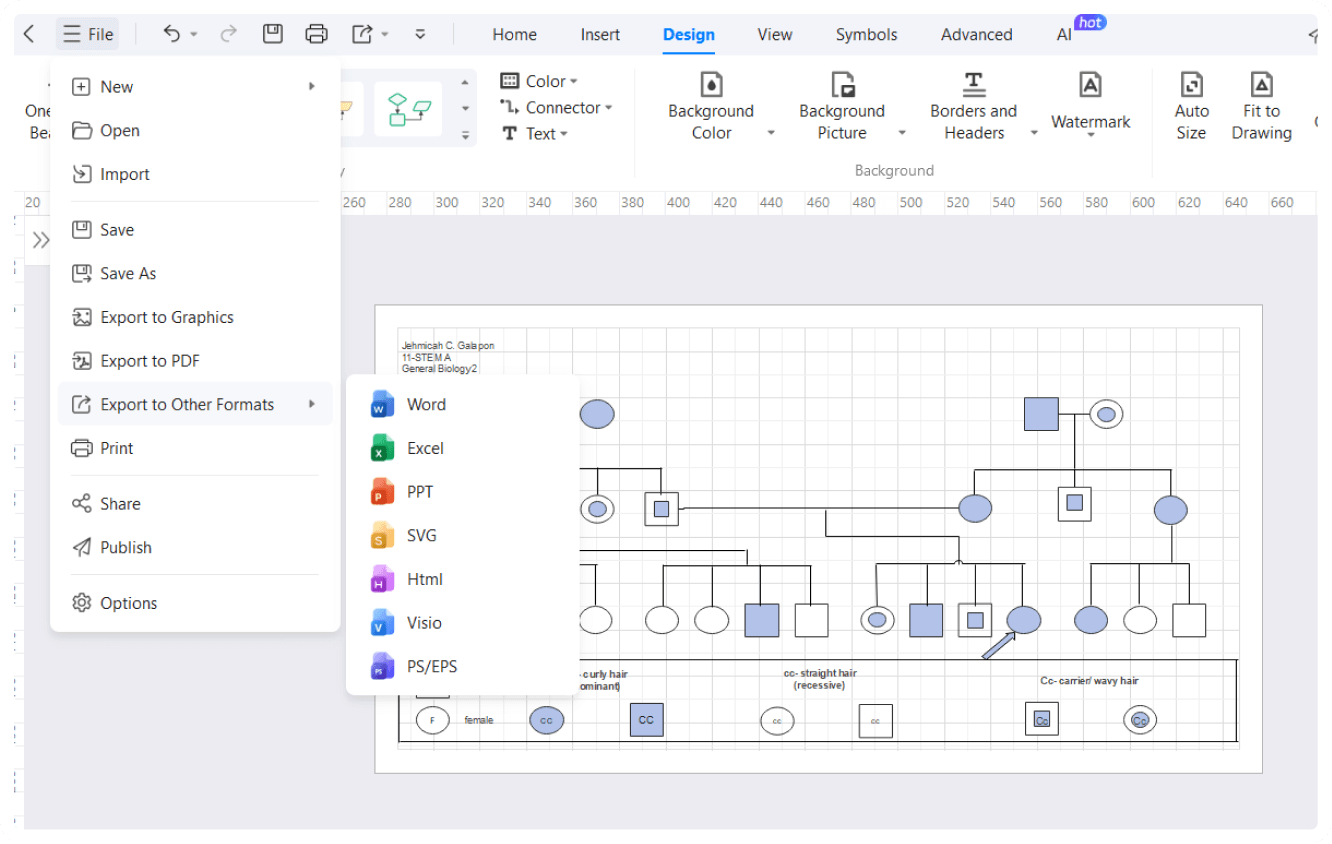
EdrawMax believes in making your work accessible. With EdrawMax, you can export the finished diagrams in multiple formats, including Visio, PNG, JPG, and MS Office. Wait! It even allows sharing your pedigree charts with non-EdrawMax users on social media.

Don’t switch platforms to present your pedigree research. EdrawMax has a Presentation Mode that generates a slideshow of diagrams. Enable it and press F5 to enter the full-screen preview. Alternatively, enter Focus Mode and enjoy editing plus presentation without distractions.

How to Make a Pedigree Chart in 3 Simple Steps


What our users say
More Pedigree Chart Tools
Discover more AI-powered diagram makers to boost your productivity.
FAQs About EdrawMax Pedigree Chart Tools
-
What is a pedigree chartA pedigree chart is a diagram that displays the occurrence and appearance of phenotypes of a particular gene or organism and its ancestors from one generation to the next. It functions like a family tree but focuses specifically on tracking genetic traits, diseases, or conditions across multiple generations of relatives.
-
What does it mean when a shape is shaded or filled in?Shading within a shape indicates that the individual expresses the specific trait being studied, such as a genetic disorder or a physical characteristic like blue eyes. An unshaded shape means the person does not show the trait. This visual distinction allows researchers to track how traits move through families.
-
How are generations and individuals numbered for identification?Generations are typically labeled with Roman numerals (I, II, III) on the left side of the chart, starting with the oldest. Within each generation, individuals are numbered from left to right using Arabic numerals (1, 2, 3). This system allows for precise identification of any specific family member.
-
What do the various lines connecting the shapes signify?Horizontal lines connecting a square and a circle represent a mating or marriage pair. Vertical lines extending downward from a mating line lead to their offspring. A horizontal line above a group of symbols, connected by vertical lines, indicates siblings, who are usually listed in their chronological birth order.
-
What is the difference between autosomal and sex-linked traits?Autosomal traits appear equally in both males and females because the genes are located on non-sex chromosomes. Sex-linked traits, however, are often found on the X chromosome and appear more frequently in one sex. For example, X-linked recessive disorders are significantly more common in males than they are in females.
-
How do pedigree charts differ from Punnett squares?While both tools study genetics, a Punnett square predicts the mathematical probability of genotypes for a single offspring from a specific cross. In contrast, a pedigree chart documents the actual observed phenotypes within an entire extended family over several generations, providing a historical record rather than just a theoretical prediction.
Stop drawing. Start describing.
AI diagramming isn't just text-to-diagram.
AI now understands any input, fetches live data, adapts through dialogue, and works everywhere.
Free Pedigree Chart templates from EdrawMax