ER diagrams are vital in making complex data structures easy to grasp. They are puzzle pieces that fit together neatly, making database design more efficient. Whether you're a budding developer or someone curious about databases, ER diagrams have something valuable to offer.
So in this article, we have selected 20 typical examples of ER diagrams for various purposes to help you understand them. Now without further ado, let's get started.
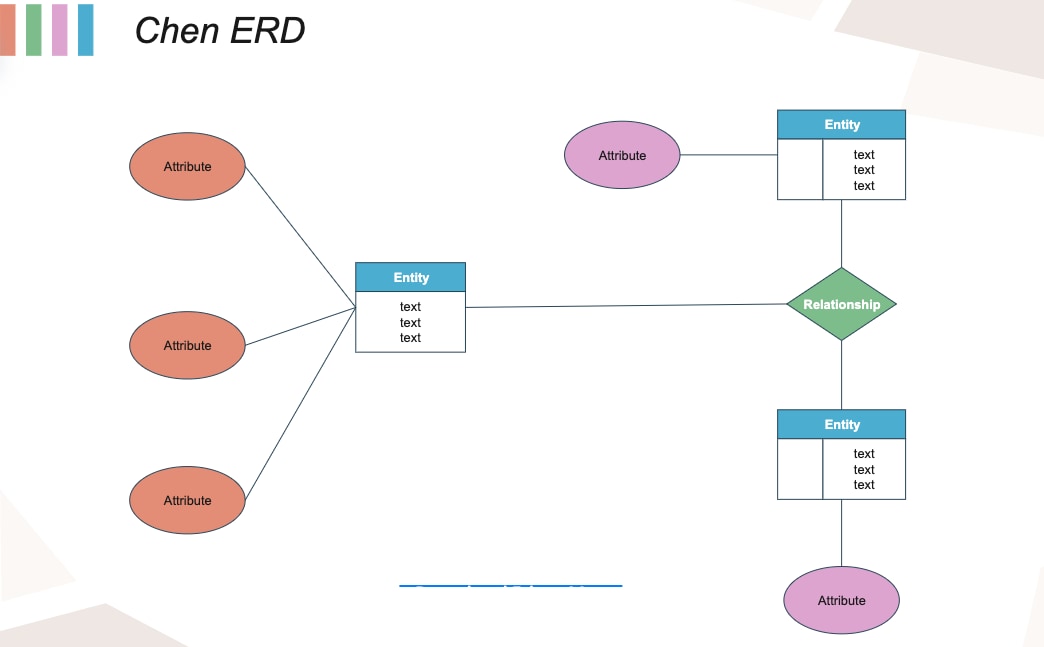
These ER diagram examples are like building blocks, helping you understand how different pieces of data fit together in various scenarios. Whether new to them or looking to expand your knowledge, these straightforward examples will serve as your guiding light.
These diagrams are sourced from the Templates Community of Wondershare EdrawMax, a free online ER diagram maker. As a dedicated diagram maker, EdrawMax supports 210+ types of diagrams and offers 15,000+ ready-made templates. Download it and visit the templates community to find the one most suitable for you.
In this article
- Faculty Information ER Diagram
- Hospital ER Diagram
- Game ER Diagram
- University ER Diagram
- College ER Diagram
- Recipe Database ER Diagram
- Project ER Diagram
- Hospital System ER Diagram
- ER Diagram for Movies
- Amazon ER Diagram
- Database ER Diagram
- Library ER Diagram
- SQL ER Diagram
- Online Shopping ER Diagram
- Restaurant Management ER Diagram
- Dental Clinic ER Diagram
- Charity Donation ER Diagram
- Product Management ER Diagram
- Supply Chain ER Diagram
- Ecommerce Website ER Diagram
- How To Create an ER Diagram
Faculty Information ER Diagram
A faculty information ER diagram visually represents how data related to faculty members in an educational institution is structured and interconnected. This diagram simplifies the complex relationships within a faculty database, making it easy to understand. It's an essential tool for efficient management and decision-making in academic settings.
Hospital ER Diagram
The hospital's database and its associated fields are depicted in this ER diagram. The nature, relationships, and qualities of various entities are discussed here. Patients, Doctors, and Tests are the three major entities present in this diagram. This diagram is beneficial to the clinic's productivity and patient retention rates.
Game ER Diagram
EdrawMax provides all the icons and layouts you need to create this Game ER diagram. Characters are just one example of an entity in a game's ER diagram. They might have a variety of properties depending on the game they're in, such as Type, Curr_Mana, Curr_Hit_Points, Max_Mana, Max_Hit_Points, Char_Name, Level, Exp_Points, and so on.
University ER Diagram
This university ER diagram includes faculty, sessions, guardians, departments, users, centers, guardians, and students, among other things. This University ER diagram initially reads like a flowchart, but this model is unique since it features numerous specific symbols and their interpretations.
College ER Diagram
This college ER diagram is useful for conveying the institutional logic underlying a university's faculty, students, and classrooms. Below is a diagram drawn in EdrawMax, which uses various symbols to represent symbols, like rectangles for entities, ovals for characteristics, and diamonds for connections.
Recipe Database ER Diagram
This example provides a straightforward ER diagram of a recipe database. The database includes ingredients, recipes, and other entities such as quantity available, unit, directions, skill level, and preparation time, among others.
Project ER Diagram
The process of modeling application databases with commercial DBMS led to the development this entity-relationship data model. The Project ER diagram below depicts the entities and their connections to one another. This diagram uses ER symbols to represent various entities, attributes, identifiers, and relationships.
Hospital System ER Diagram
This hospital system ER diagram illustrates the concept of a hospital system entity. This ER Diagram displays all of the visual instruments of the database tables and the relations between Patients, Nurses, Hospitals, Medicines, the Admin Department, the Account Department, and many other entities.
ER Diagram for Movies
Several movie production entities are shown in this ER diagram. These movie production entities include the movie's ID, year, language, country, running time, user ID, gender, occupation, etc. A diamond is used to depict the sort of relationship, while lines are used to illustrate the connections between the entities.
Amazon ER Diagram
Using this Amazon ER diagram, you may graphically illustrate an information system and display the interconnections among its constituent parts (such as people, things, ideas, and locations). A model of a business database's structure can be drawn using this Amazon ER diagram.
Database ER Diagram
Relational database design makes use of ER diagrams. The data pieces and relationships in a system can be spelled out with the help of this model. It's what makes up the blueprint for the database system. It also makes for an uncomplicated and straightforward data visualization.
Library ER Diagram
The number of entities inspired this Library ER diagram. These connections are necessary for deciding where items should be stored in a library management system's database. The database may be more easily analyzed with the help of this ER diagram. With this feature, users can tweak, update, and reevaluate their databases as needed.
SQL ER Diagram
This SQL ER Diagram serves as a Visual Paradigm for a database's logic and the interplay of its various parts. This ER diagram presents the skeleton of internal database structures to better comprehend, optimize, and diagnose logical problems. Property, Tenant, and Move-in Fees are the three primary actors in this visual.
Online Shopping ER Diagram
An Online Shopping ER Diagram visually represents how data is structured in an online shopping system. It simplifies the complex relationships between various entities in the world of e-commerce, making it easy to understand. It helps online retailers streamline operations by efficiently managing customer orders, products, payments, and more.
Restaurant Management ER Diagram
The ER diagram below illustrates the interconnections between the seven positions in a restaurant's management team. The interconnection of multiple entities is seen in this ER diagram. This may refer to real-world or database entity collections. This approach is useful for establishing the general architecture of a database or program.
Dental Clinic ER Diagram
In this ER diagram, each field in the dental practice database is represented by a circle. This dental clinic ER diagram has been incorporated into dental office management software to streamline and expedite dental charting, appointment scheduling, patient administration, insurance, orthodontics, invoicing, etc. It's beneficial for patient retention, service, and revenue growth.
Charity Donation ER Diagram
An ER diagram depicting a Charity_Employee with attributes like Employee_ID, E_Name, E_Password, Status, E_Task, E_Phone, and others is shown in the diagram below. Data designers extensively use the ER diagram model of charitable donations to convey their concepts.
Product Management ER Diagram
The ER diagram for product management consists of three parts: entities, attributes, and relationships. It's important to realize that the entity-relationship model is a visual database creation method. It's a data model that describes the structure of a program's data at a high level.
Supply Chain ER Diagram
The below ER diagram depicts a graphical representation of a supply chain database. According to this ER diagram, a supply chain is the full procedure for producing and distributing a product for commercial purposes, from sourcing raw materials to final sales.
Ecommerce Website ER Diagram
This ER diagram shows how a database design (ERD) supports the data needs of e-commerce administration tasks. It presents the interconnections in an e-commerce website's database. Defining entities, their attributes, and their relationships exemplifies the database's rational design.
How To Create an ER Diagram
Now that you're familiar with several ER diagram examples, let's get to the good part – customization. Think of the possibilities if you could make ER diagrams that meet your requirements. You can do that and more with EdrawMax. With its help, creating professional-looking ER diagrams is a breeze. EdrawMax makes creating ER diagrams simple for everyone, whether students, professionals, or just curious onlookers.
Step to make an ER diagram
Creating an ER diagram is easy with the help of EdrawMax Online. You can perform many things with the free ER diagram maker, such as importing data from a .csv file or customizing a template from EdrawMax. This how you can use this tool to customize your ER diagrams:
Step1
Step 1: Download, install, launch EdrawMax or try it online. Log in with a Wondershare ID or an account of Google, Facebook, or Twitter.
Step2
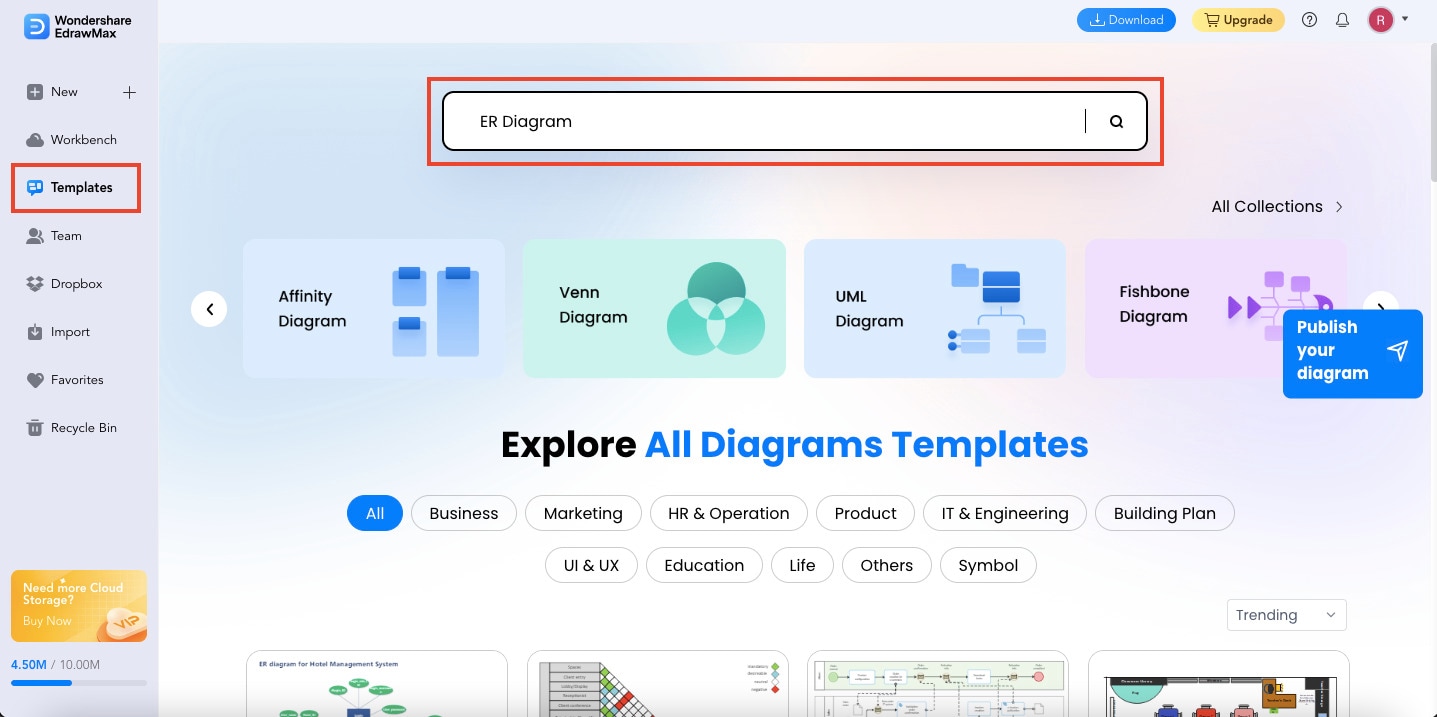
You can find helpful examples and layouts in EdrawMax. Navigate to the left side of your screen and click Templates. In the "search bar," type in the kind of template you're looking for, and hit "Enter" on the keyboard. Find an ER diagram that fits your requirements.
Step3
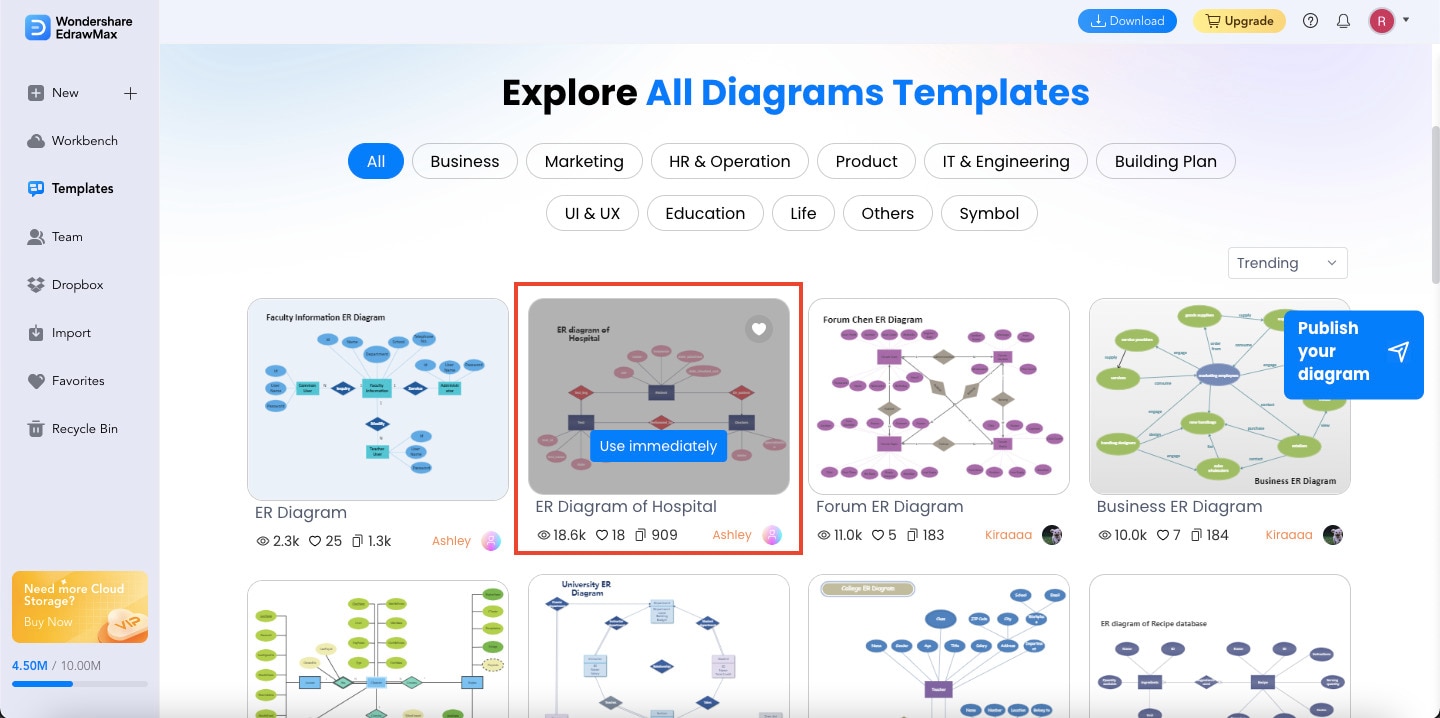
Click Use immediately after deciding on a certain template. Then, a notification window will pop up. Click the Create button to edit the template you've chosen.
Step4
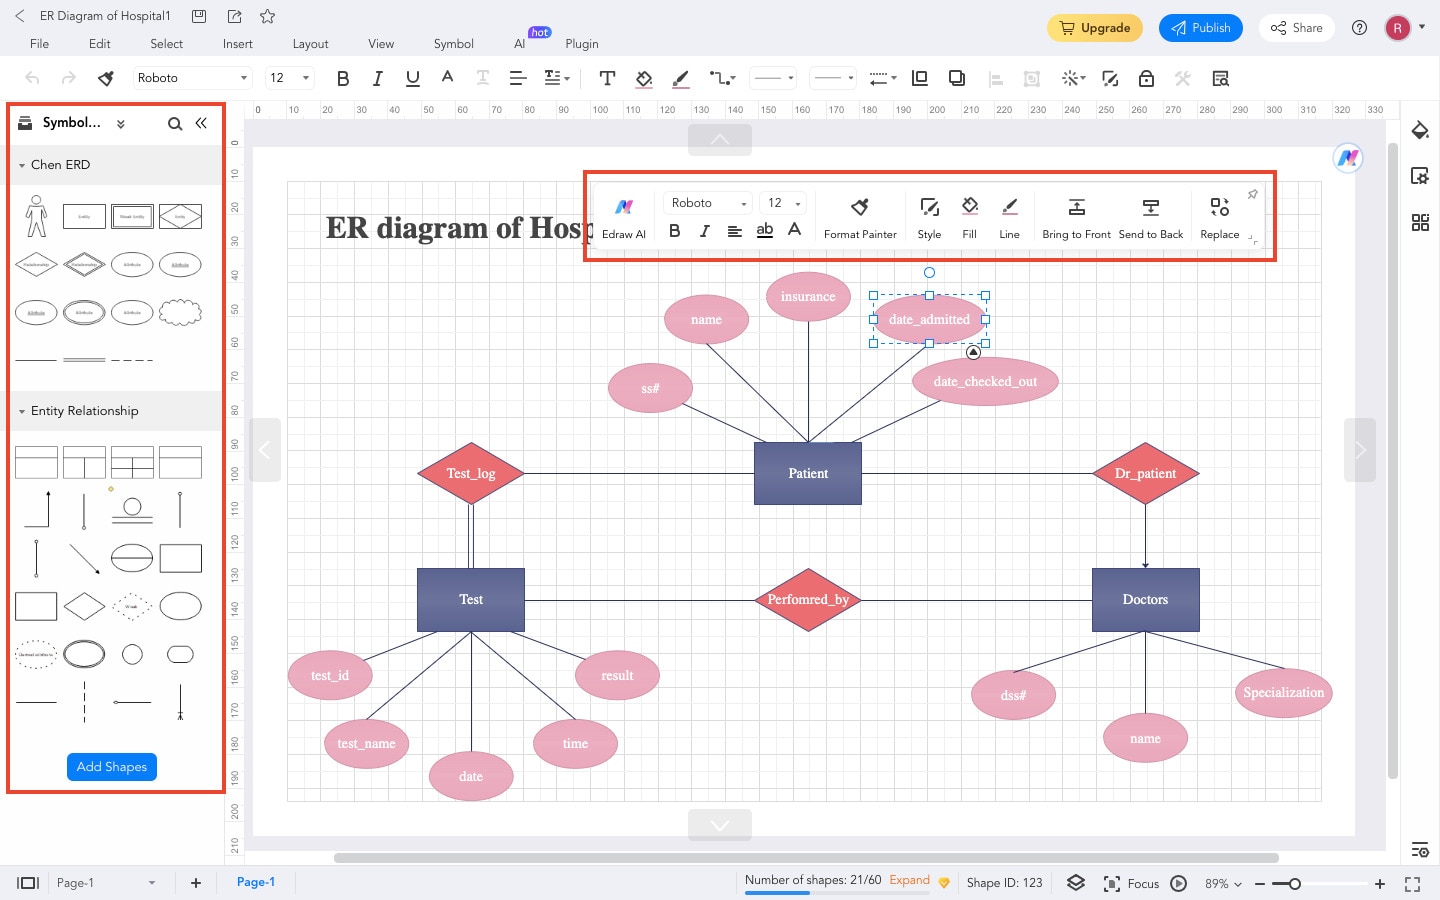
The time has come to change the selected template. When using EdrawMax, you may drag and drop symbols from the Symbols library into the drawing area. There's certainly no need to be a technological wizard to do it. To change the sample text in the template, click the topic you want to edit.
Step5
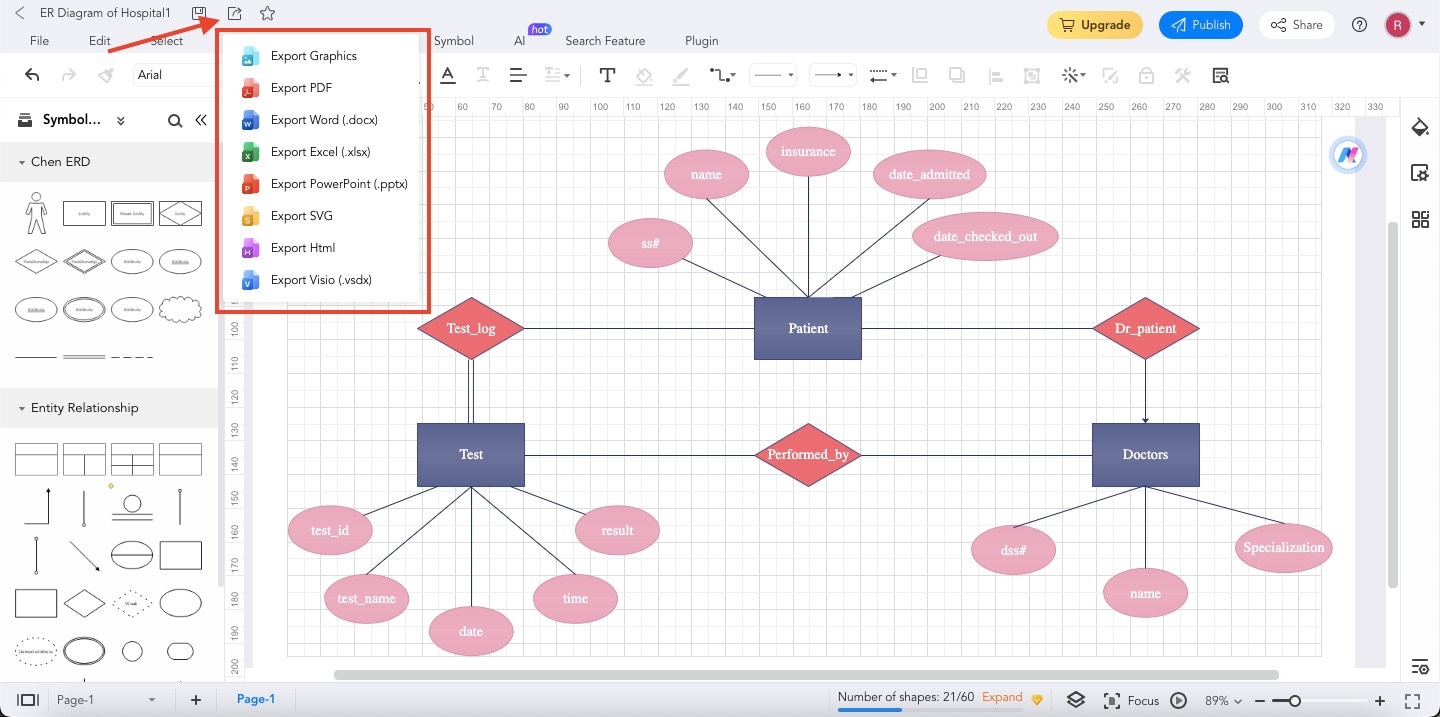
After you have completed your ER diagram, it's time to Export it and share it with others. You can save it in several formats, including Graphics (JPEG and PNG), PDF, Word, Excel, PowerPoint, SVG, HTML, and Visio.
Conclusion
ER diagrams are not as tricky as they might seem at first. These visual tools help you understand how things are connected in databases, and with the right approach, anyone can grasp their concepts.
From exploring 20 easy ER diagram examples to customizing your diagrams with EdrawMax, you've taken on a journey to simplify this essential aspect of database design. So, don't be intimidated the next time you encounter a database puzzle. With EdrawMax, you can become a master of database visualization. EdrawMax is your key to unlocking the world of data organization!


