Free network diagram maker
Design a network diagram with EdrawMax. Whether it's an IT infrastructure, telecommunications network, or complex project workflows, EdrawMax provides high-quality free templates. Visualize your network structure clearly and accurately with less efforts.
Why Use EdrawMax Network Diagram Maker?
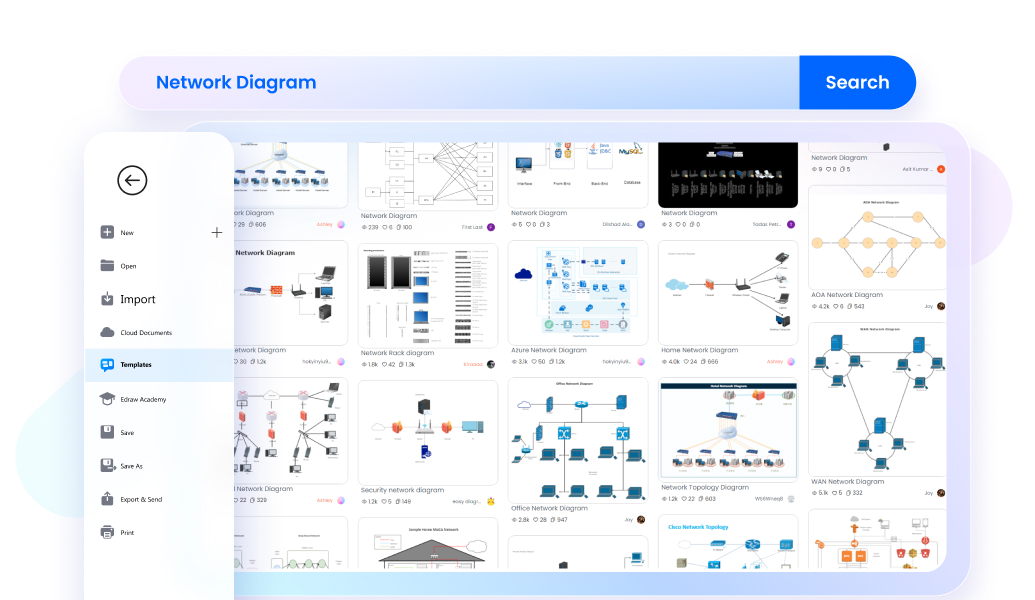
Discover a rich library of network diagram templates in EdrawMax, tailored for various needs. From Cisco to logical network diagrams, WAN to firewall network diagrams, AWS to Azure network diagrams, you can find any type of network diagram templates you’d need.
Explore a robust Visio alternative and enjoy more user-friendly experience at a fraction of Visio’s cost. Perfect for professionals seeking quality without the hefty price tag, EdrawMax also supports import and export of Visio files, ensuring seamless transition.

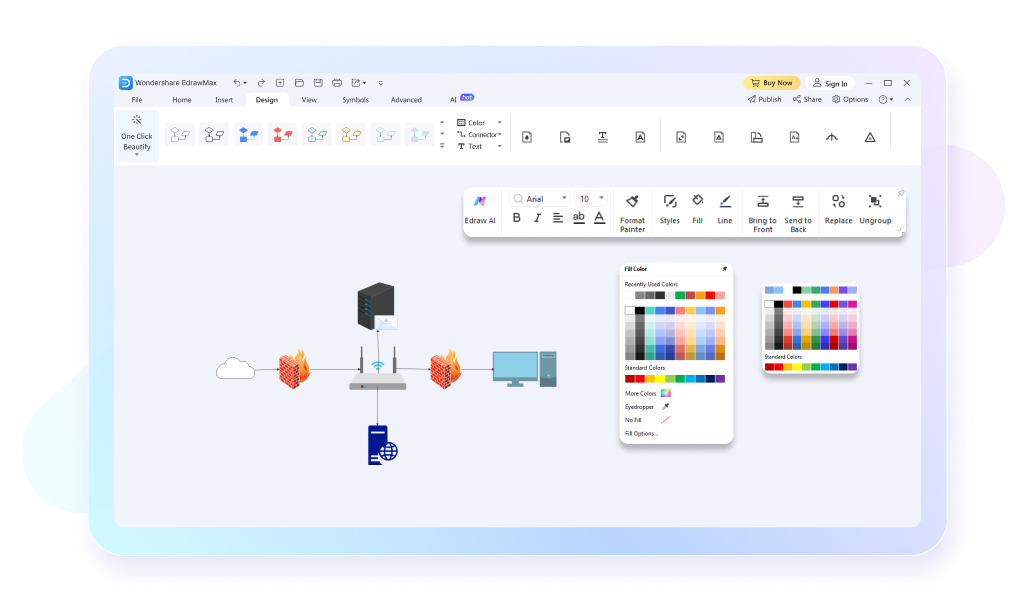
Navigate with ease through an interface mirroring Microsoft Office’s simplicity, where familiarity breeds creativity. Effortlessly create, edit, and refine intricate network diagrams, using a user-friendly platform that blends simplicity with advanced diagramming capabilities.
Craft your network diagrams on a desktop at work, refine them on a laptop at a cafe, share updates through from a mobile device, or ask your team to access it online without downloading EdrawMax. Innovate, collaborate, and execute your network vision from anywhere.

share your network diagrams across a spectrum of formats. Seamlessly export to PDF for professional reports, SVG for scalable graphics, or common image formats for easy integration into presentations and documentation, enhancing collaboration and comprehension.

How to make a network diagram with EdrawMax?


What our users say
More Network Diagram Tools
Discover more AI-powered diagram makers to boost your productivity.
FAQs about network diagram makers
-
What is a network diagram?A network diagram is a visual representation of a computer or telecommunications network. It illustrates how various components, such as routers, switches, servers, and hubs, interact within a system. These diagrams help IT professionals understand the structure, layout, and data flow, making it easier to manage and troubleshoot complex infrastructures.
-
What are the main types of network diagrams?The two primary types are physical and logical network diagrams. Physical diagrams show the actual hardware and cabling, including the layout of wires and physical devices. Logical diagrams focus on how data flows through the network, illustrating subnets, IP addresses, and routing protocols, regardless of the physical hardware's location.
-
What common symbols are used in network diagrams?Network diagrams use standardized icons to represent specific devices. Common symbols include rectangles for servers, circles for routers, and small boxes for switches. Lines represent connections, while icons like lightning bolts may indicate wireless links. Using these standard symbols ensures that the diagram is easily understood by IT professionals worldwide.
-
What is the difference between physical and logical network diagrams?A physical network diagram maps out the tangible components, such as cables, ports, and hardware placement within a building. In contrast, a logical diagram details the path data takes, highlighting IP addressing, firewalls, and virtual local area networks (VLANs). Both are essential for a complete understanding of the infrastructure.
-
How do I start creating a network diagram?Begin by identifying all hardware components and their specific functions. Start with a high-level overview, then drill down into specific subnets or departments. Use automated discovery tools to map out connections if the network is complex. Finally, choose a standardized set of symbols to ensure the diagram remains clear.
Learn about Network Diagram
Stop drawing. Start describing.
AI diagramming isn't just text-to-diagram.
AI now understands any input, fetches live data, adapts through dialogue, and works everywhere.
Free network diagram templates from EdrawMax