Visual representations are often more effective and accessible than plain text, as graphics can make information clear and creative. Network diagrams utilize network symbols to showcase different network components, making the diagram interactive and easy to understand for the reader. In this article, readers can learn more about network diagrams and how they aid in project management.
1. What is The Network Diagram
A network diagram refers to the visual representation of the connection between different parts of a system or information flow. It shows the connection established between devices, routers, PCs, VLAN IDs, and other components, either in a logical or physical representation. A logical network diagram is used to express connections between different devices, routers, and other components, while a physical network diagram deals with the physical representation of the connection.
Designers use various symbols to represent connections and systems in a network diagram. Network diagrams are popular because they enable designers to visualize and analyze networks and document and troubleshoot connections. While network diagrams may seem complex at first, learning more about them and reviewing network diagram examples can help in understanding them better.
2. Basic Network Diagram Symbols
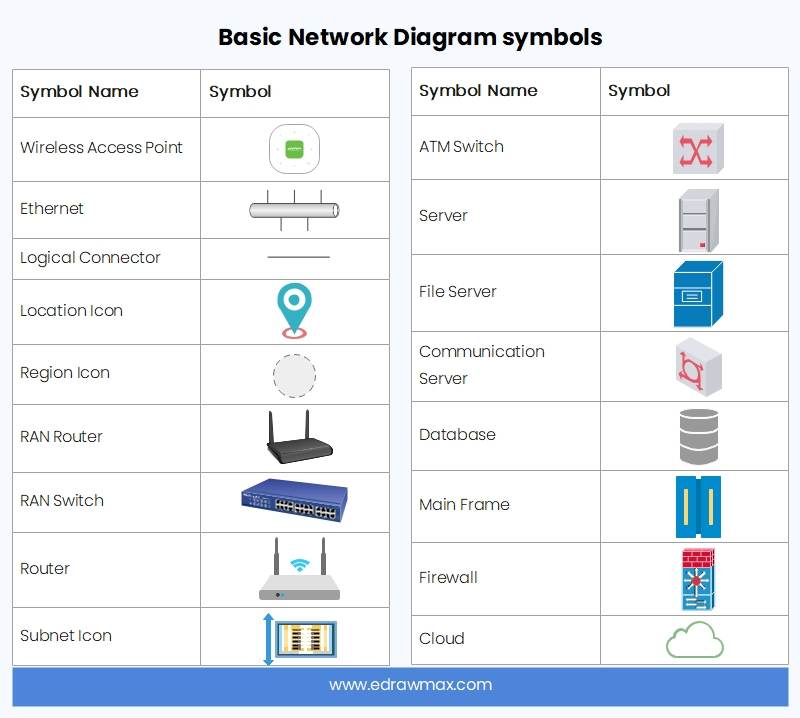
In a network diagram, different symbols are used to represent various components of the network. Some examples of these symbols are:
Wireless access symbol: This is represented by a box with an antenna, and it shows the connection of a wireless network to a cabled network.
Ethernet: The Ethernet symbol consists of three boxes linked to a single line, representing an Ethernet connection between devices based on IEEE 802 standards.
Logical Connectors: This is used to depict logical relationships between devices in a network.
Location Icon: This functions as a pointer to locate a geographical location in the network.
Region Icon: This points to a specific geographical region for the network diagram.
RAN Router: The radio area network (RAN) router icon depicts a device used as a RAN router which contains three parts: RRU, BBU, and an antenna.
RAN Switch: This represents the RAN switch devices in the network diagram.
Router: A router icon represents a router in a network, used as a switching device to route network and data to a specific address.
Subnet icon: This portrays a subnetwork of a specific IP.
ATM Switch: The asynchronous transfer mode (ATM) switch represents the network communication in which data is turned and shared in small fixed-sized packets in specific time frames.
Server: This icon represents the server that shares resources to other devices and servers in a network.
File Server: This icon depicts the computer that shares files to connected devices with LAN networking.
Communication Server: This icon represents a system platform that runs communication applications in the network.
Database: A database icon represents the shared storage between all devices in a network connection.
Mainframe: This icon depicts a high-performance computer or a mainframe device used to perform a function that requires better security, availability, and higher processing speed.
Firewall: This represents the network system used to monitor incoming and outgoing traffic.
Cloud: The cloud represents the dividing point between the network source and the responsibilities of the user.
3. Connectors and Devices Symbols
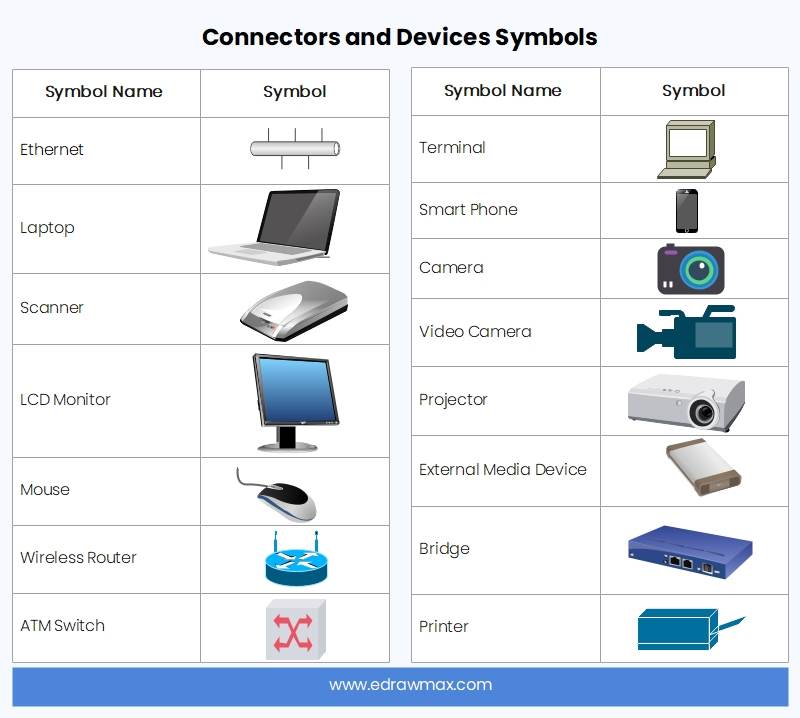
Connectors play a crucial role in indicating the path of data flow in a network diagram. Different devices in a network communicate using various device symbols and connectors that are specific to the type of data and device being used. Using device symbols makes it easier to portray connections in a network diagram.
Devices symbols can range from mobile phones to laptops and can represent the medium of connection in a network diagram. There are various device symbols available in EdrawMax Online's network diagram library. Here are some commonly used device symbols for a network diagram.
4. LDAP Symbols
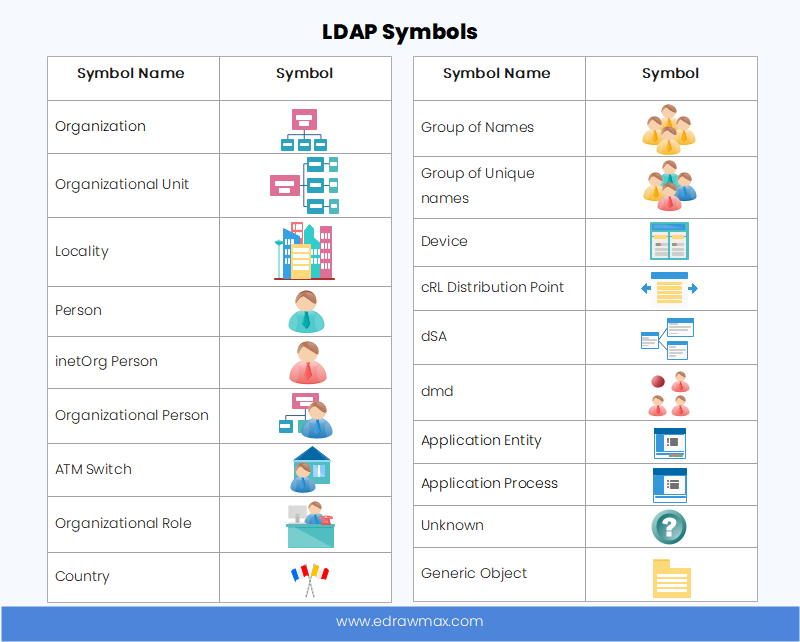
LDAP, or Lightweight Directory Access Protocol, is an internet protocol used to authenticate services and create an open platform for communication and information sharing from servers. EdrawMax offers an LDAP design tool that allows users to create visual representations of networks for maintaining a network plan.
Some symbols commonly used in LDAP design include:
Organization: This represents a social unit of people working towards the same goal, with internal structures where members follow management activities.
Locality: This depicts the dynamic range for connected devices, where devices in close vicinity can communicate with each other in a network.
Person: This represents a legal or biological entity in LDAP.
Group of Names: This represents dynamic or static groups in LDAP.
DSA: This represents the portion of the directory service that users can access.
DMD: This represents the domain that manages the directory data and communications.
5. Database Symbols
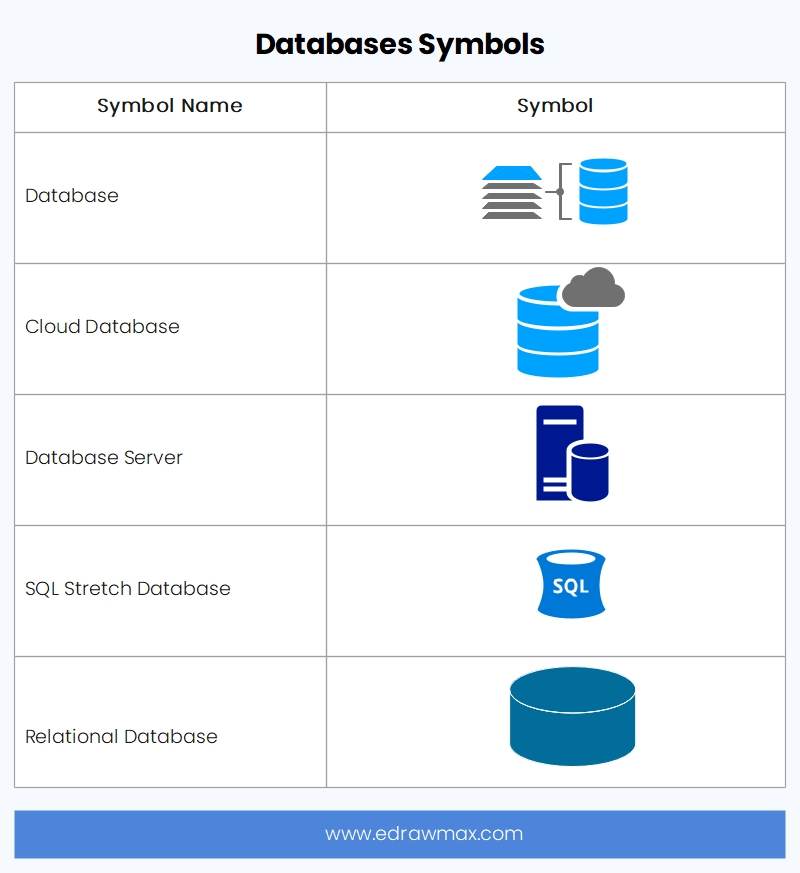
A database is a structured collection of data stored electronically and organized as part of an extensive collection. In EdrawMax, you can represent databases using various shapes. There are multiple types of database shapes that can be used depending on the type of data being described. Additionally, you can choose shapes based on other attributes, such as external data.
In a network diagram, there are various shapes used to represent different types of databases. These include:
Database: This represents a structured collection of data that is easy to access and modify.
Cloud Database: This shape depicts data that can only be accessed through a cloud platform.
Database Server: This represents a server that runs database applications and shares its services with other devices.
SQL Stretch Database: This represents a database that can store data from a local SQL database to the Azure SQL database.
Relational Database: This shape represents a database that only allows related data points to access and modify data.
6. Event Status Symbols
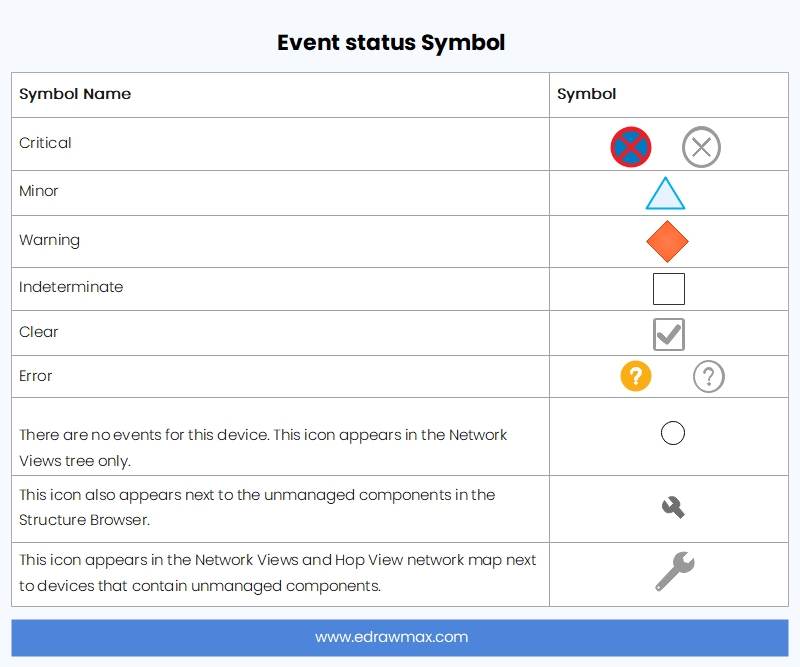
The event status symbol is used to represent status information about events in the network through the event viewer. It helps locate any issues that may occur during an event and provides status reports while managing devices connected to the web. In a network diagram, specific colors and shapes can be used to represent the event status. The severity of issues picked up by the event viewer depends on the color of the icon that appears.
In the event viewer, there are various icons with specific colors and shapes used to represent status information about events in the network. These include:
Red Icon: This is one of the default icons in the event viewer and represents critical issues in the network diagram.
Orange Icon: This icon represents major issues that require immediate attention.
Yellow Icon: This icon represents minor issues in the network.
Blue Icon: This icon notifies about issues that are easy to handle.
Purple Icon: This icon represents issues that may arise during the event.
Green Icon: This icon indicates that the event is clear and everything is working perfectly.
Status Icon: This icon, also known as the replacement character, represents no status retrieval from the event.
Event Icon: This icon, depicted as a circle bullet, indicates that no events are currently occurring.
Unmanaged Components: This icon points out devices with uncontrolled components.
Unmanaged Devices: This icon points out uncontrolled devices in the network.
7. Expert Tips for Using Network Diagram Symbols
To create a comprehensive and precise network diagram, it is crucial to use different symbols and icons for various network data types, devices, and components. Reusing the same symbol for different elements can lead to confusion and inaccuracies.
EdrawMax Online offers a wide range of symbols and shapes that can not be found elsewhere, making EdrawMax Online an excellent resource for creating detailed and accurate network diagrams quickly and efficiently.
7.1 Use a Professional Network Diagram Maker
Try to use a professional network diagram maker like EdrawMax Online. All you have to do is go to EdrawMax > Symbol Library> Network and Computer. There you will find various symbols and icons for networking.
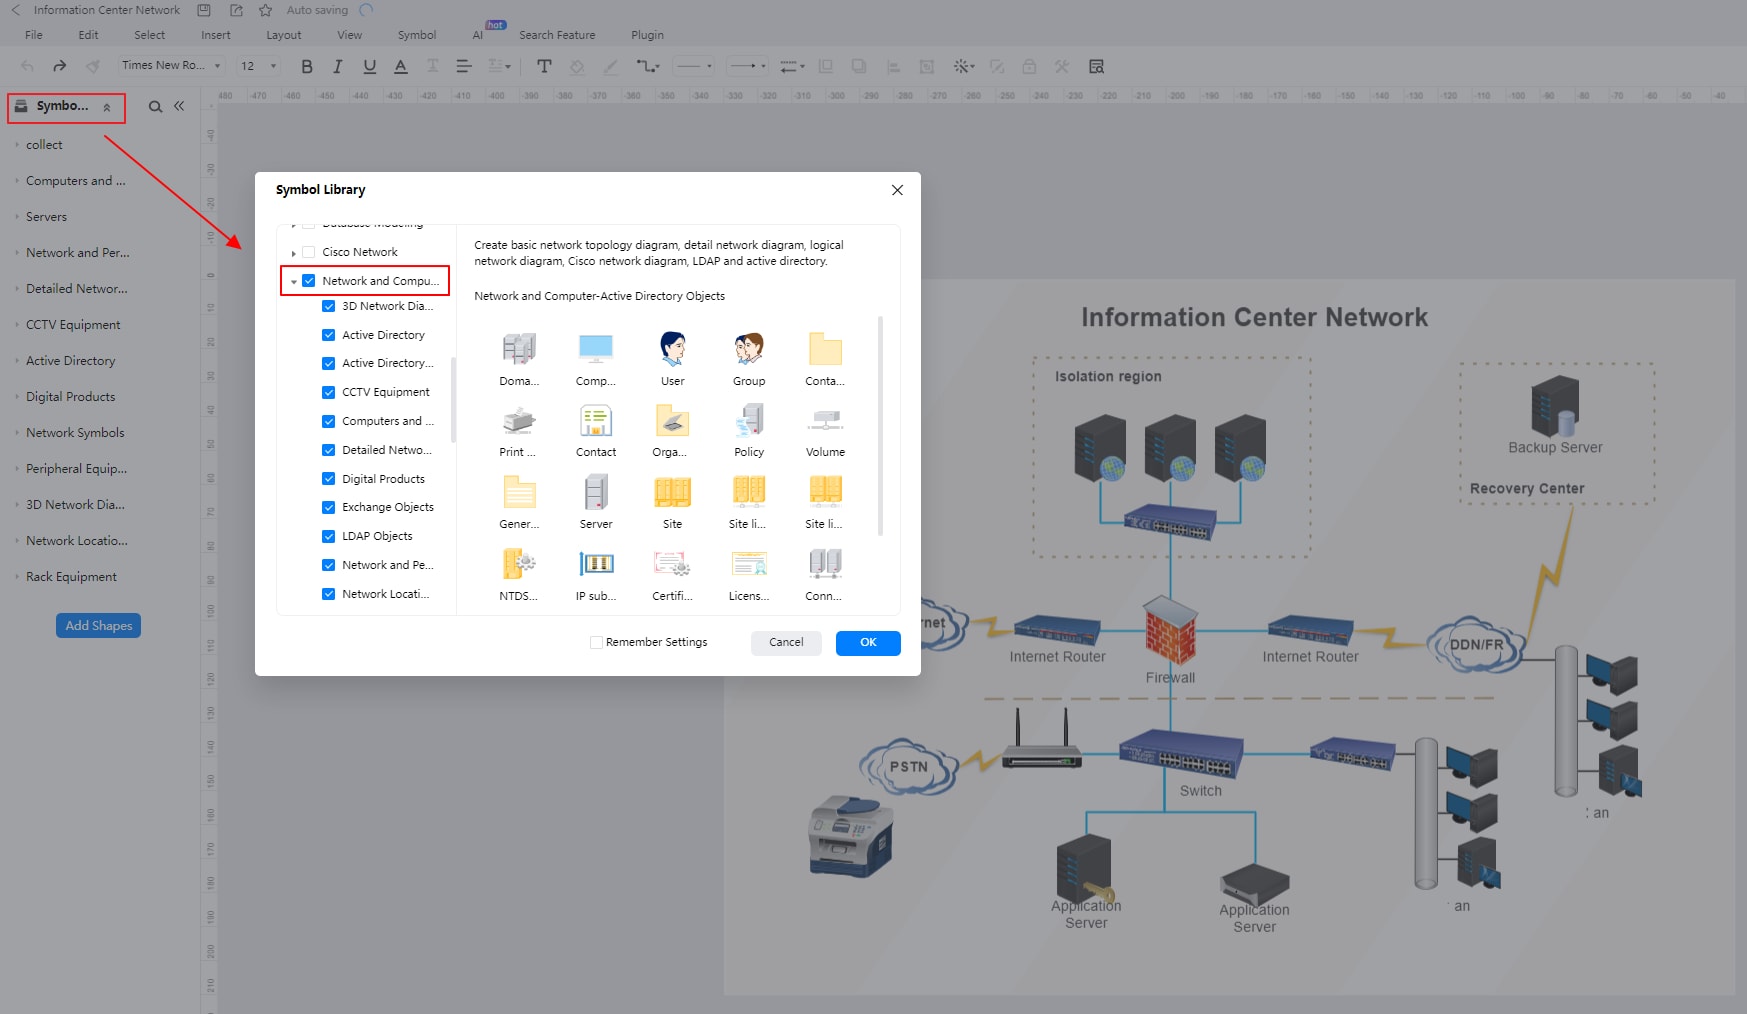
If you cannot find a symbol that you need in EdrawMax, there are two options available. You can either import the symbol from the web or create the symbol yourself.
To create a symbol, there is a video available that provides step-by-step instructions. If the video is not playing, it can be found on YouTube.
8. Conclusion
In conclusion, using suitable symbols, shapes, and structures can greatly enhance the efficiency and clarity of a network diagram. It is important to avoid reusing symbols for different components to avoid confusion.
EdrawMax Online is an excellent tool for creating network diagrams, as it offers a comprehensive library of symbols and shapes specifically designed for this purpose. Additionally, it provides numerous features like exporting in multiple formats, importing symbols and libraries, and team management and collaboration. It is available for free online and in desktop versions, making it a versatile and valuable resource for anyone looking to create professional-quality network diagrams.


 below.