Free phylogenetic tree creator
Unveil evolutionary history using our free, powerful phylogenetic tree maker.

Why Use EdrawMax Phylogenetic Tree Maker?
Create your phylogenetic tree diagrams effortlessly. Adjust layouts, labels, and styles for personalized research representation. Use EdrawMax’s free symbols, icons, cliparts and various other elements for seamless evolutionary connections.
EdrawMax offers numerous phylogenetic tree templates and 16,000+ all kinds of templates, which could also be helpful. With these elaborately made templates, you can effortlessly get started.

Store phylogenic trees on cloud and grant access to specific team members, allowing them to view and provide feedback on your work.

How to Make a Phylogenetic Tree in 4 Simple Steps


What our users say
More Phylogenetic Tree Tools
Discover more AI-powered diagram makers to boost your productivity.
FAQs About EdrawMax Phylogenetic Tree Tools
-
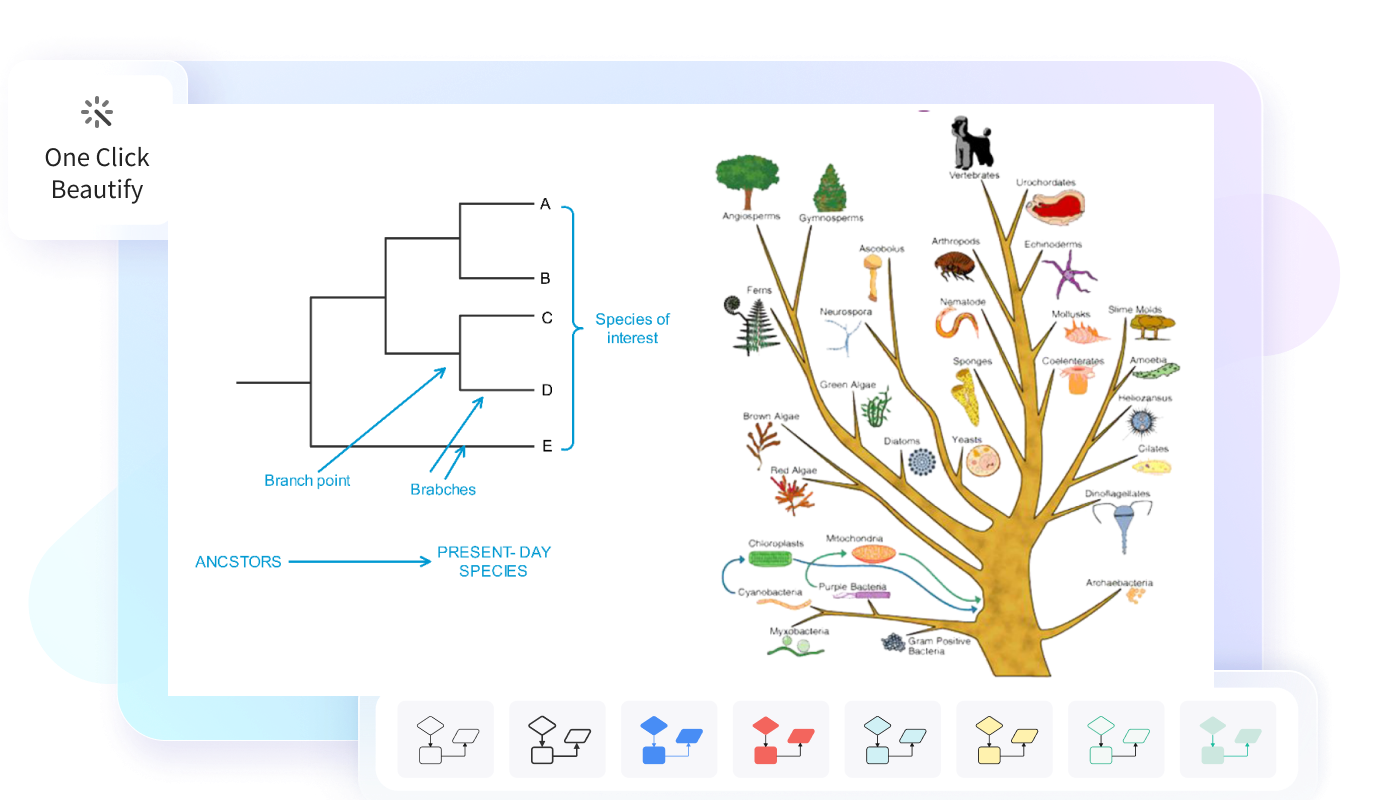
What exactly is a phylogenetic tree?A phylogenetic tree is a visual diagram that represents the evolutionary relationships among various biological species or entities. It acts like a family tree, showing how different organisms evolved from common ancestors. By analyzing branches and nodes, scientists can map out the shared history and lineage of life on Earth.
-
How to read a phylogenetic tree correctly?To read a tree, start from the root, which represents the oldest common ancestor. As you move toward the tips, each branching point, or node, signifies a divergence into new lineages. The proximity of the tips indicates how closely related species are based on their most recent common ancestor.
-
What is a clade in a phylogenetic tree?A clade is a grouping that includes a single common ancestor and all of its lineal descendants. In a phylogenetic tree, you can identify a clade by "cutting" a single branch; everything that falls off that branch belongs to the same clade, representing a distinct monophyletic evolutionary group.
-
What does the root of a phylogenetic tree represent?The root represents the most recent common ancestor shared by all the organisms depicted in the tree. It provides a sense of directionality, showing the flow of time from the past at the base to the present at the tips, establishing a foundational point for the entire evolutionary history.
-
What do the nodes on a phylogenetic tree signify?Nodes are the points where branches split, representing a speciation event where a single ancestral lineage divided into two or more distinct descendant lineages. They symbolize the most recent common ancestor of the groups evolving from that point, helping researchers understand when specific evolutionary paths diverged from one another.
-
What is the difference between a rooted and an unrooted tree?A rooted tree shows the path of evolution from a single common ancestor, indicating the direction of time. In contrast, an unrooted tree illustrates the relationships among species without identifying a common ancestor or a chronological sequence. Rooted trees provide more historical context, while unrooted trees focus on relatedness.
Stop drawing. Start describing.
AI diagramming isn't just text-to-diagram.
AI now understands any input, fetches live data, adapts through dialogue, and works everywhere.
Free Phylogenetic Tree templates from EdrawMax