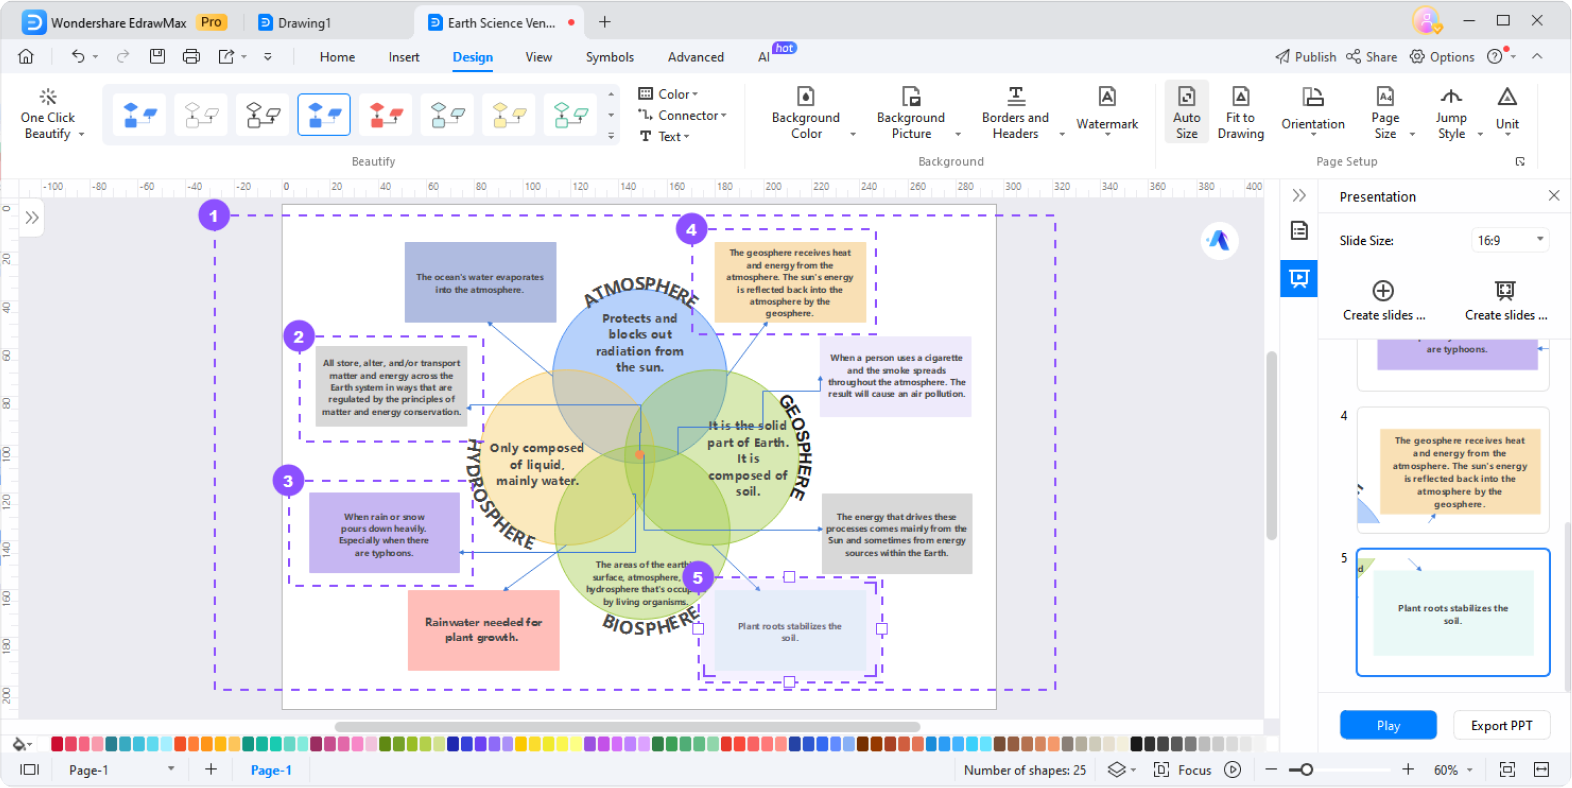
Free online Venn diagram maker
Craft polished Venn diagrams effortlessly on our user-friendly platform. Start with professional templates, customize circles intuitively, and present without a hitch.
Why Use EdrawMax Venn Diagram Maker?
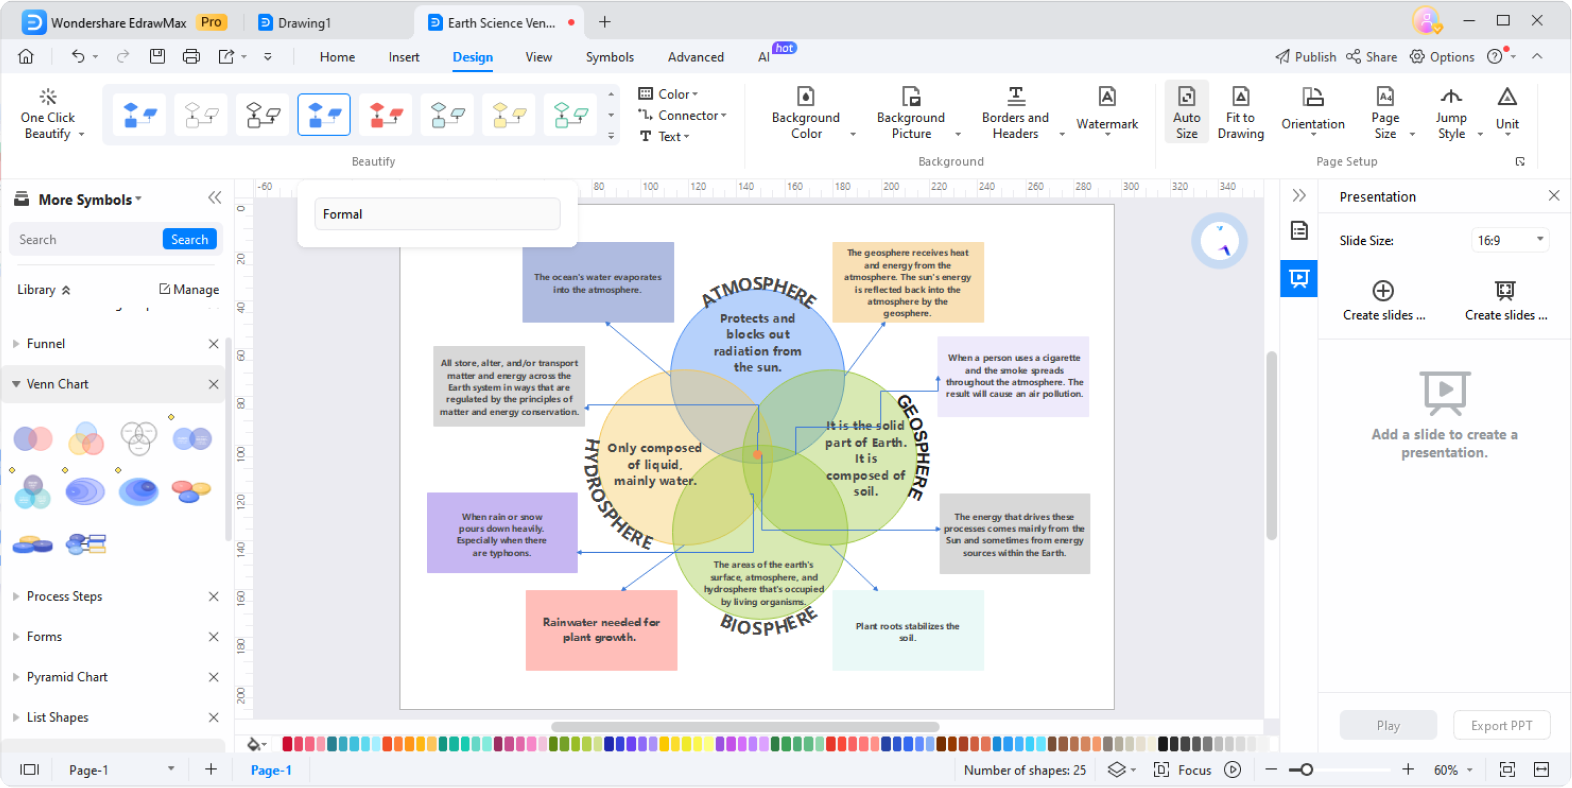
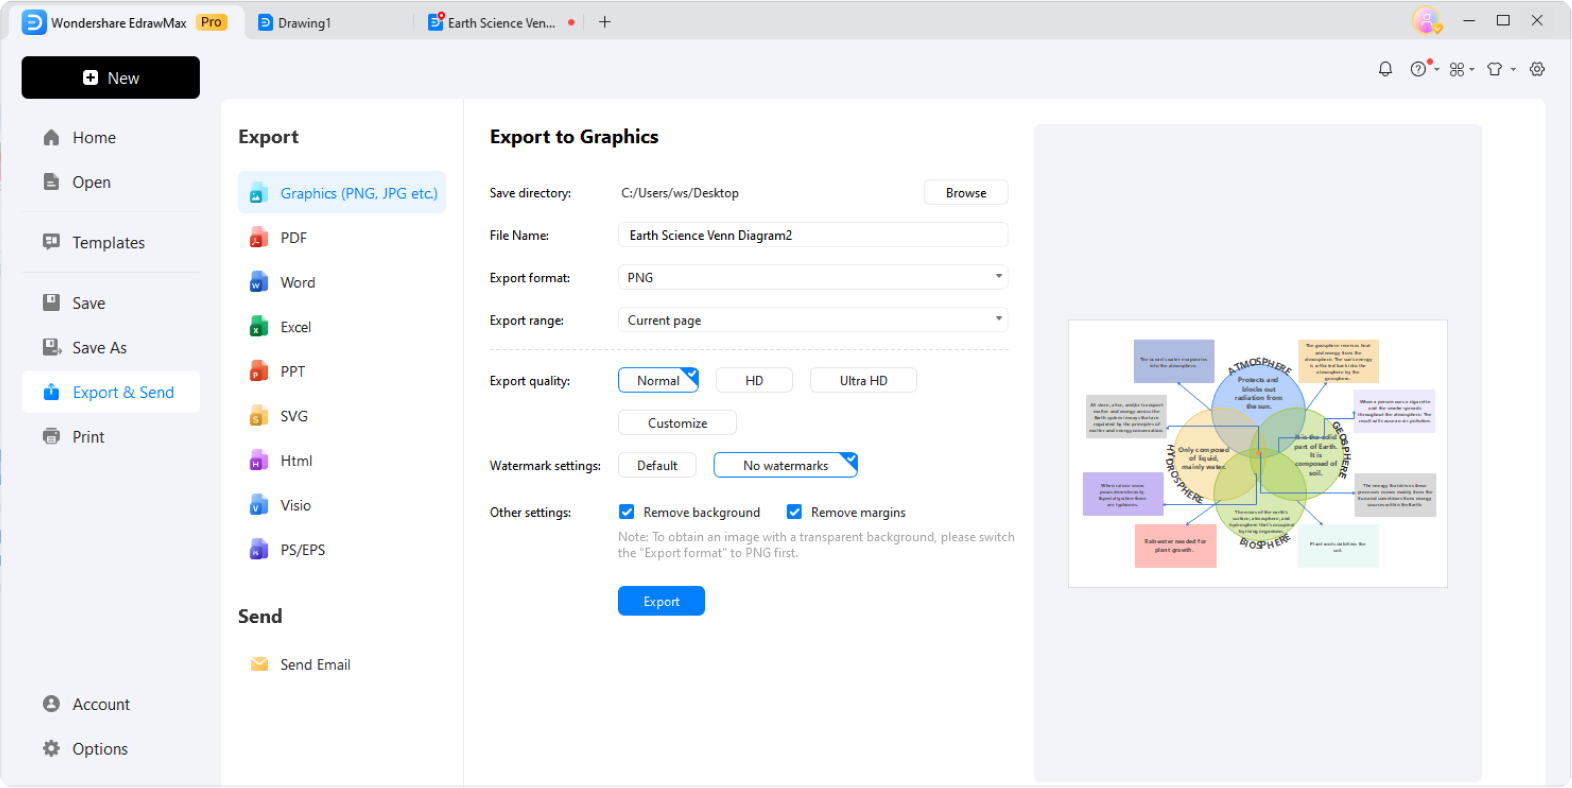
Streamline your workflow with effortless integration with MS Office. Export and embed Venn diagrams into your presentations or word documents to ensure compatibility and accessibility.

Create visually stunning presentations in minutes using our user-friendly platform. From educators conveying complex ideas to businesses presenting strategic insights, our tools simplify the process of presentaiton making with 210+ supported types of charts and diagrams.
Whether you need to share your presentations as PDFs for universal access or in native formats for collaborative editing, our platform accommodates your preferences. This flexibility ensures that your work remains accessible and adaptable across different devices and applications.

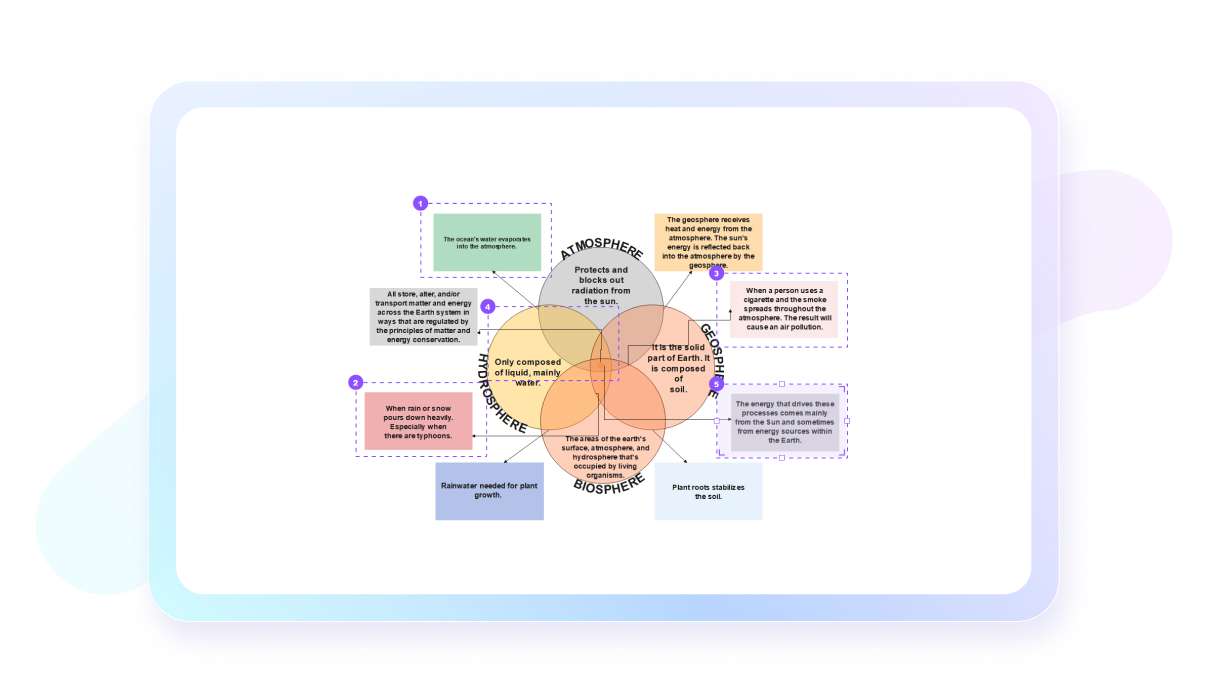
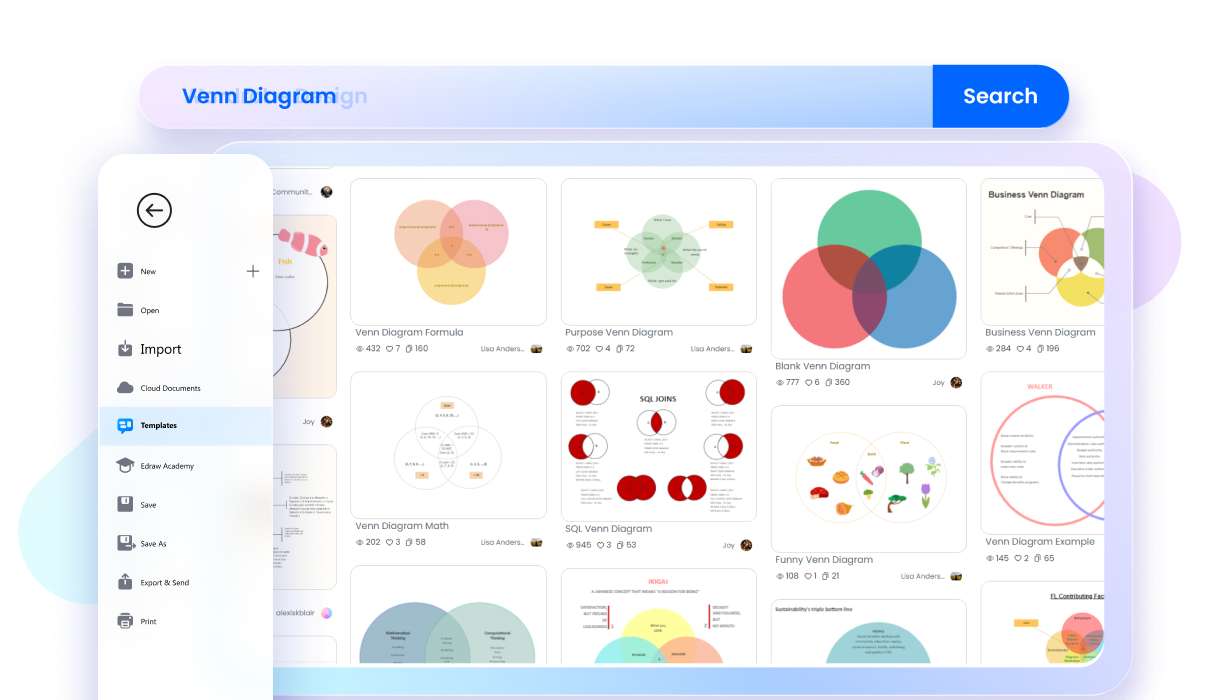
Tailor your visual storytelling with a diverse array of Venn diagram templates. Our platform caters to the unique needs of educators, researchers, and professionals alike. Choose from a variety of visually appealing templates designed to convey complex relationships with clarity.
How to Make a Venn Diagram in 4 Simple Steps

What our users say
More Venn Diagram Tools
Discover more AI-powered diagram makers to boost your productivity.
FAQs About EdrawMax Venn Diagram Tools
-
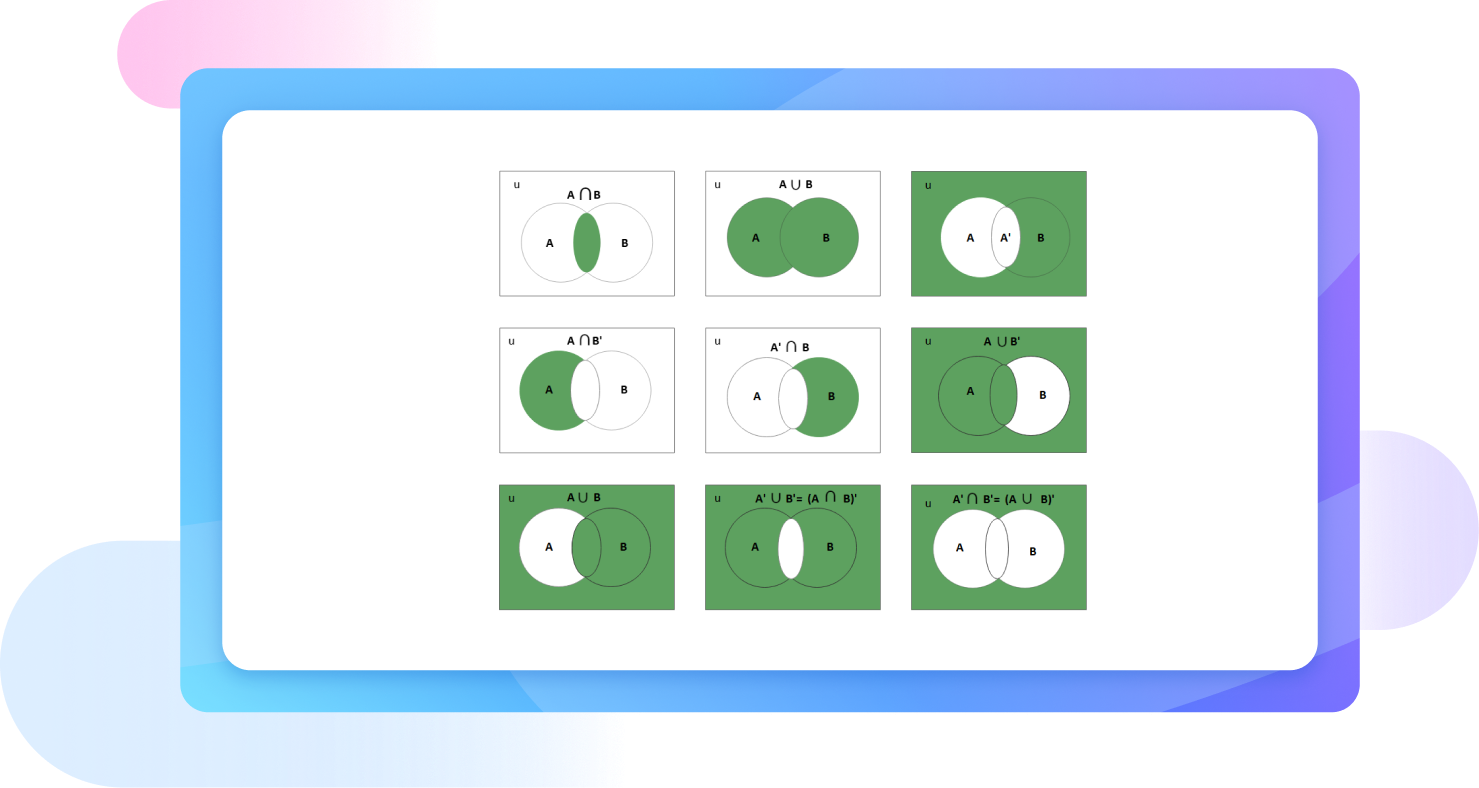
What is a Venn diagram?A Venn diagram is a visual tool used to show the relationships between different groups of things. It typically consists of overlapping circles, where each circle represents a specific category. The areas where circles overlap show shared traits, while the non-overlapping sections highlight characteristics unique to a single group.
-
What does the overlapping section of the circles represent?The overlapping area, known as the intersection, represents elements that belong to both categories simultaneously. For example, if one circle contains "mammals" and another "aquatic animals," the overlap would include whales and dolphins. It is a powerful way to identify commonalities and shared characteristics between distinct groups of data.
-
How many circles can a Venn diagram include?Most Venn diagrams use two or three circles to keep the information clear and easy to read. However, they can technically include more, such as four or five shapes. As you add more circles, the diagram becomes increasingly complex, often requiring elliptical shapes to show all possible intersections correctly.
-
How does a Venn diagram differ from an Euler diagram?A Venn diagram shows all possible logical relationships between sets, even if some intersections are empty. In contrast, an Euler diagram only displays relationships that actually exist. If two categories have no overlap, an Euler diagram will show them as separate circles, whereas a Venn diagram will still overlap them.
-
What is the "universal set" in a Venn diagram?The universal set, often represented by a large rectangle surrounding the circles, includes every element being considered in a particular study. Any item that does not fit into the specific categories represented by the circles is placed inside the rectangle but outside the circles, showing it belongs to the broader context.
Learn about Venn Diagram
Stop drawing. Start describing.
AI diagramming isn't just text-to-diagram.
AI now understands any input, fetches live data, adapts through dialogue, and works everywhere.
Free Venn diagram templates from EdrawMax