Data flow diagram for smart traffic system
Understand the data flow inside a smart traffic system using this data flow diagram.
- All templates
- Data flow diagrams
- Data flow diagram smart traffic
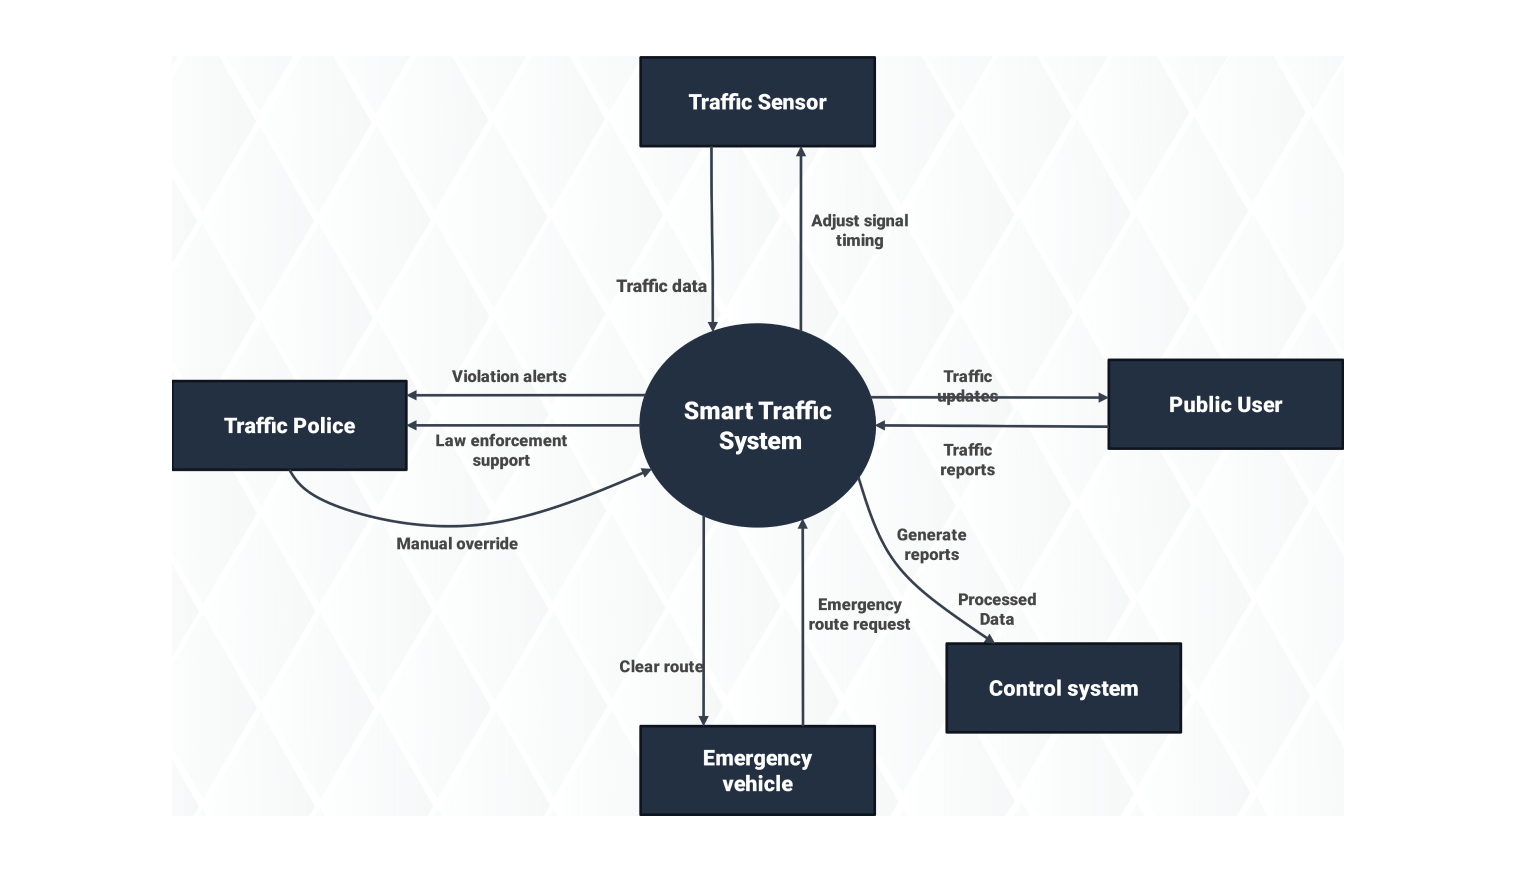
About this data flow diagram for the smart traffic
The data flow diagram (DFD) shows how information moves in the smart traffic system. It highlights the connections between elements that manage and optimize traffic. The traffic sensor starts by gathering real-time data. This data includes vehicle counts, speed measurements, and congestion levels. The smart traffic system gets data from traffic sensors. It then adjusts traffic signal timing. This helps manage traffic better and reduces congestion.
The system provides traffic updates. Public users can access these updates for real-time information. This helps them plan their routes better. The system takes emergency route requests during crises. It reprograms traffic signals to create safe paths for emergency responders. This helps them reach their destinations quickly.
Law enforcement gets alerts about violations from the system. These include red-light violations and speeding incidents. This helps the proper authorities respond quickly. The system lets traffic controllers and law enforcement take full manual control of traffic operations when necessary.
The smart traffic system makes reports. These reports analyze traffic patterns and find problem areas. This helps with planning infrastructure. The control system combines all components for smooth operation. It handles data processing and sends control signals to traffic lights and other devices.
The data flow diagram shows how data moves. It starts at traffic sensors, then goes to law enforcement and public users. Finally, it ends at the control system. This sequence is key for effective traffic management. All parts have clear roles for data processing and command transfer. This lets the system work well together. The DFD presents an organized structure of data movements that occur within the smart traffic system.
Related templates
Get started with EdrawMax today
Create 210 types of diagrams online for free.
Free Download Free Download Draw a diagram free Draw a diagram free Draw a diagram free