System data flow diagram
Map out your system’s processes and how data flows between users and components.
- Templates
- Data flow diagram templates
- System data flow diagram
About this template
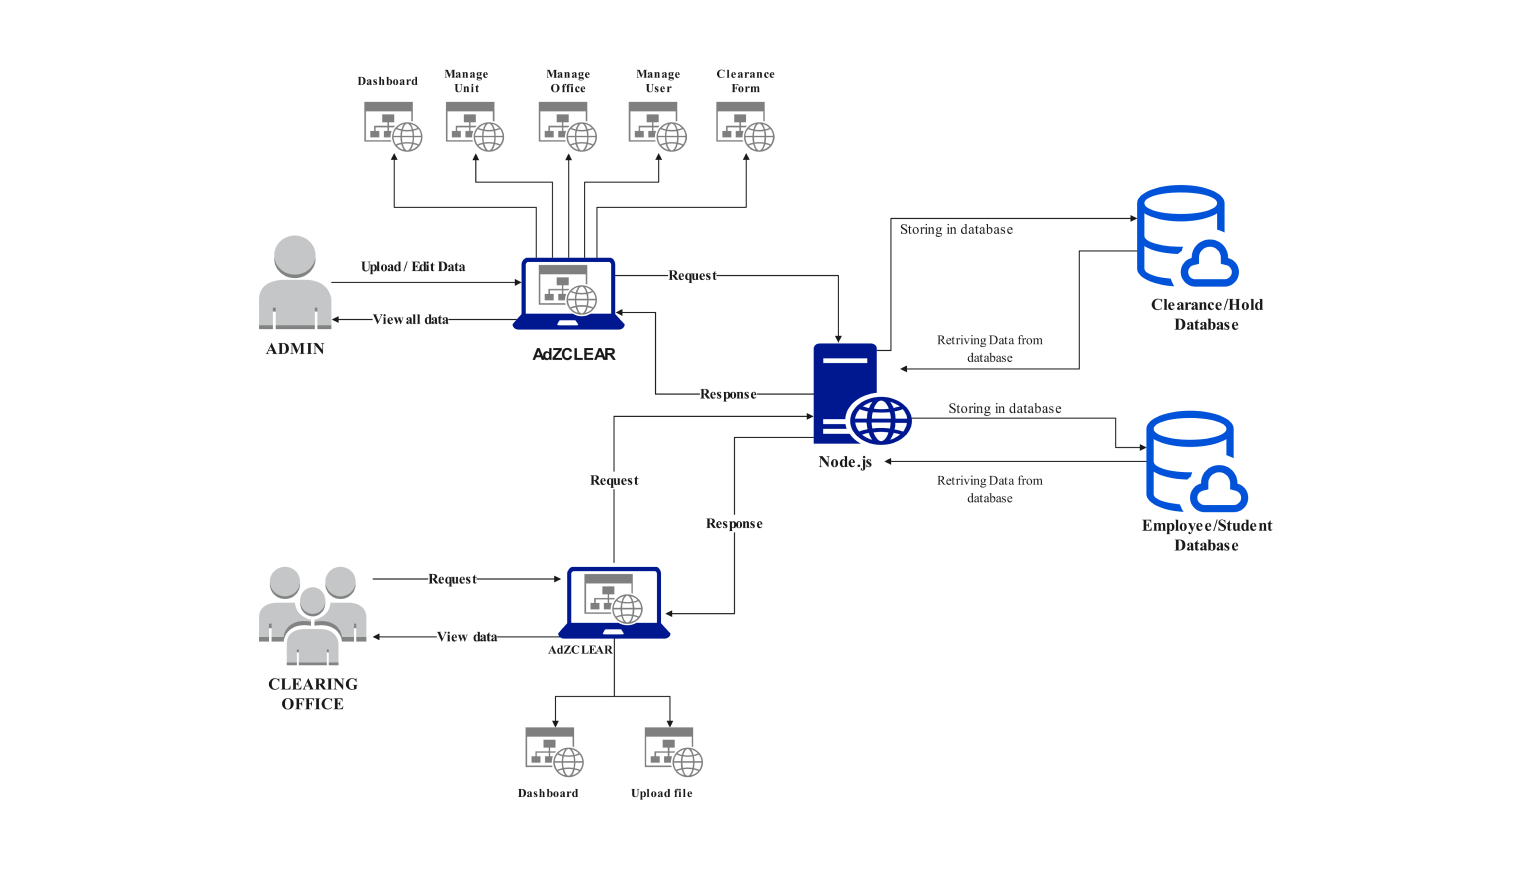
A system data flow diagram gives you a clear picture of how information moves through a system. It helps understand relationships between users, applications, and databases. This diagram simplifies the flow of requests, responses, and data storage across different components.
The above diagram shows a system built around “AdZCLEAR”. The admin manages the core setup, including dashboards, users, and forms. Admins can upload or edit data connecting to the main server (Node.js). From there, the server stores or retrieves data from either the clearance/hold database or the employee/student database.
The clearing office interacts with the system to access and update records. They rely on the dashboard or file uploads to manage data requests. Meanwhile, the central server handles all actions, whether retrieving or storing data. This ensures that users interact with the system in real-time while databases stay up-to-date.
This system data flow diagram helps you see the big picture. It uses visual elements to indicate data flow between users, the server, and the databases.
Every arrow shows where information is going and how the system responds. Whether you’re setting up a workflow or troubleshooting an issue, this template clarifies how your system functions.
To use this template, think about the specific steps in your process. Start by identifying who will handle the admin tasks. Then, outline the key data flows, such as what gets stored, who retrieves it, and when approvals are needed. The visual breakdown will help you pinpoint inefficiencies or gaps in your process.
Related templates

Get started with EdrawMax today
Create 210 types of diagrams online for free.
Free Download Free Download Draw a diagram free Draw a diagram free Draw a diagram free