Lab fishbone diagram

- All templates
- Fishbone diagram templates
- Lab fishbone diagram
About this Lab fishbone diagram
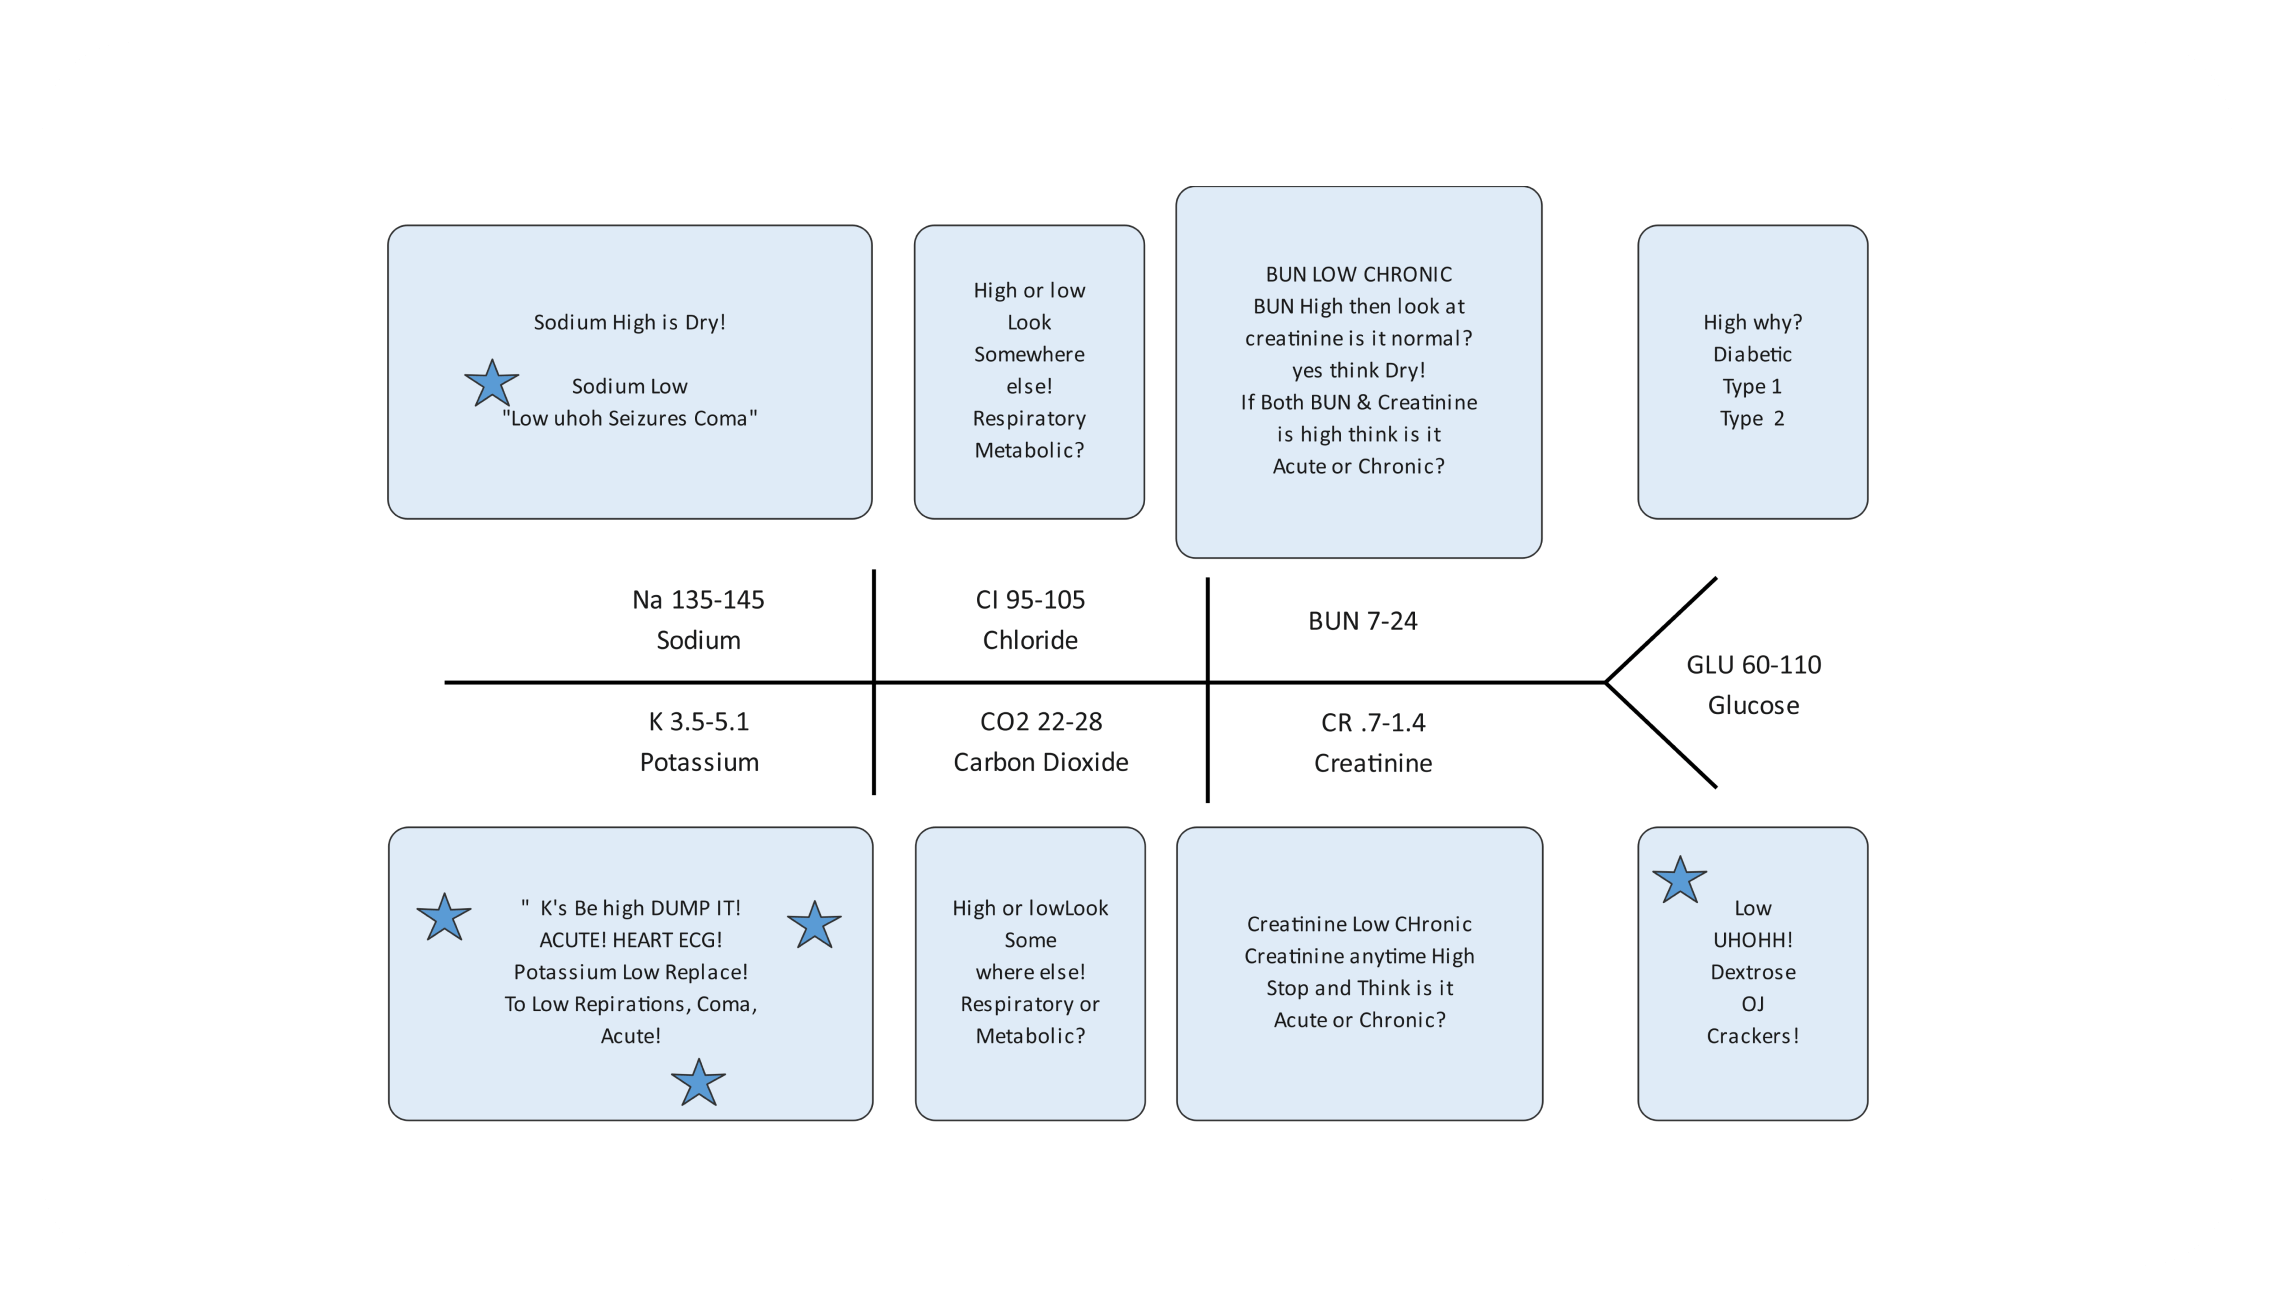
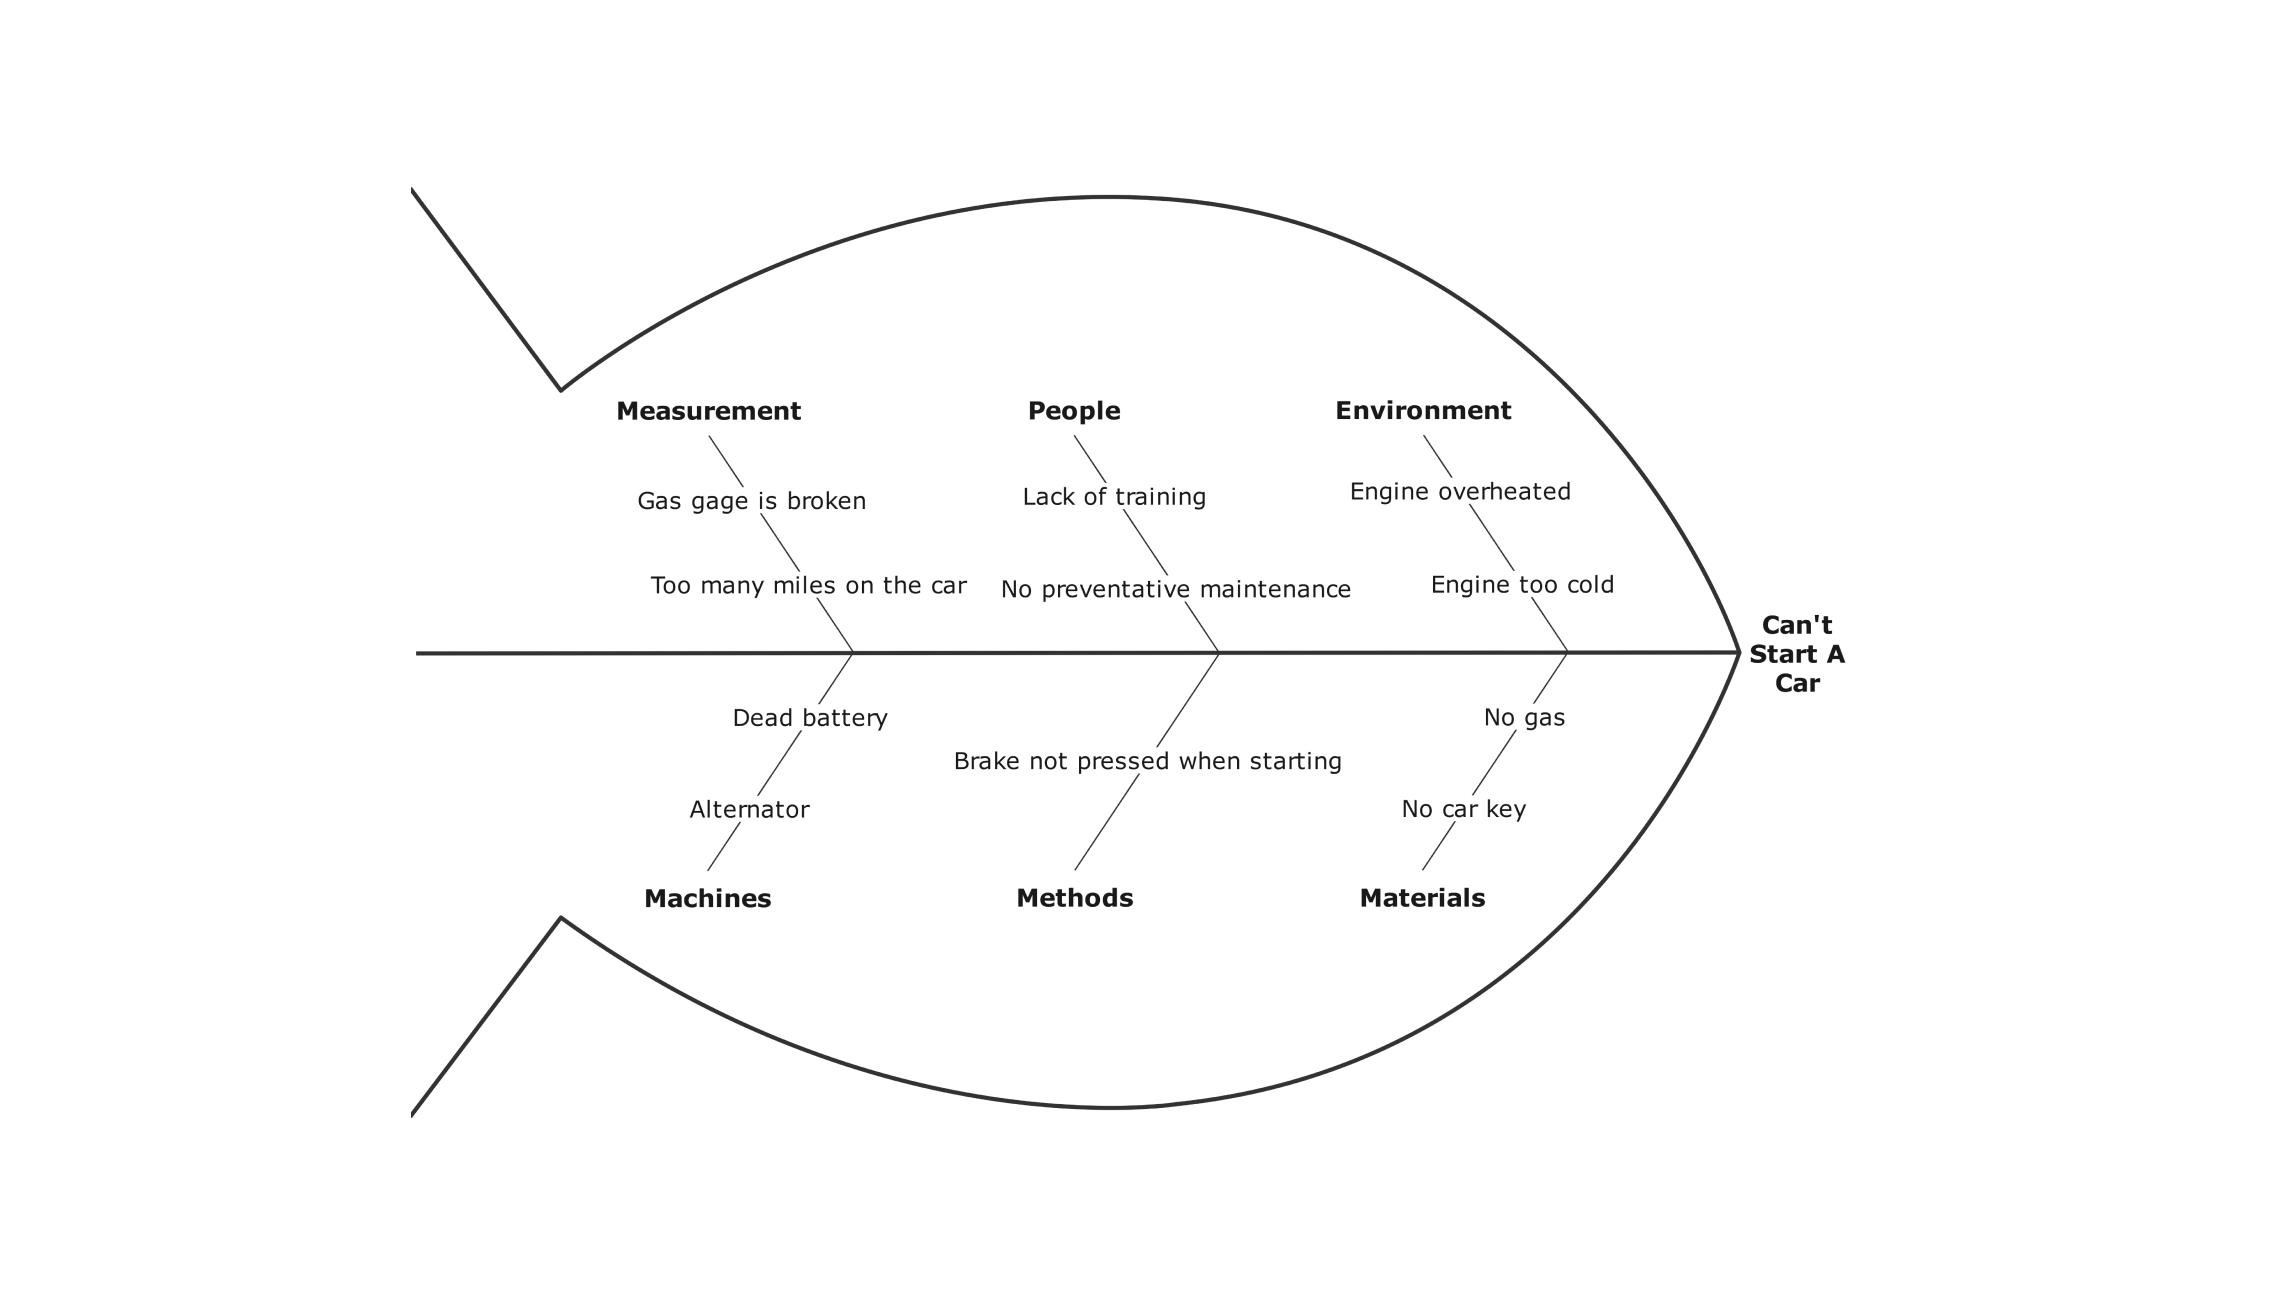
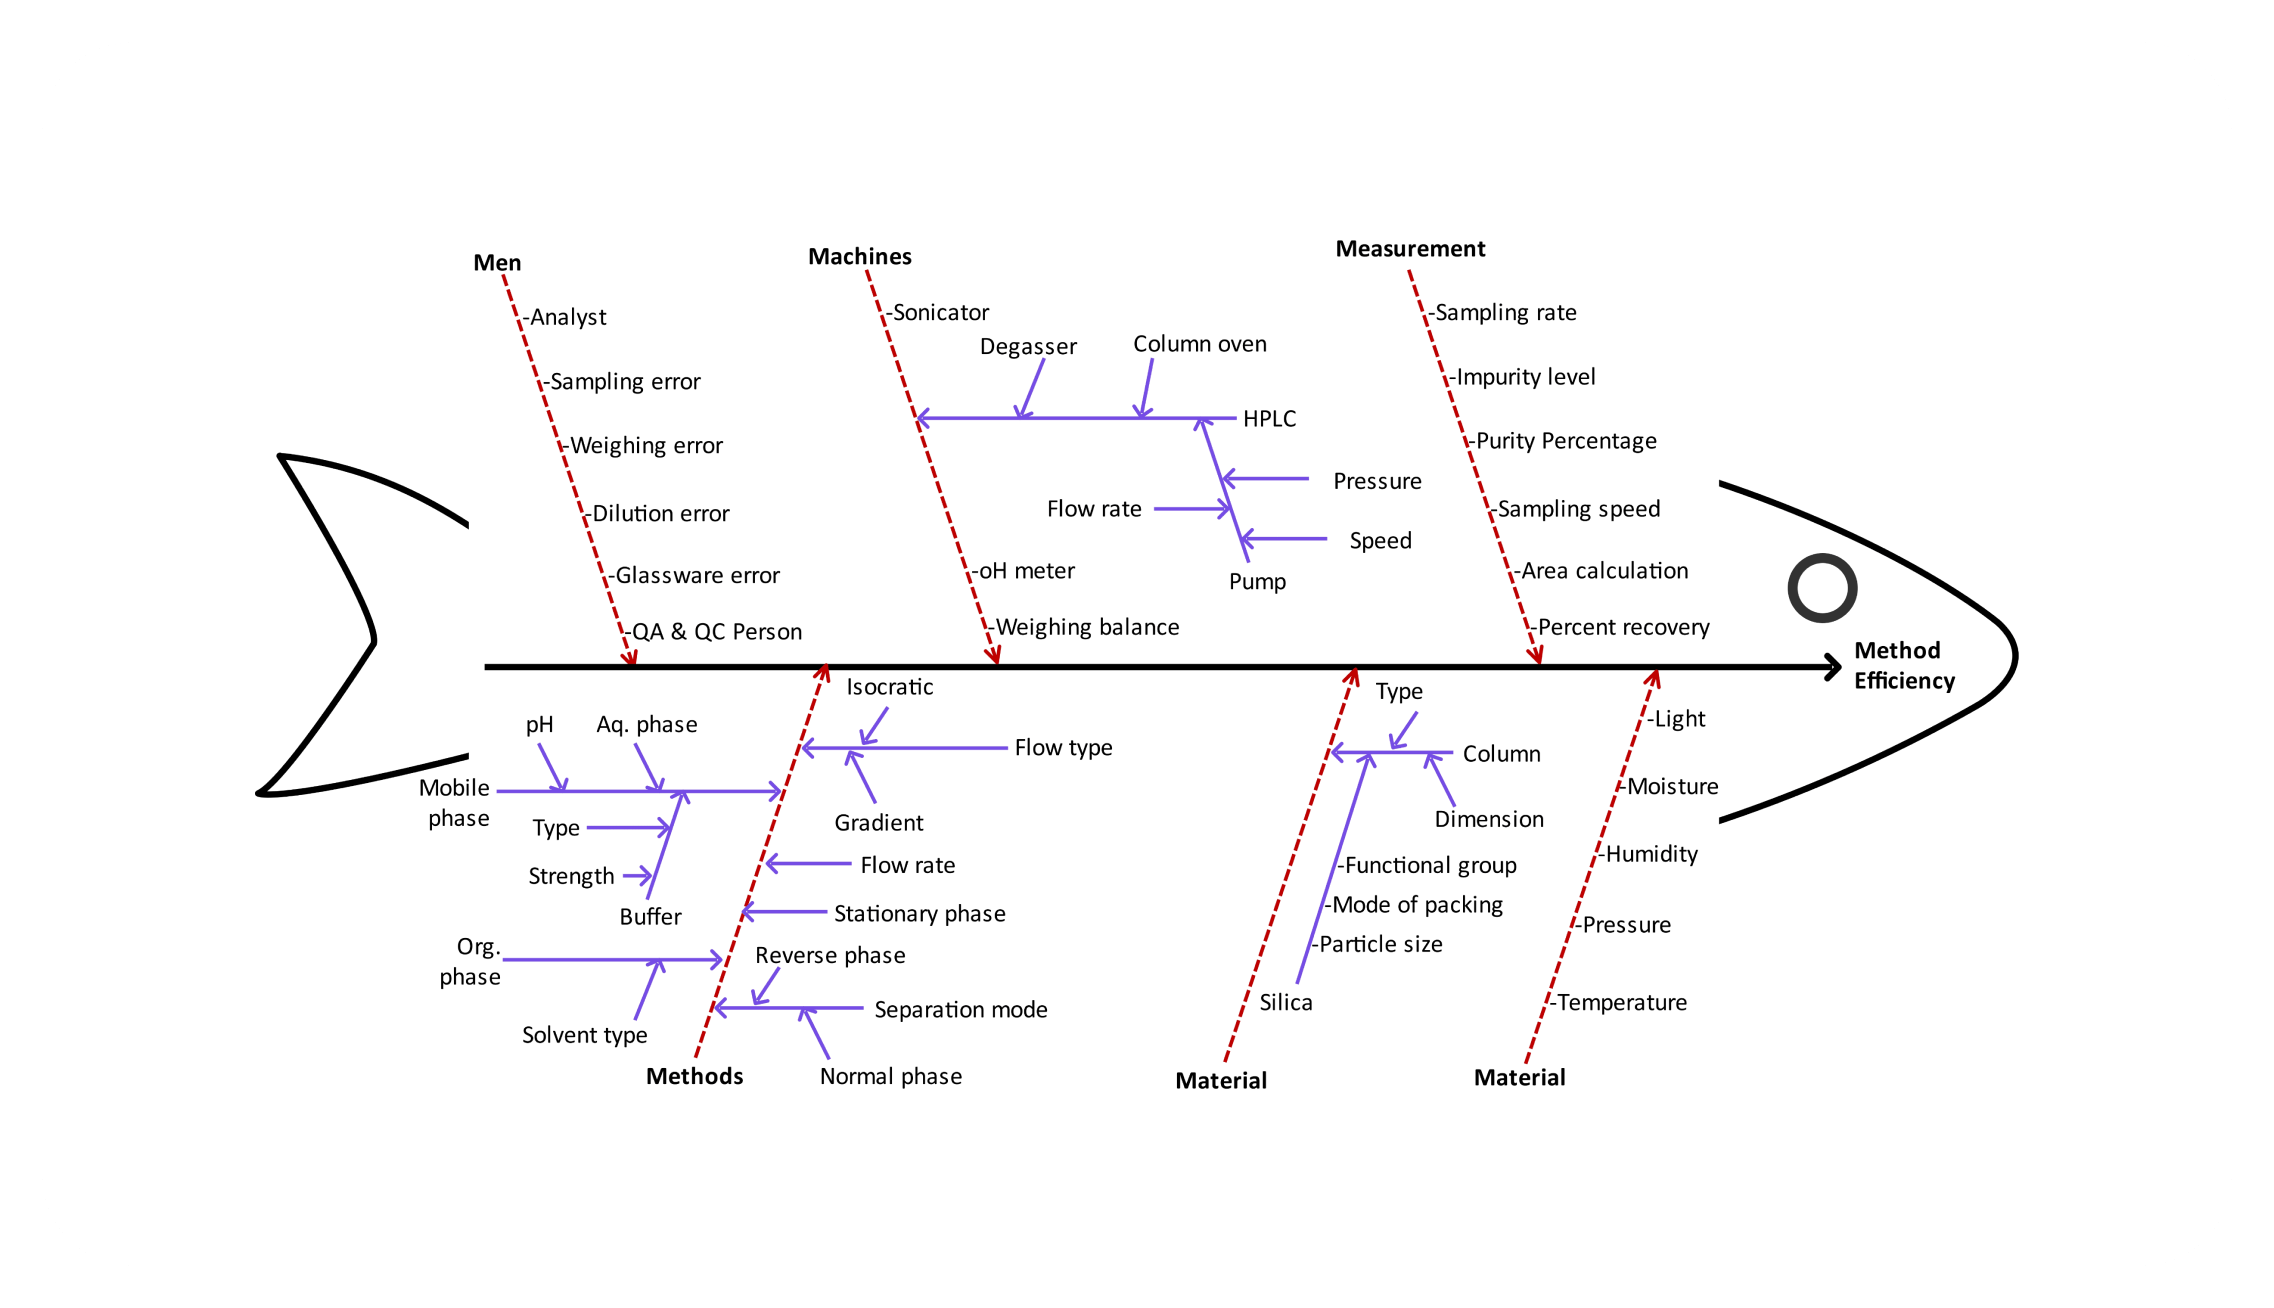
A lab fishbone diagram—also called an Ishikawa or cause-and-effect diagram—organizes possible causes of a laboratory problem around one clearly defined effect. Use it to structure root-cause analysis for issues such as unexpected test results, sample errors, instrument problems, reagent issues, workflow variation, or environmental conditions.
Start with the problem statement at the head of the diagram, then group possible causes into categories that fit the investigation. Common categories can include people, methods, equipment, materials or reagents, measurement, and environment; rename them to match your laboratory process.
This editable template works well for laboratory quality reviews, incident investigations, method troubleshooting, and team brainstorming. A fishbone diagram helps organize hypotheses; it does not prove which factor is the root cause, so confirm suspected causes with evidence, records, or follow-up testing.
Related templates


Get started with EdrawMax today
Create 210 types of diagrams online for free.
Free Download Free Download Draw a diagram free Draw a diagram free Draw a diagram free (AI & Web)