
- All templates
- Fishbone diagram templates
- Ozone depletion fishbone diagram
About this Ozone depletion fishbone diagram
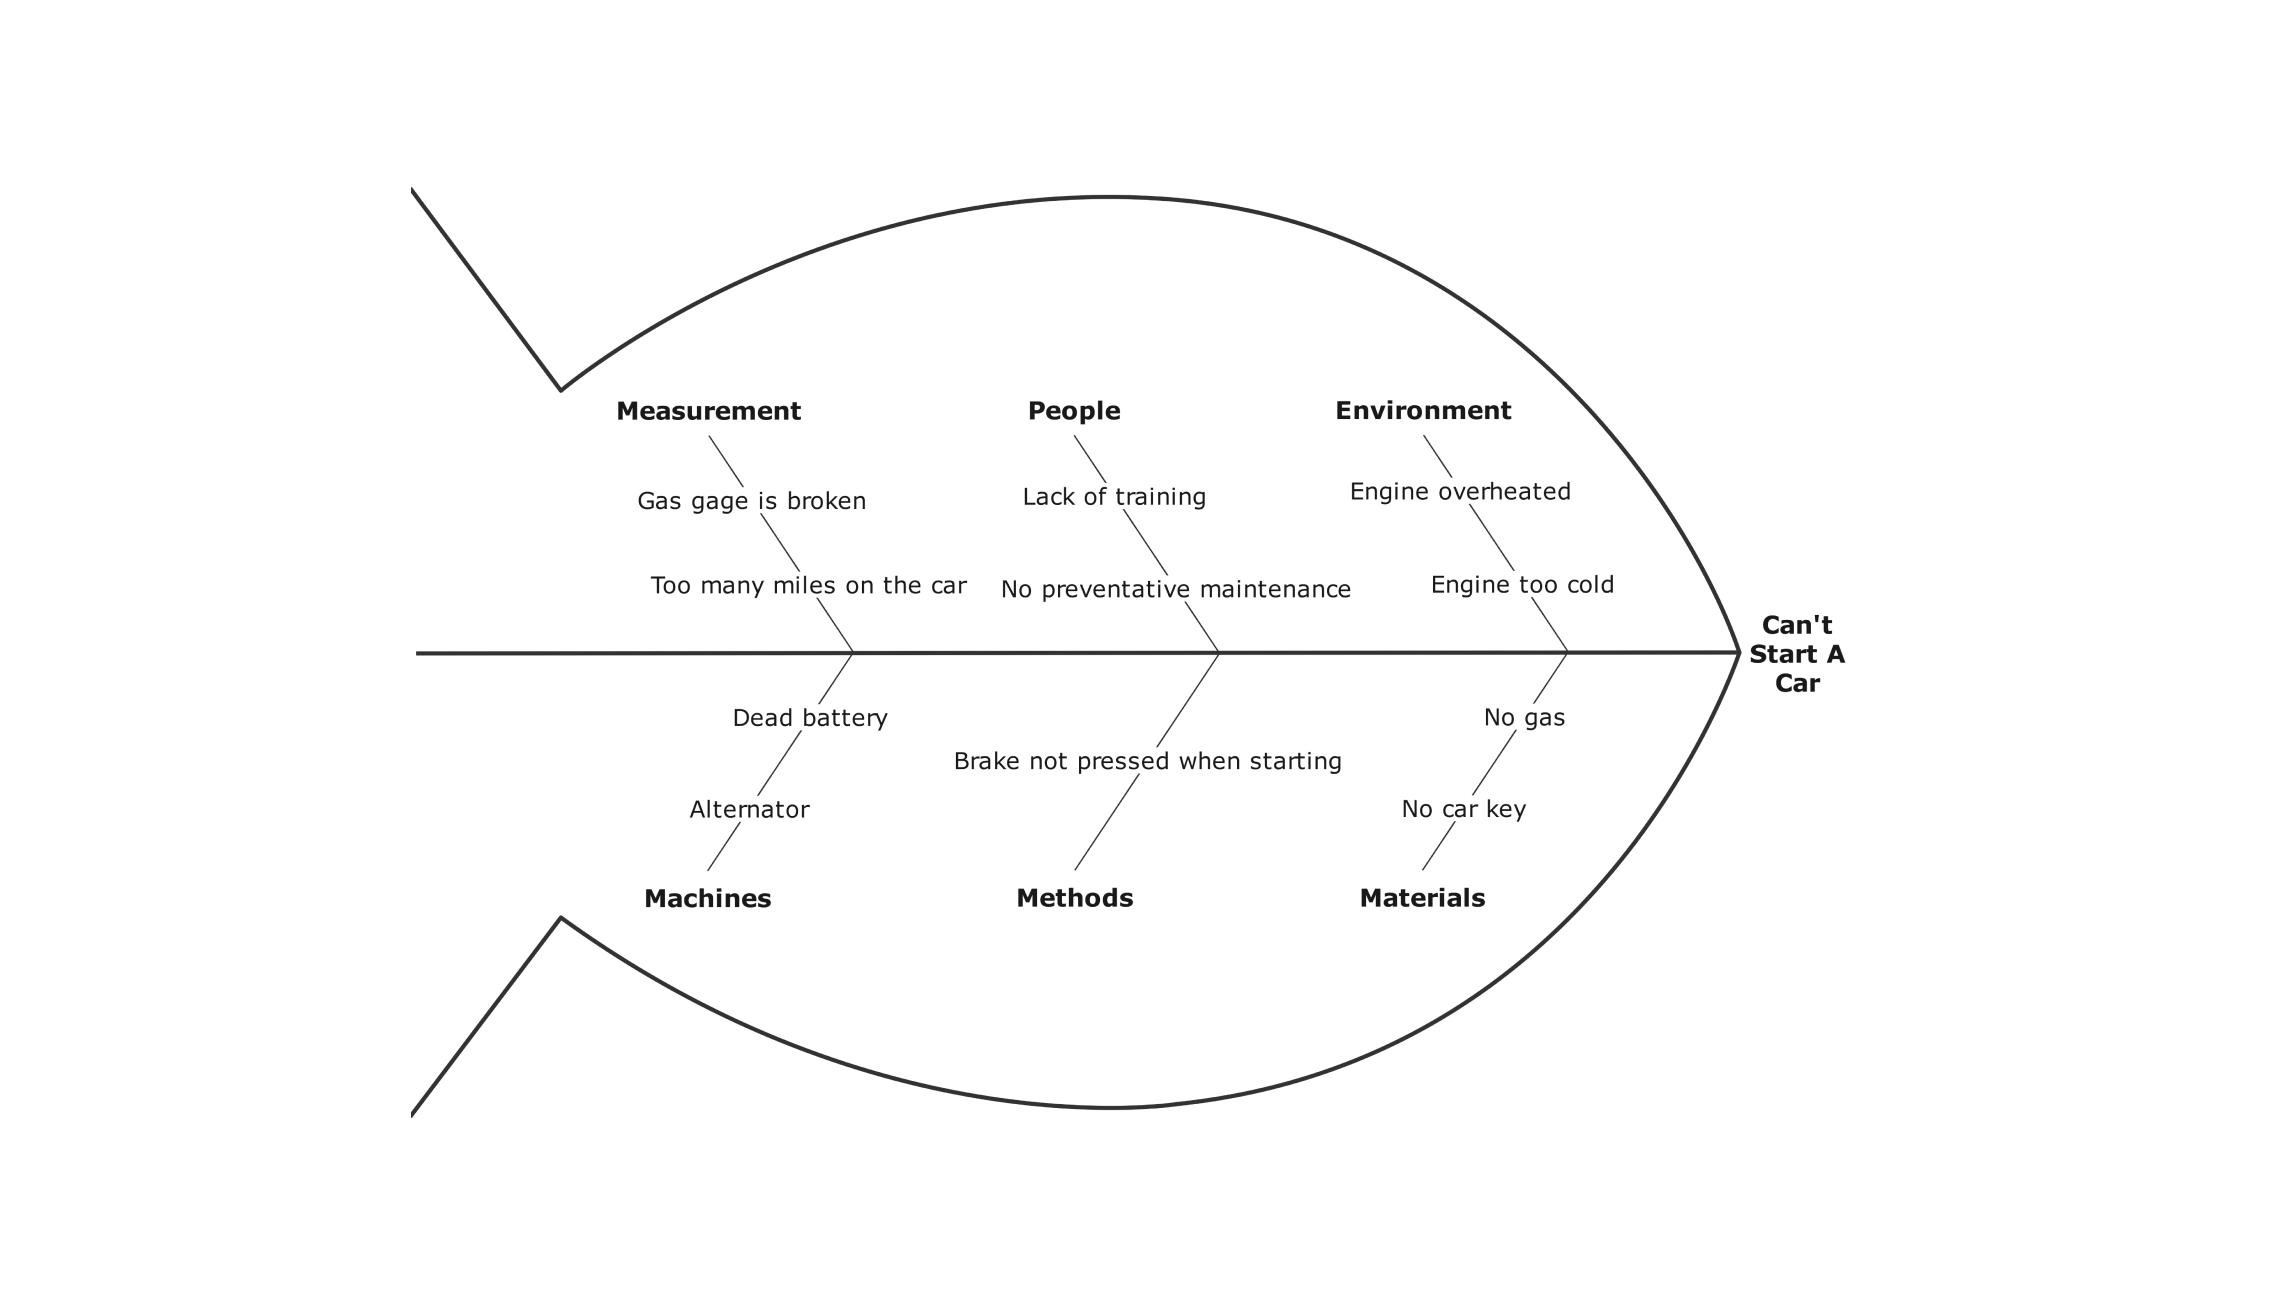
This Fishbone Diagram can be your ideal tool to explore ozone depletion. It breaks down the problem into clear parts, resembling a fish skeleton. The head represents the main issue—ozone depletion and the bones show contributing factors.
Its appealing but practical visuals provide information efficiently. The connections between causes and effects are easy to comprehend, simplifying complex relationships.
It is valuable for scientists, teachers, students, or anyone interested in saving the environment. It can also help you in research, presentations, or brainstorming. Visualize Ozone depletion causes and effects to find better solutions.
Moreover, you can make it your own with EdrawMax – even without fancy design skills.
Related templates


Get started with EdrawMax today
Create 210 types of diagrams online for free.
Free Download Free Download Draw a diagram free Draw a diagram free Draw a diagram free