- All templates
- Fishbone diagram templates
10 Fishbone Diagram Templates
Explore 10 fishbone diagram examples, including cause-and-effect layouts and laboratory-value shorthand. Choose the format that matches your task, then replace the sample labels and information.
Categories
-
Teams
-
User cases
-
Diagram types
Flowchart Mind map Concept map Bubble map Org chart Gantt chart Pie chart Bar chart Form Table Genogram Pedigree charts Timeline Family tree Floor plan PID diagram Circuit diagram Wiring diagram Block diagram Network diagram ER diagram UML diagram Class diagram Activity diagram Interaction overview diagram Sequence diagram Deployment diagram Communication diagram Internal block diagram Composite structure diagram Use case diagram Package diagram Timing diagram SWOT analysis Value chain analysis PESTEL analysis Decision tree Fishbone diagram WBS diagram Math diagram Road map Graphic organizer Data flow diagram



Choose the Right Fishbone Format
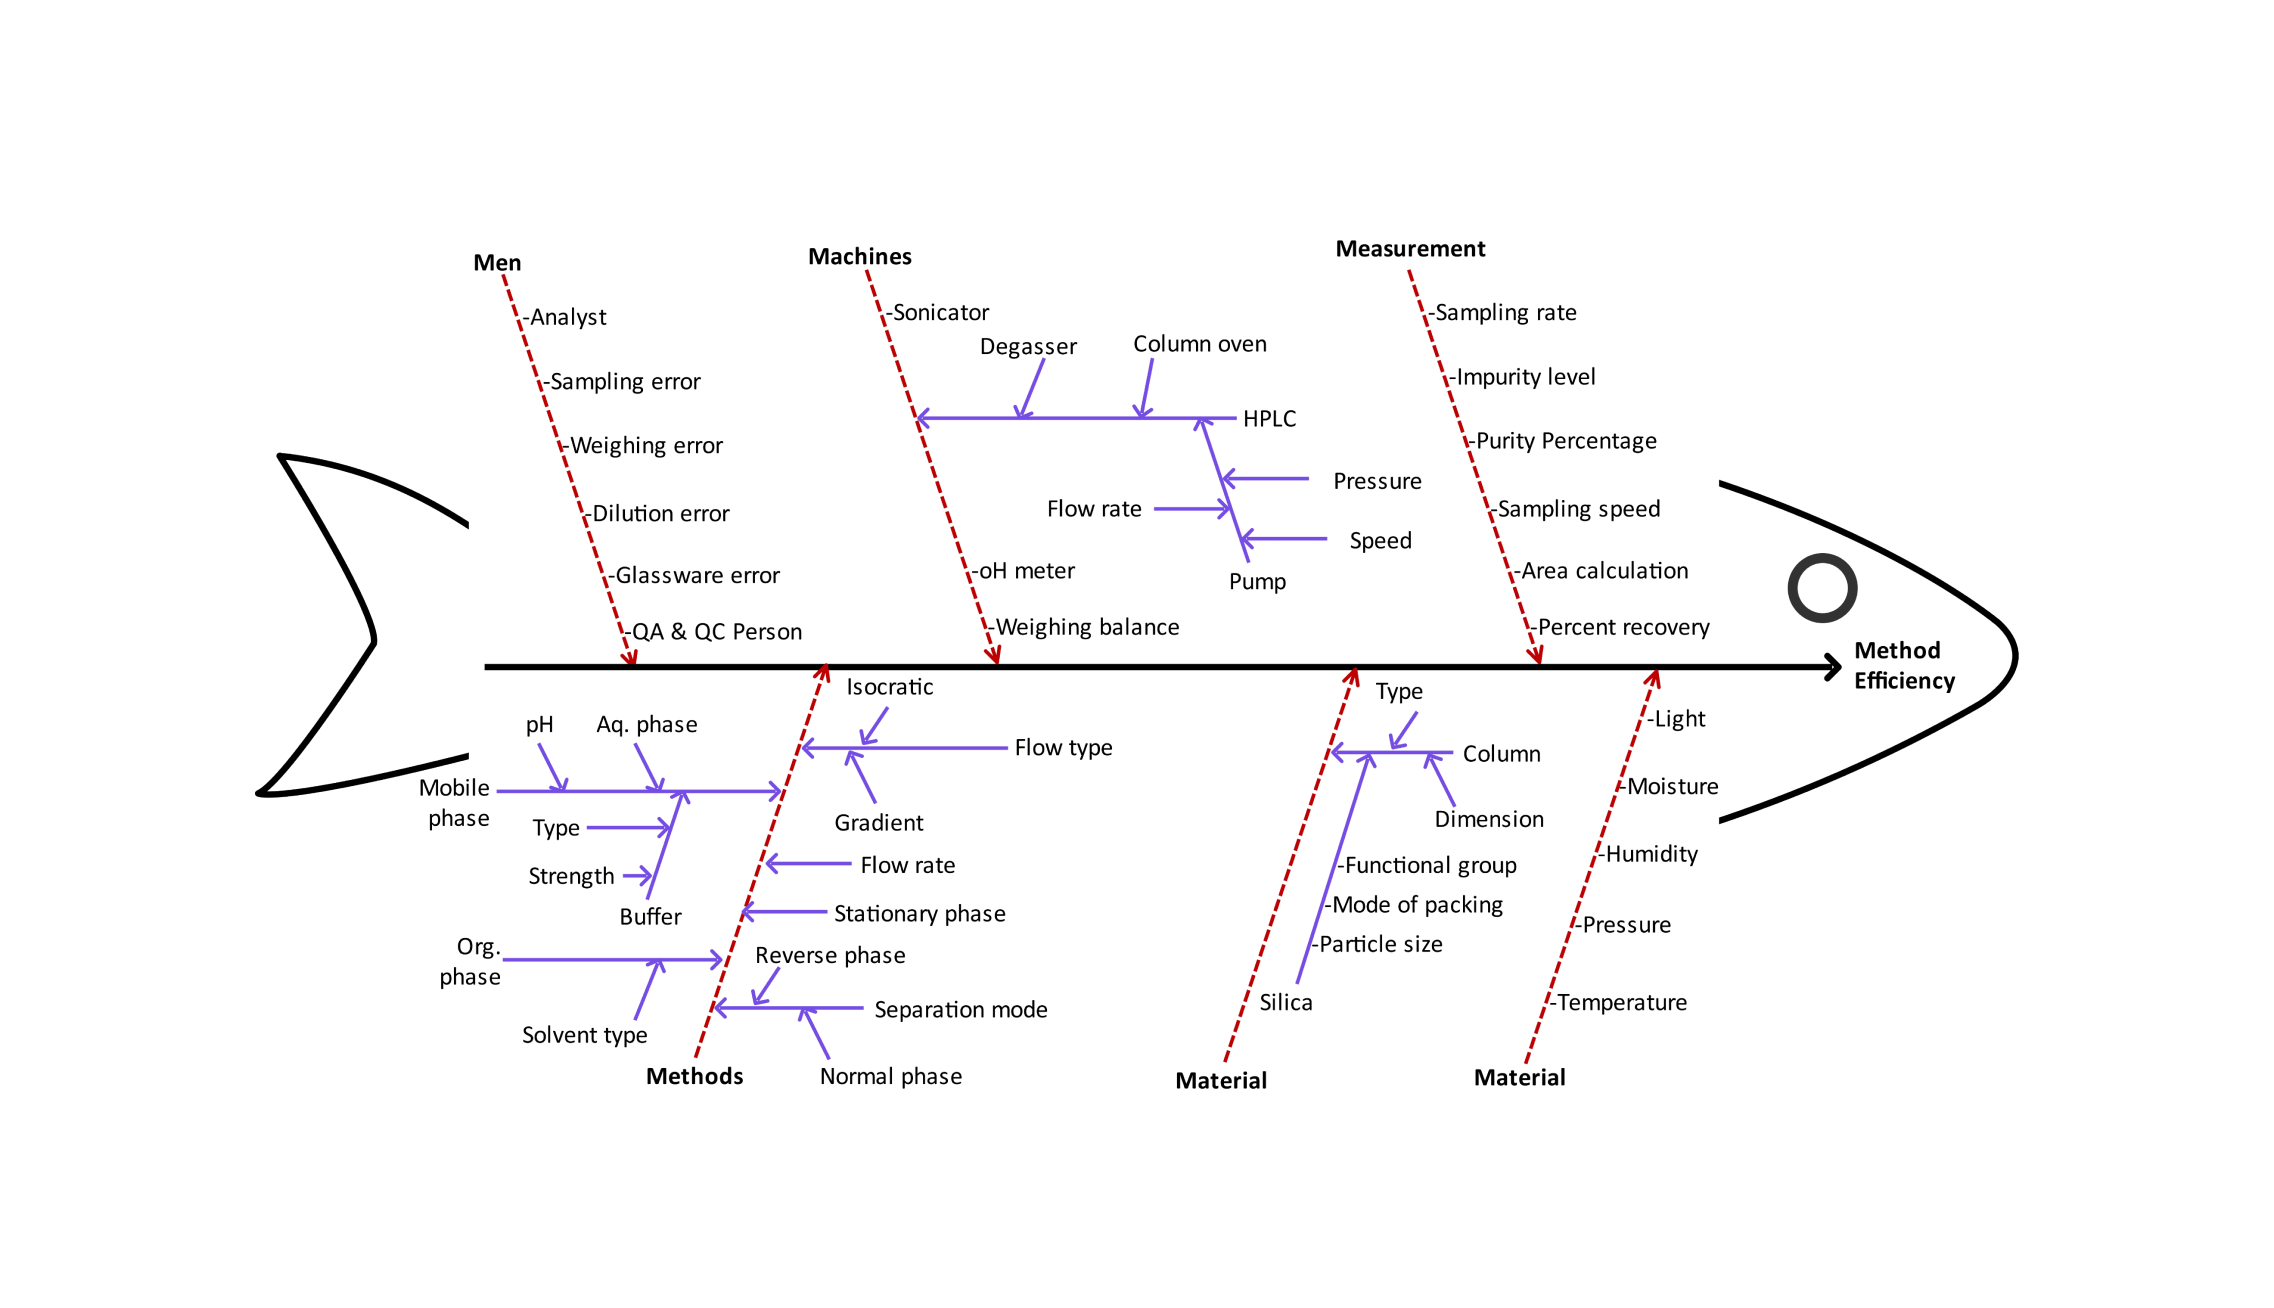
An Ishikawa, or cause-and-effect, diagram organizes possible causes around a clearly stated problem. Use it to structure an investigation; the diagram alone does not establish which cause is correct.
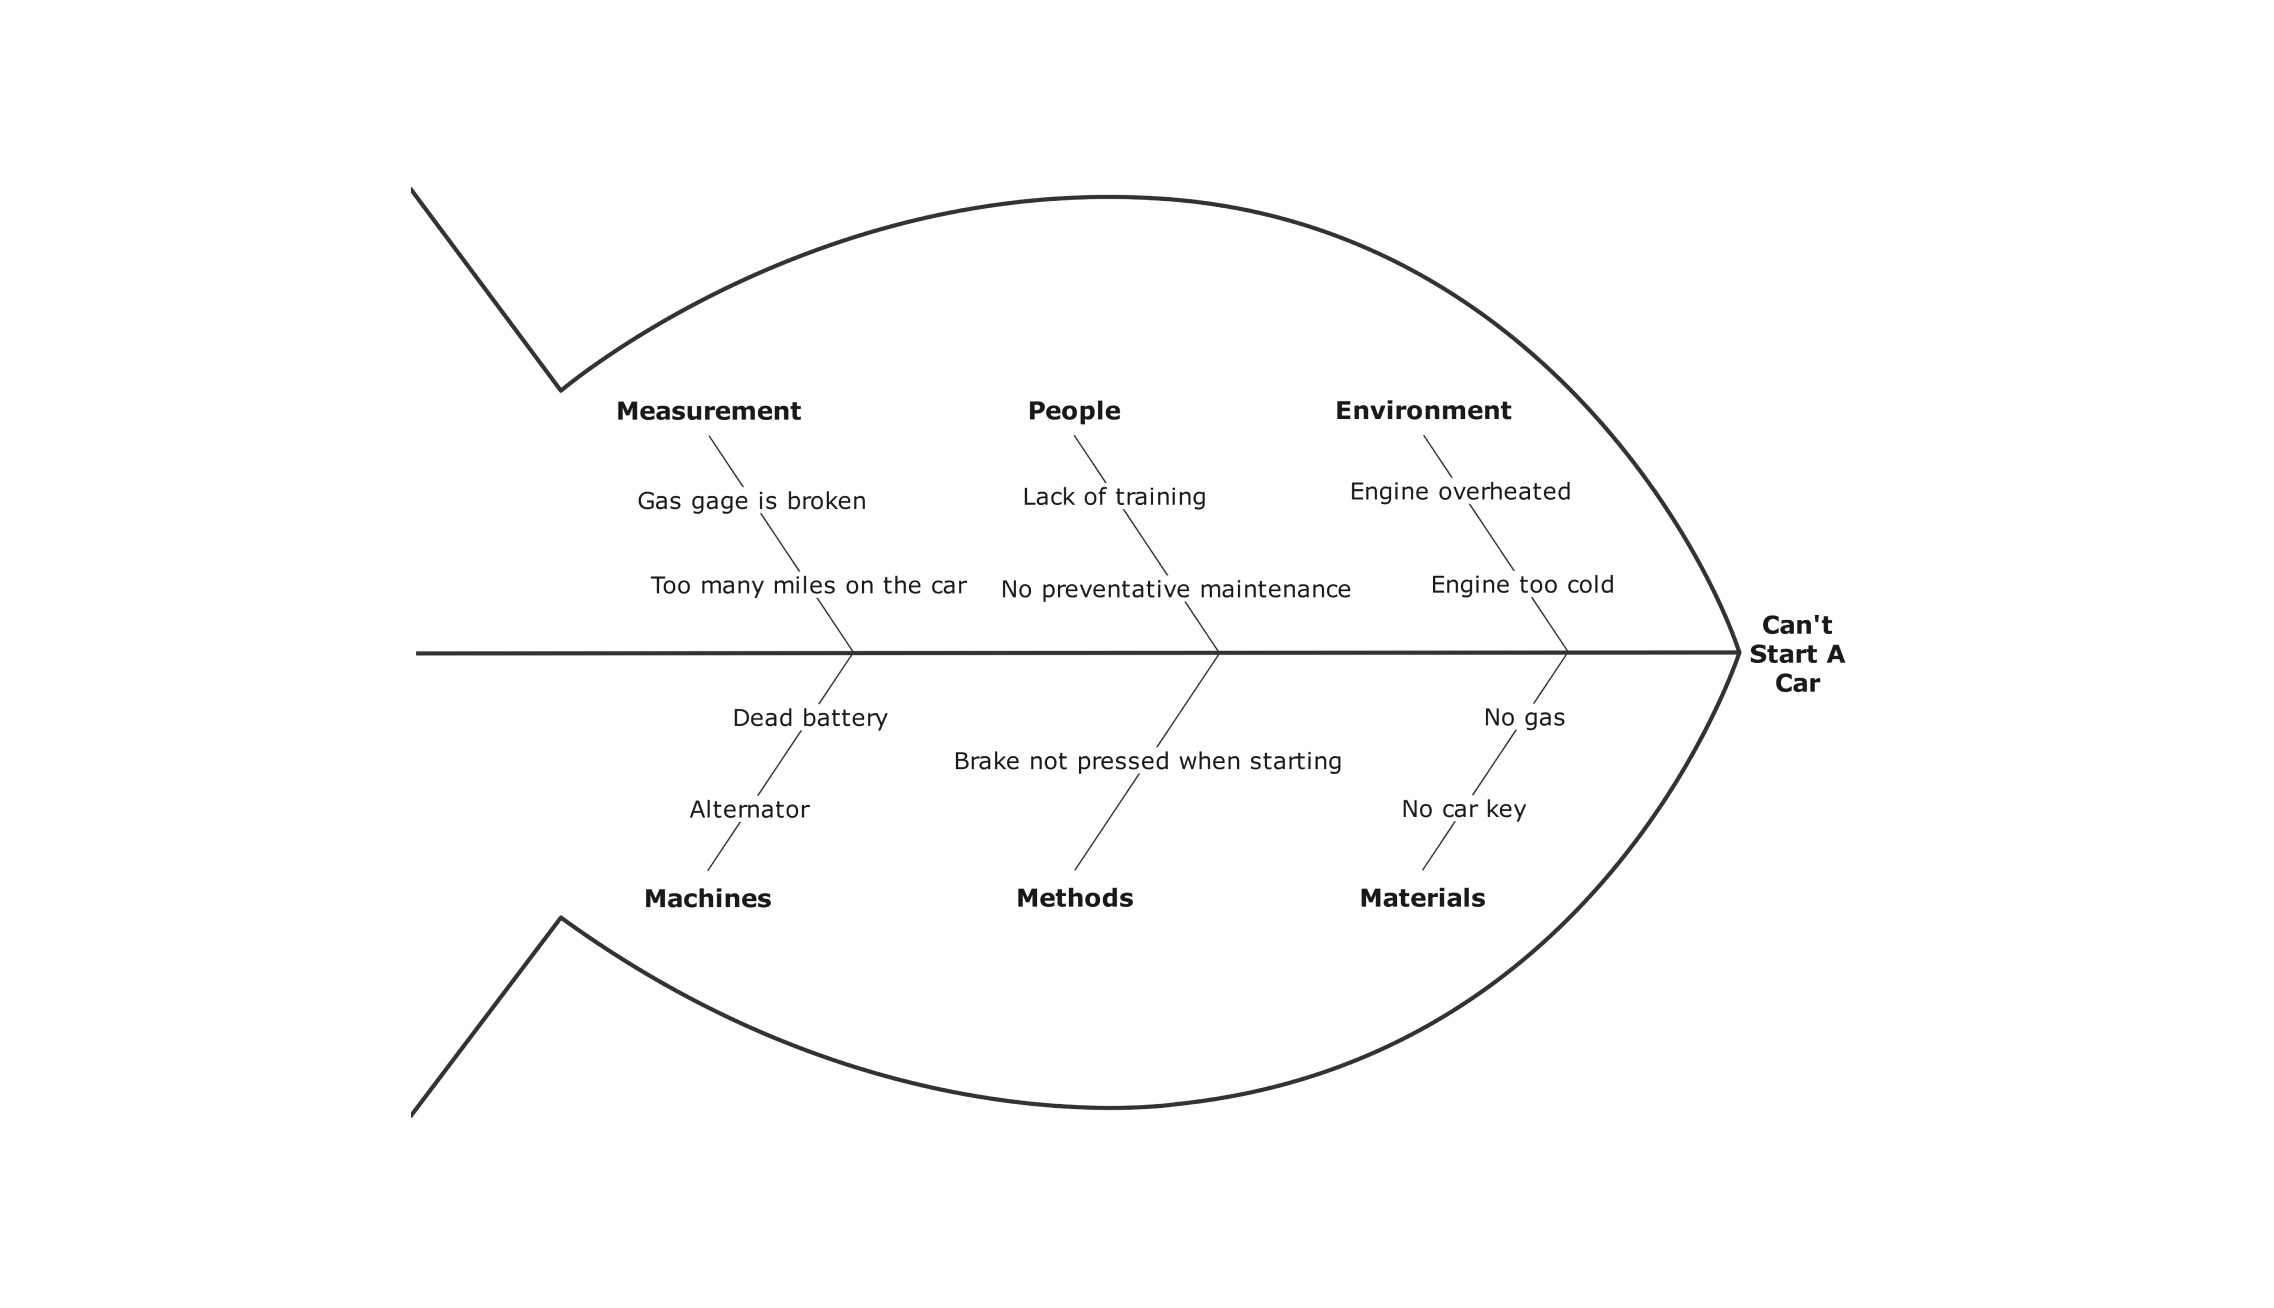
- Cause-and-effect examples: use manufacturing, car breakdown, customer loss, or lab fire layouts to organize possible contributing factors.
- Category structure: start with categories relevant to your process. A manufacturing investigation may use People, Methods, Machines, Materials, Measurement, and Environment.
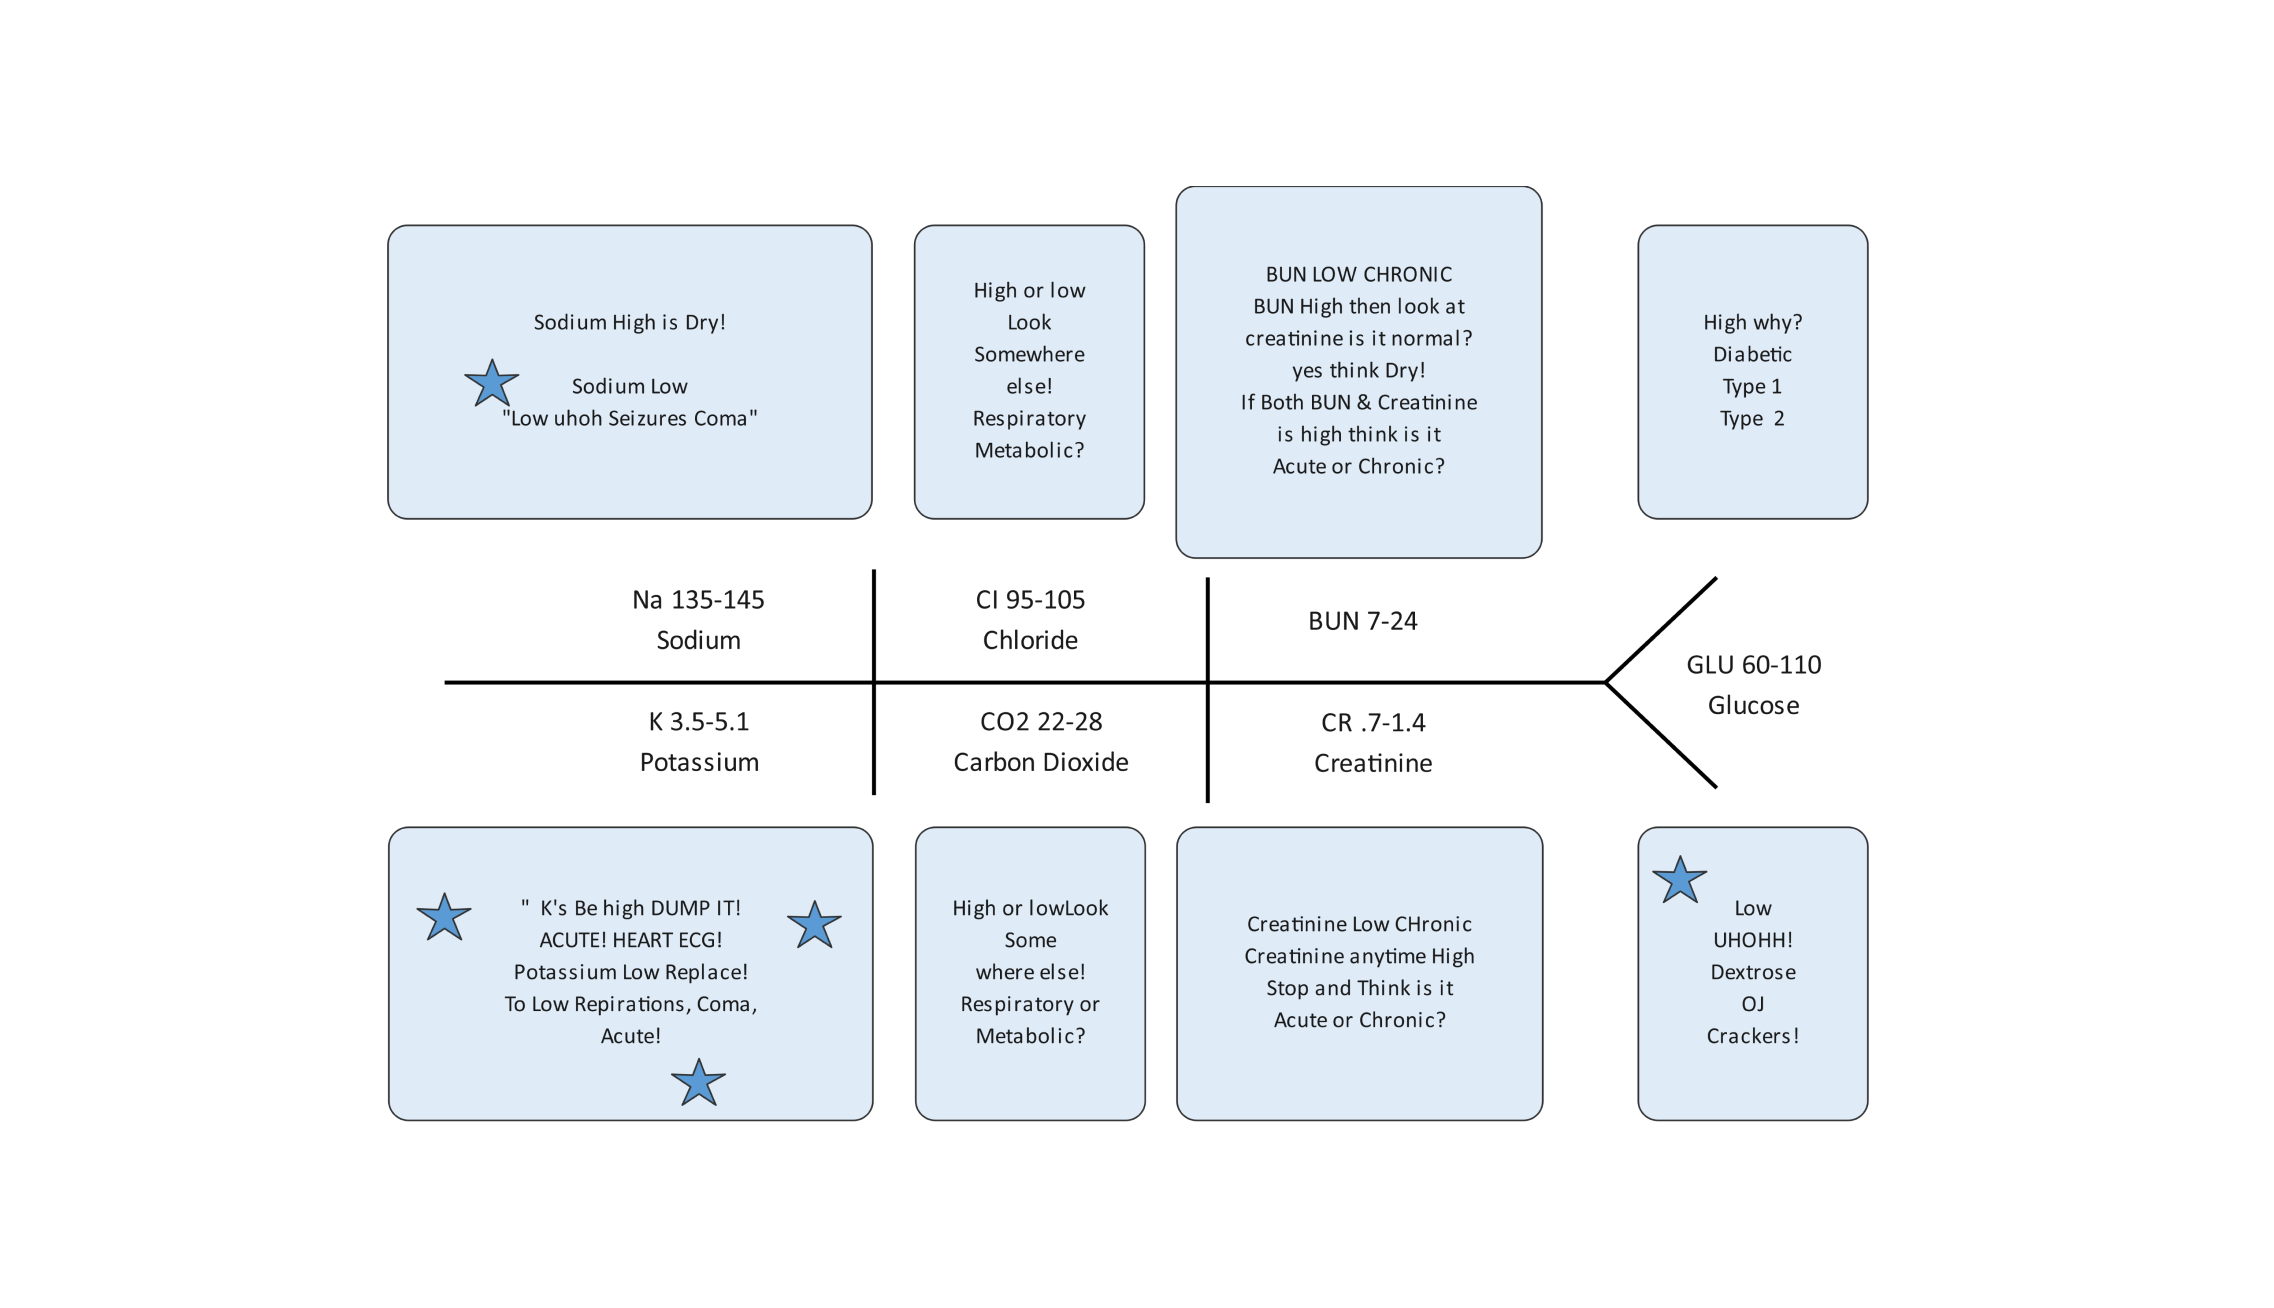
- Laboratory shorthand: the electrolyte, CMP, and lab examples use a fishbone-like arrangement for laboratory information. They serve a different purpose from root cause analysis.
Laboratory examples are illustrative learning layouts. Verify units and reference intervals against the reporting laboratory; sample ranges or notes should not guide diagnosis or treatment.
Customize a Cause-and-Effect Template
- Open a suitable template and replace its example problem with a specific, observable effect.
- Rename the major branches for your process and add possible causes and sub-causes under each category.
- Review the suggestions with the people who know the process. Prioritize causes to investigate using observations or data rather than treating every branch as a confirmed root cause.
- Revise the diagram as evidence emerges, then save the editable copy and share an available export for review.
Get started with EdrawMax today
Create 210 types of diagrams online for free.
Free Download Free Download Draw a diagram free Draw a diagram free Draw a diagram free (AI & Web)