In project management, efficient planning and scheduling are essential for successful execution. One of the critical tools that aid project managers in visualizing and organizing project activities is the arrow diagram, also known as the activity network diagram.
This graphical representation allows project managers to understand the sequence of tasks, identify critical paths, allocate resources effectively, and ensure timely project completion. In this article, you will explore what arrow diagrams are, their components, their benefits, and how to create them.
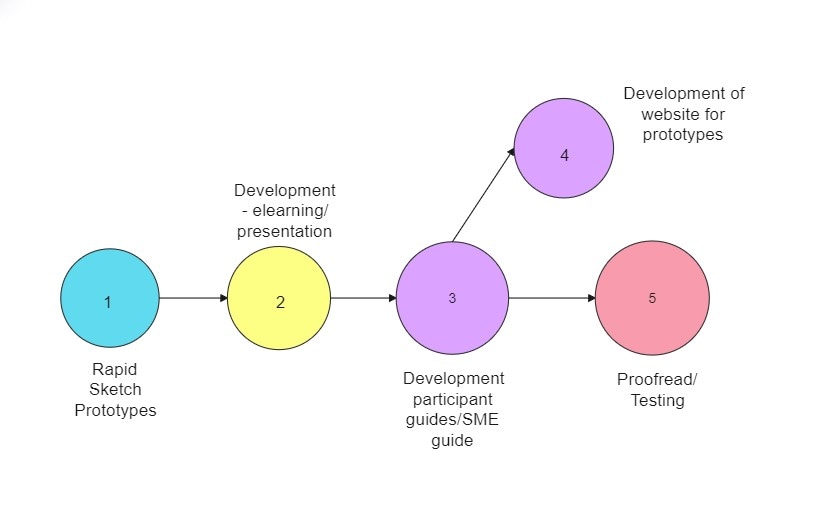
Part 1. What Is an Arrow Diagram?
An arrow or activity network diagram shows how project activities relate. It reveals the order tasks must follow for successful completion. The arrow diagram helps managers plan and execute projects effectively.
Components of an Arrow Diagram
Arrow diagrams have different parts that show how projects should flow:
Nodes Events: Nodes are the essential points or milestones in the project, represented by circles or rectangles. Each has an activity number or name and marks the completion of specific tasks. Nodes in an arrow diagram are essential points to reach.
Arrows Activities: In the diagram, arrows show tasks and their order. Arrows connect two nodes, indicating workflow. If Activity A must finish before Activity B starts, the arrow goes from A to B.
Time Estimates: In arrow diagrams, time estimates are vital. Each activity gets an estimated time to finish, helping managers plan the project duration.
Float or Slack: Activities not on the critical path have float or slack time, representing the time they can delay without affecting the project's overall duration. Float allows for flexibility in scheduling non-critical activities.
How To Make an Arrow Diagram?
Here's a guide on how to create an arrow diagram:
- List Activities and Dependencies
Start by listing all the activities involved in your project. Identify the dependencies between activities, i.e., which tasks must be completed before others can begin.
- Define Nodes
Represent each activity with a node (circle or rectangle). The first activity's node will be the project's starting point, and the last node will be the project's endpoint.
- Draw Arrows
Draw arrows to connect the nodes based on the dependencies you identified. The direction of the arrows should indicate the flow of work from the start to the finish.
- Time Estimation
Assign time estimates to each activity, representing how long it will take to complete them. This information will be helpful in critical path analysis and project scheduling.
As you can see, creating arrow diagrams can be a valuable skill for project managers. However, you don't need to stress over drawing on paper when there are easier methods. You can create the arrow diagram by using project management software templates or drawing tools. It can make it easier to modify and collaborate with team members.
Part 2. Edible Arrow Diagram Examples
In this part, you'll learn how project managers use arrow diagram templates for better planning. These examples are time-savers for making visually engaging arrow diagrams and flowcharts. Since there's no perfect style for an arrow diagram, let's see what project managers can achieve with these templates.
Arrow Diagram Template for Timeline
This linear arrow flow chart has space to add dates on the top half and activities on the bottom half of the arrows. It's perfect for visualizing project schedules and deadlines. You can use this flow chart with an arrow template to plan simple project timelines and identify milestones.
Arrow Diagram Template for Process Cycle
You can use this arrow diagram for projects with recurring processes or cyclical activities. The different colors for arrows help you illustrate various stages and branches. By doing so, you and your team can gain insights into each stage's performance and identify areas for improvement or optimization.
Arrow Diagram Template To Show Relationship
This circular arrow diagram features arrows in four colors: purple, yellow, red, and green. In project management, the arrows in the diagram show different connections between activities. It helps project managers understand how team members work together. Sometimes, one circle shape may have two arrows pointing to it from two different circles.
This template helps you find important people in the project, like decision-makers and key team members. It also shows how information flows between them so you can improve team collaboration and communication.
Arrow Diagram Template for Process Sequence
This example is excellent for projects with many subtasks and detailed steps. The arrows in the flowchart show how tasks branch out and come together. In this example, you'll find two shapes: circles and rectangles. This template is excellent for projects with complex steps or phases, such as planning or creating a new product.
Once you've seen the arrow diagram examples, you might be curious about making your own easily. Forget the paper drawings and complicated tools. With intuitive diagramming software, you can focus on the project activities with your team. Stay tuned to discover more about this simple diagramming tool.
Part 3. How To Make an Arrow Diagram Within Minutes?
Now, if you are considering making an arrow diagram yourself, a great way to start might be to try Wondershare EdrawMax, an easy-to-use and powerful tool for creating arrow diagrams. No need to be a tech expert or an artist. You can easily get started with its tons of templates and intuitive interface. Collaborate with your team and make updates easily. Project managers can stay organized, save time, and keep everyone on the same page.

Key Features of EdrawMax
Let's find out how EdrawMax can help you plan, visualize, and collaborate with your team for project management.
- Cross-platform Compatibility
EdrawMax works on Windows, Mac, Linux, Android, and iOS devices. You can even try it online in your web browser.
- AI-powered Diagramming
AI helps you organize information, connect ideas, and give design suggestions to make your arrow diagrams look great.
- Supports Visio and Many Formats
Export your Arrow Diagram in different formats, including JPG, PowerPoint, Visio, and more.
- Group and Ungroup Shapes
Group shapes together to move and resize them as a unit. You can also ungroup them when you want to work on individual shapes.
- Ready-made Templates and Symbol Libraries
EdrawMax offers several templates and symbols to save time and kickstart your arrow diagram.
Step-by-Step Guide to Creating an Arrow Diagram
Follow these steps below to make an arrow diagram in no time:
Step 1: Go to Wondershare EdrawMax's official website and click to download the app on your desktop.
Step 2: Launch the app and click Start Now. Create an account or log in to your Wondershare ID.
Step 3: Click the Basic dropdown menu in the left-side navigation pane.
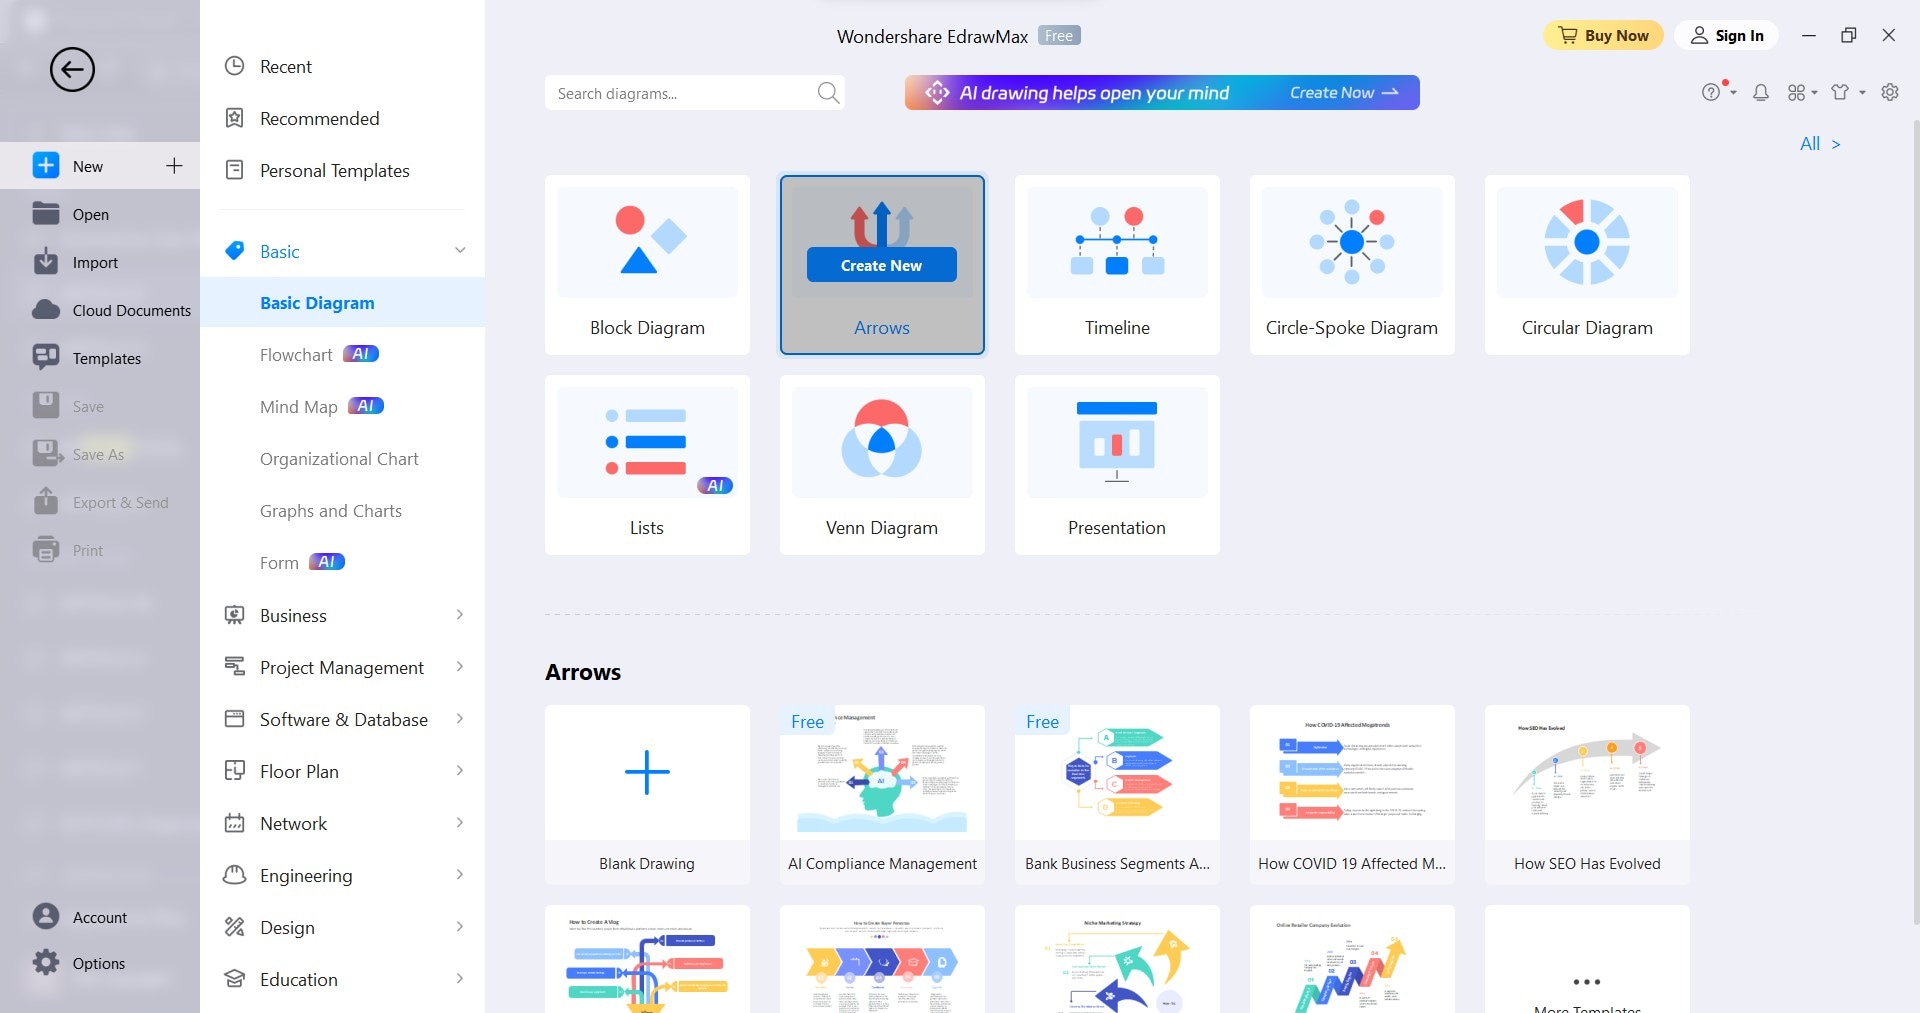
Step 4: Click Basic Diagram and select Arrows. Next, click Create New to get started. You can also use the arrow diagram templates in the Arrows section below.
Step 5: Customize the arrow diagram.
- Add Arrow Shapes: Click the Arrow Shapes dropdown menu in the left-side navigation pane, then drag and drop the selected shape onto the canvas.
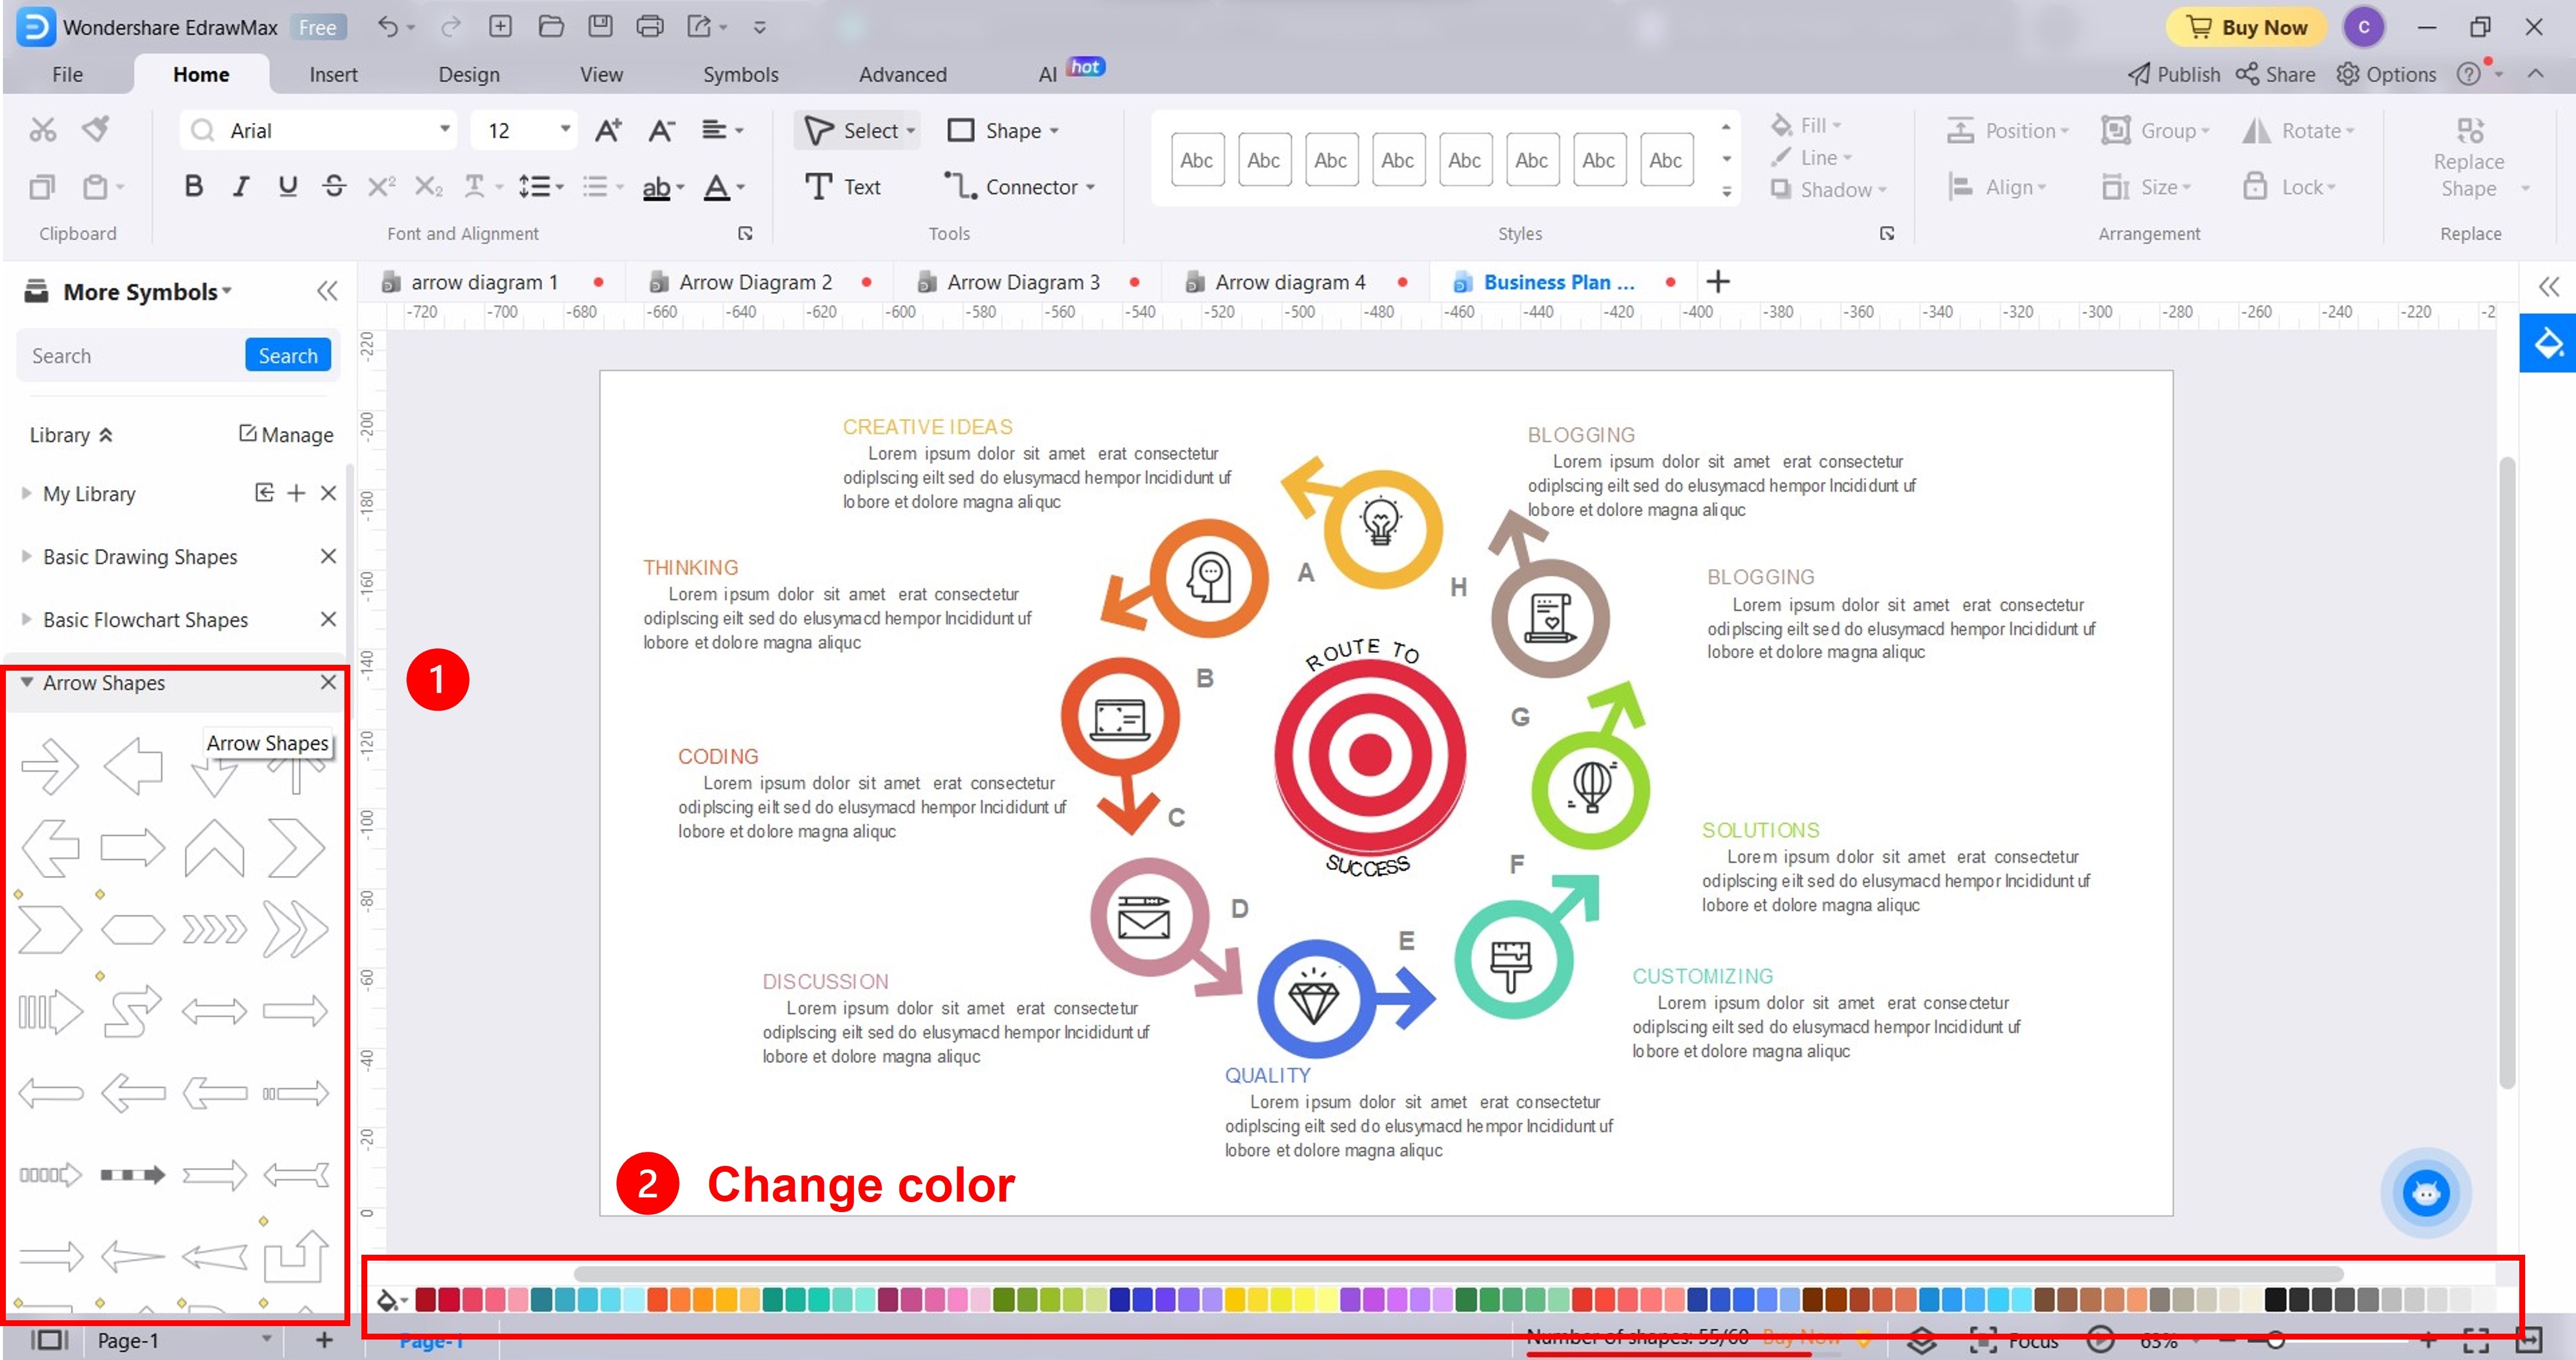
- Change Shape Color: Select the element in the canvas. Then, select a color from the color palette in the lower navigation pane.
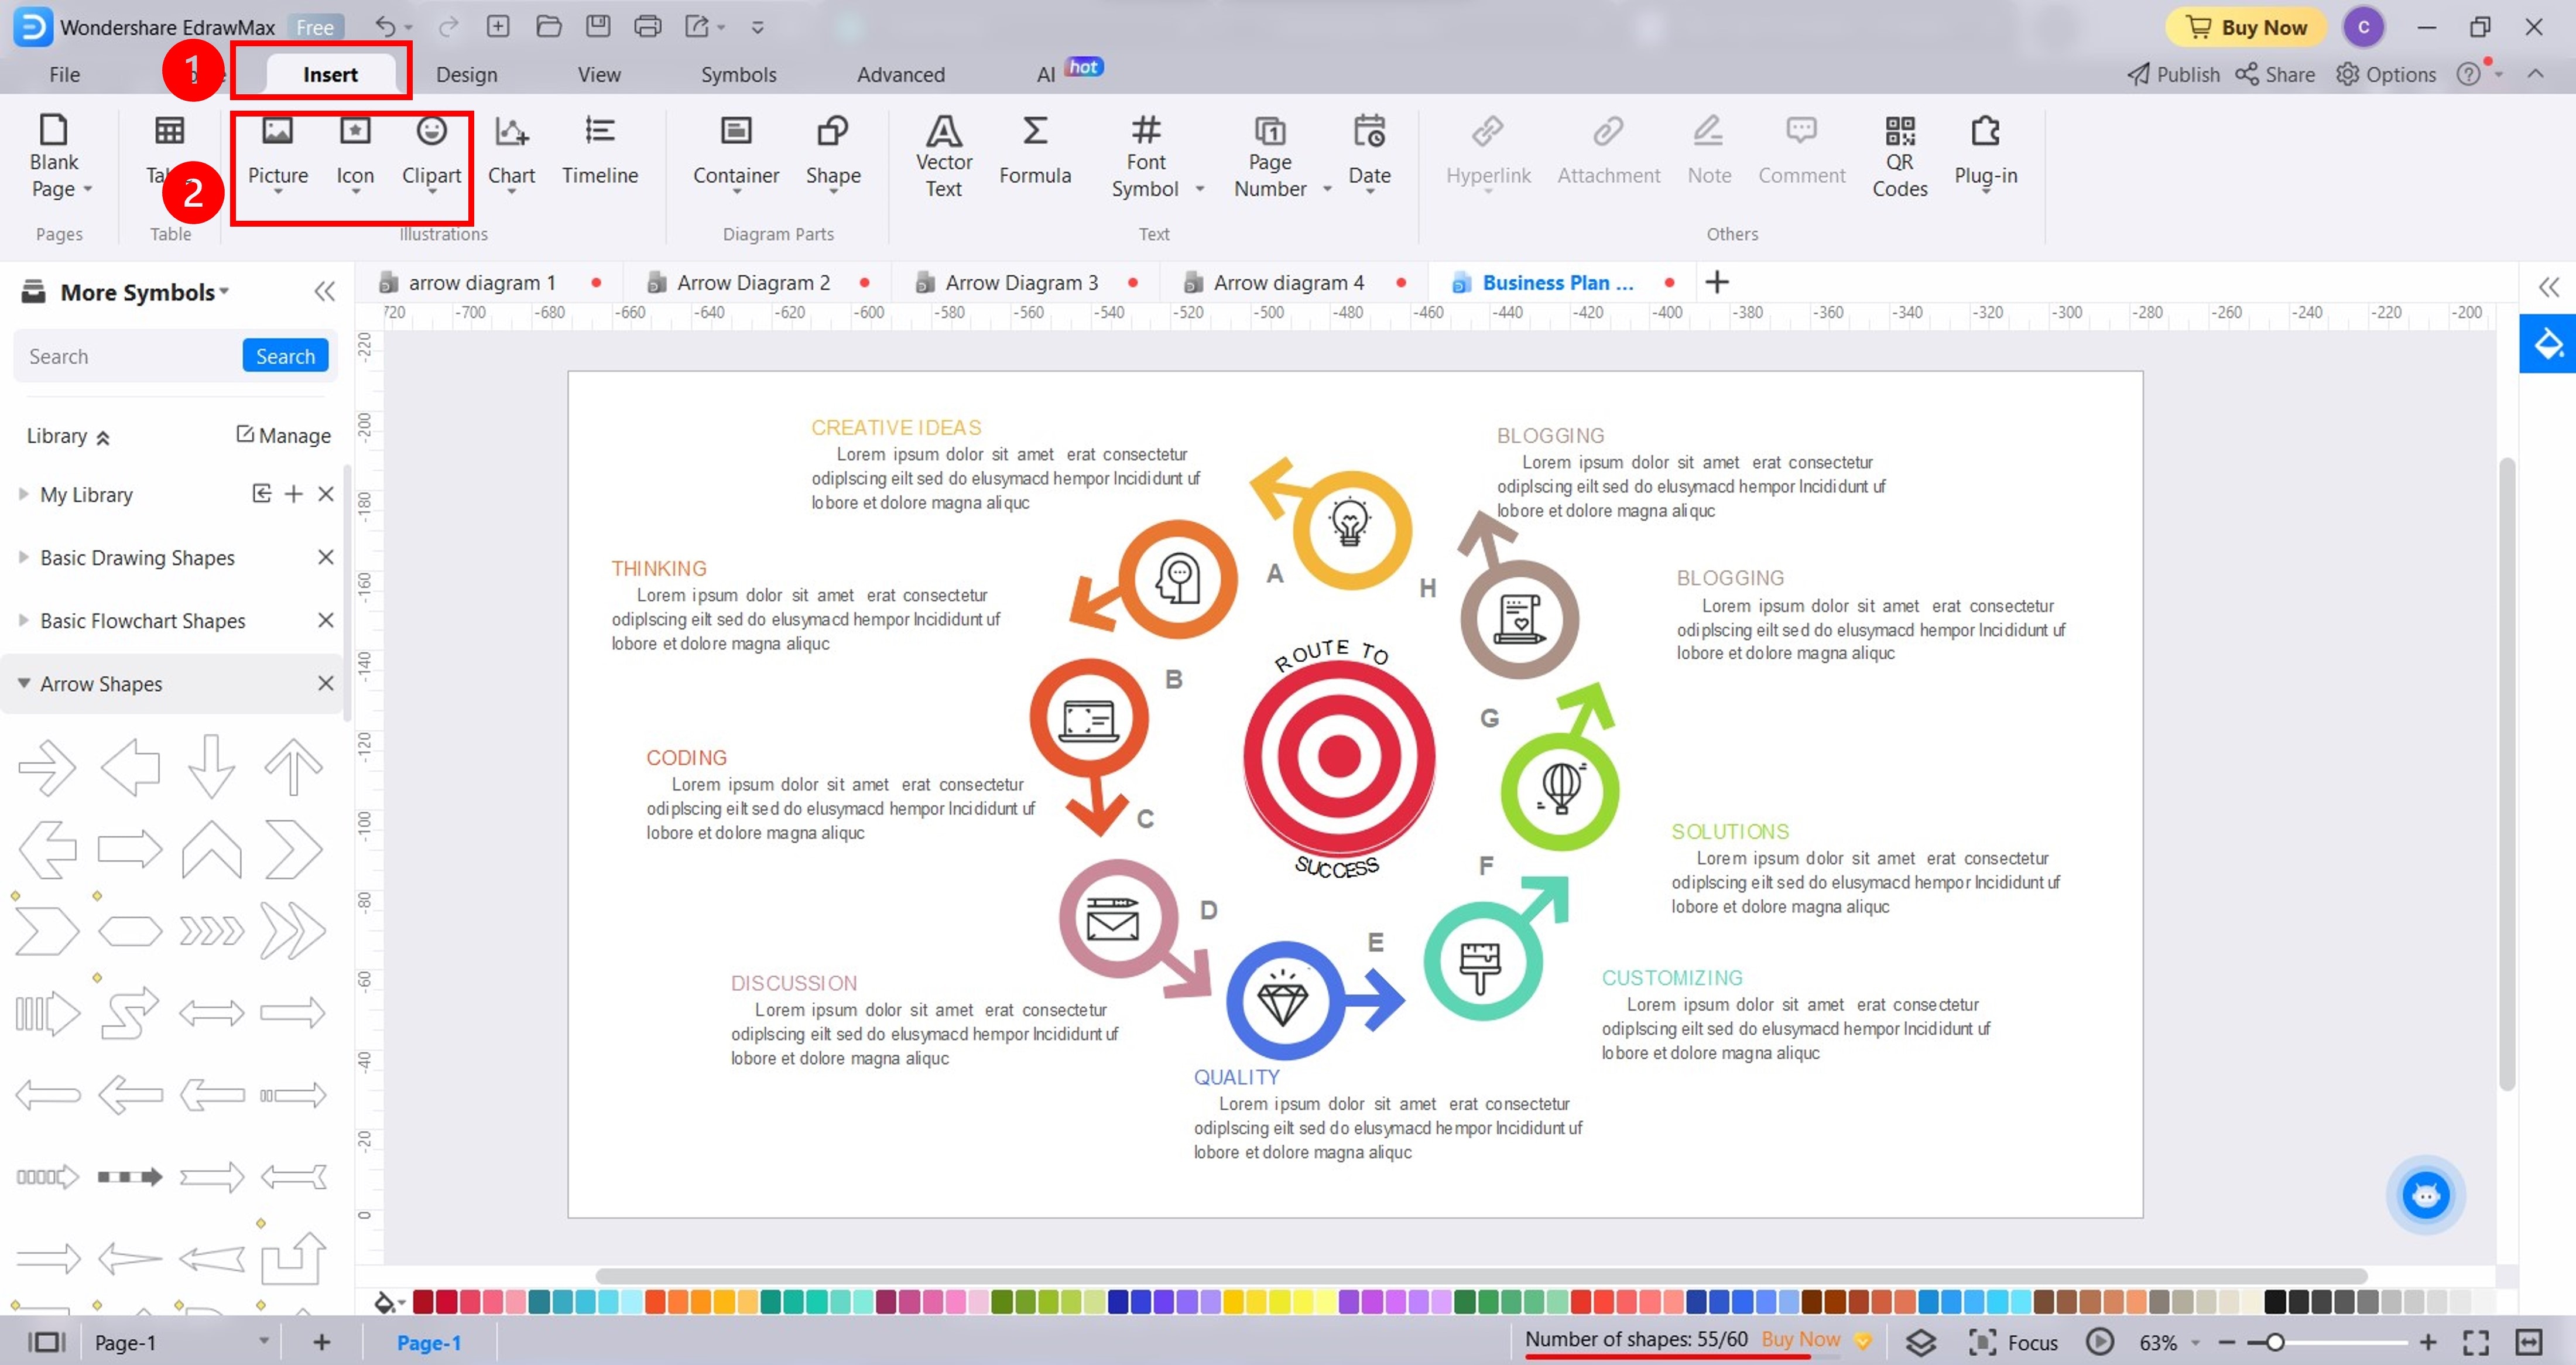
- Insert Illustrations: From the upper navigation pane, go to Insert, then click the Picture, Icon, or Clipart dropdown list.
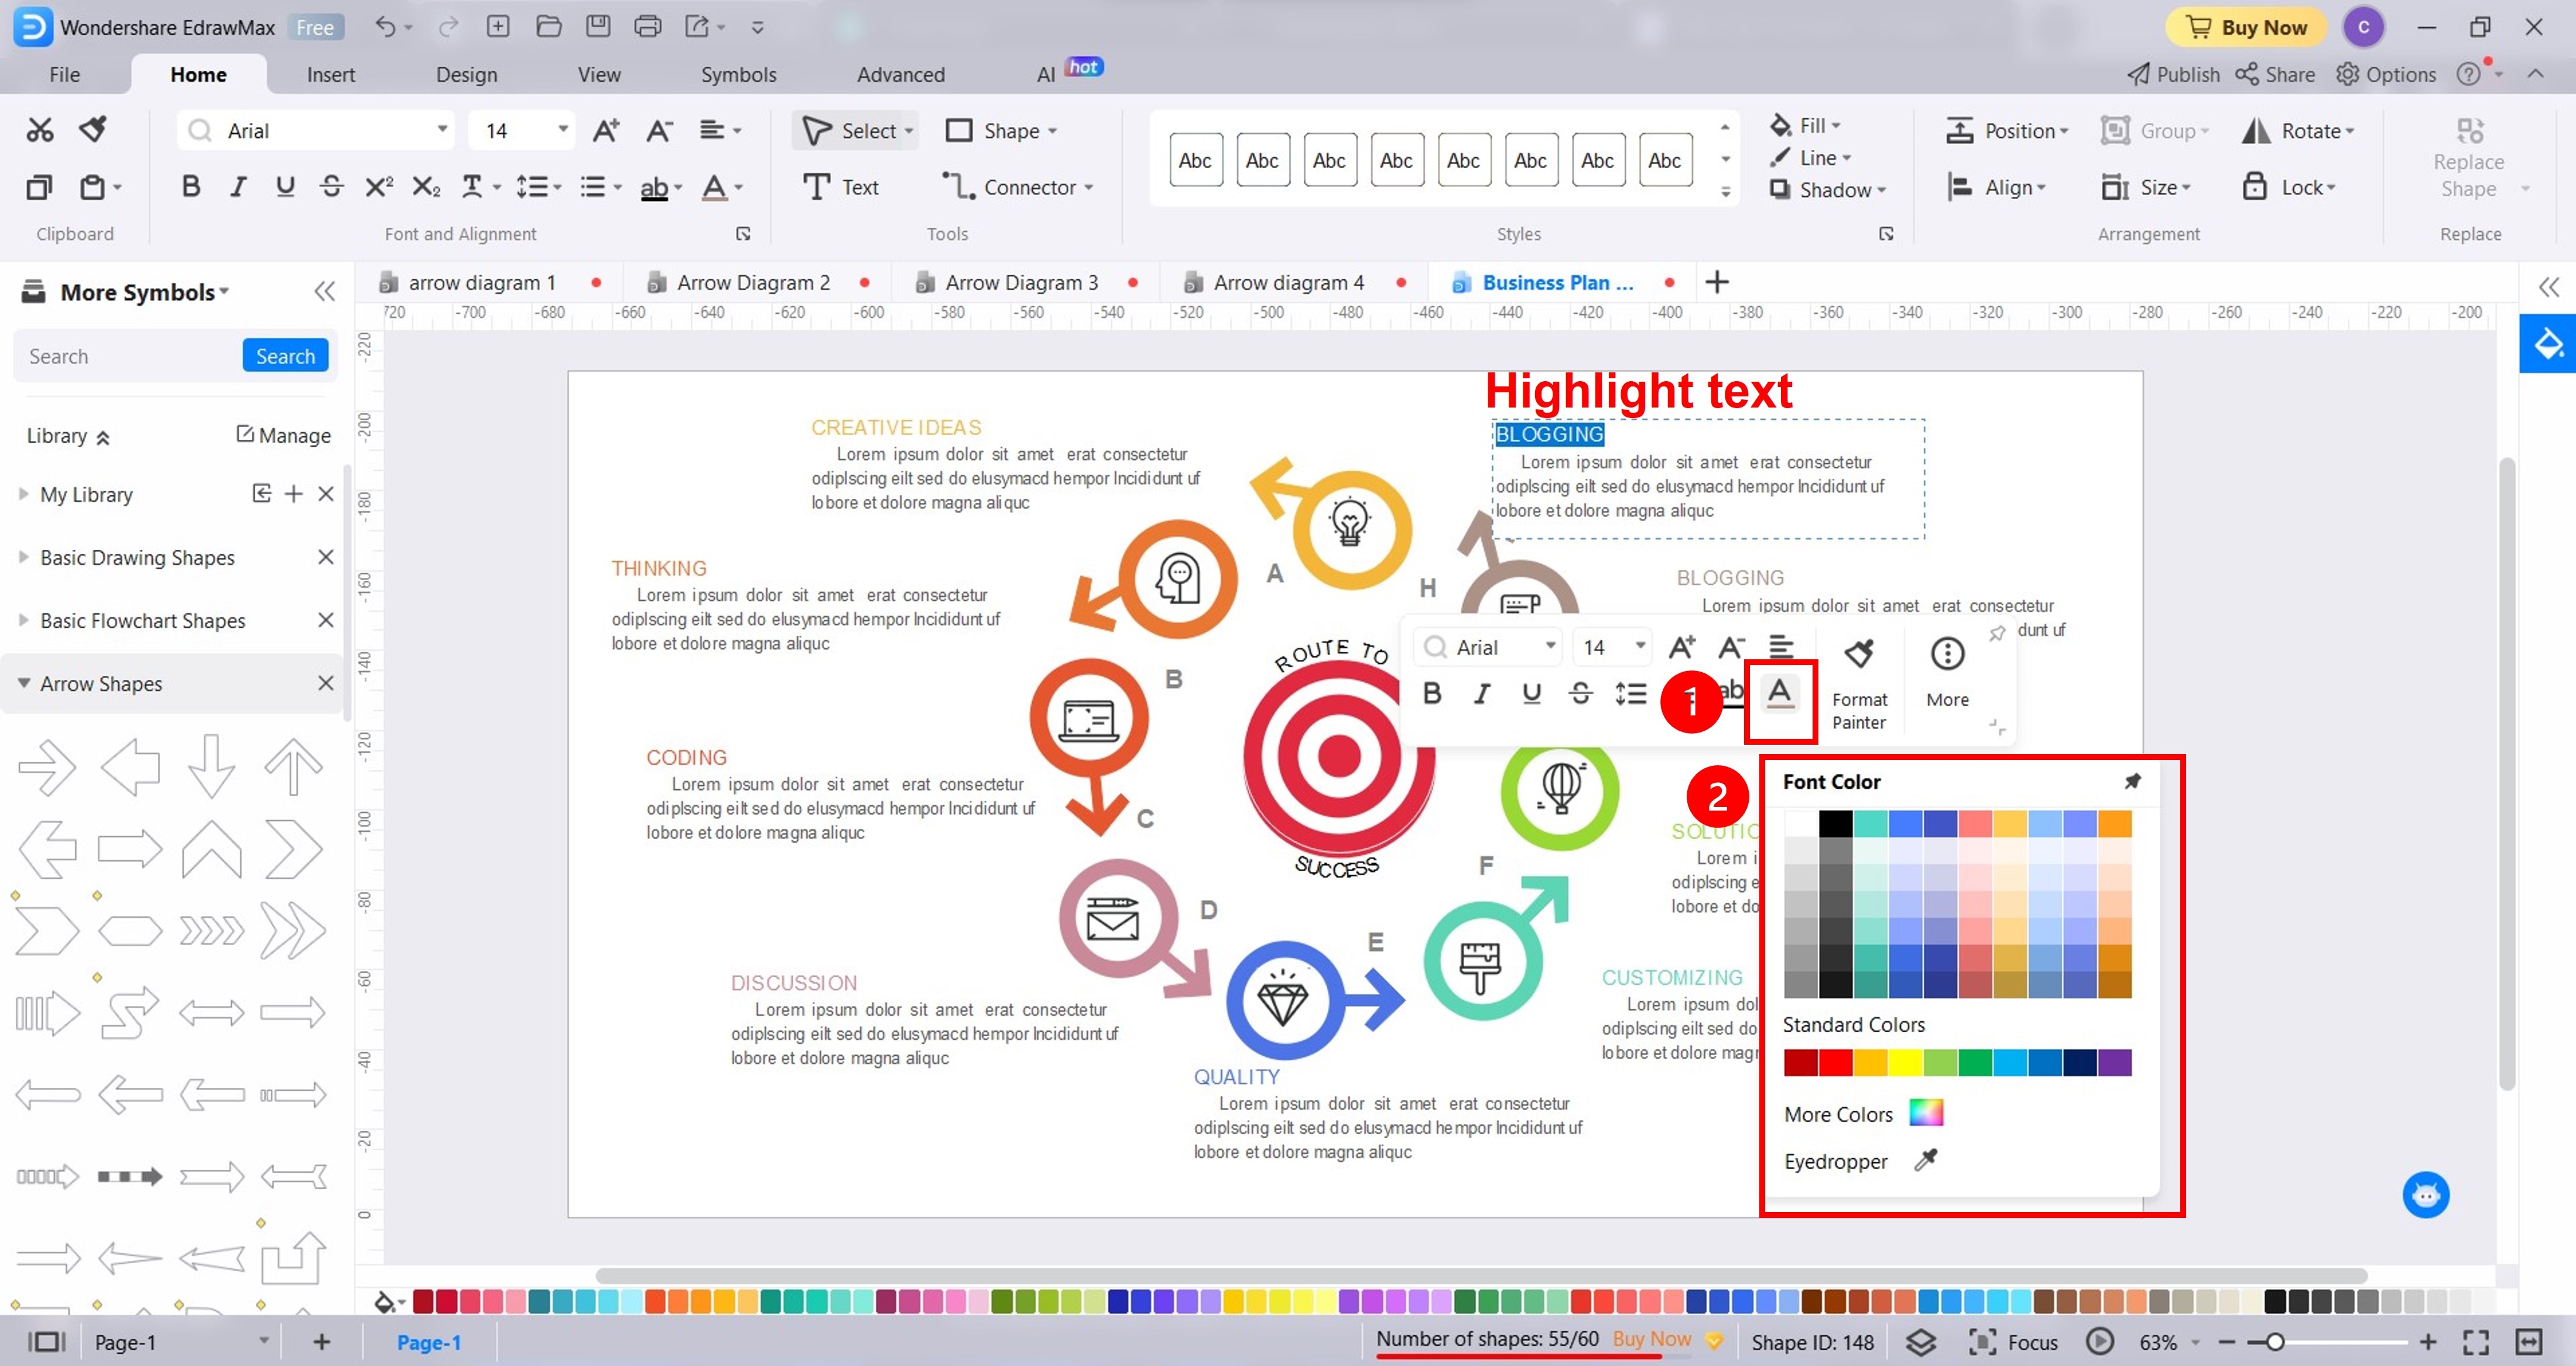
- Change Font Color: Highlight the text you want to change. Then, click the font color icon in the floating toolbar and select a color from the Font Color menu.
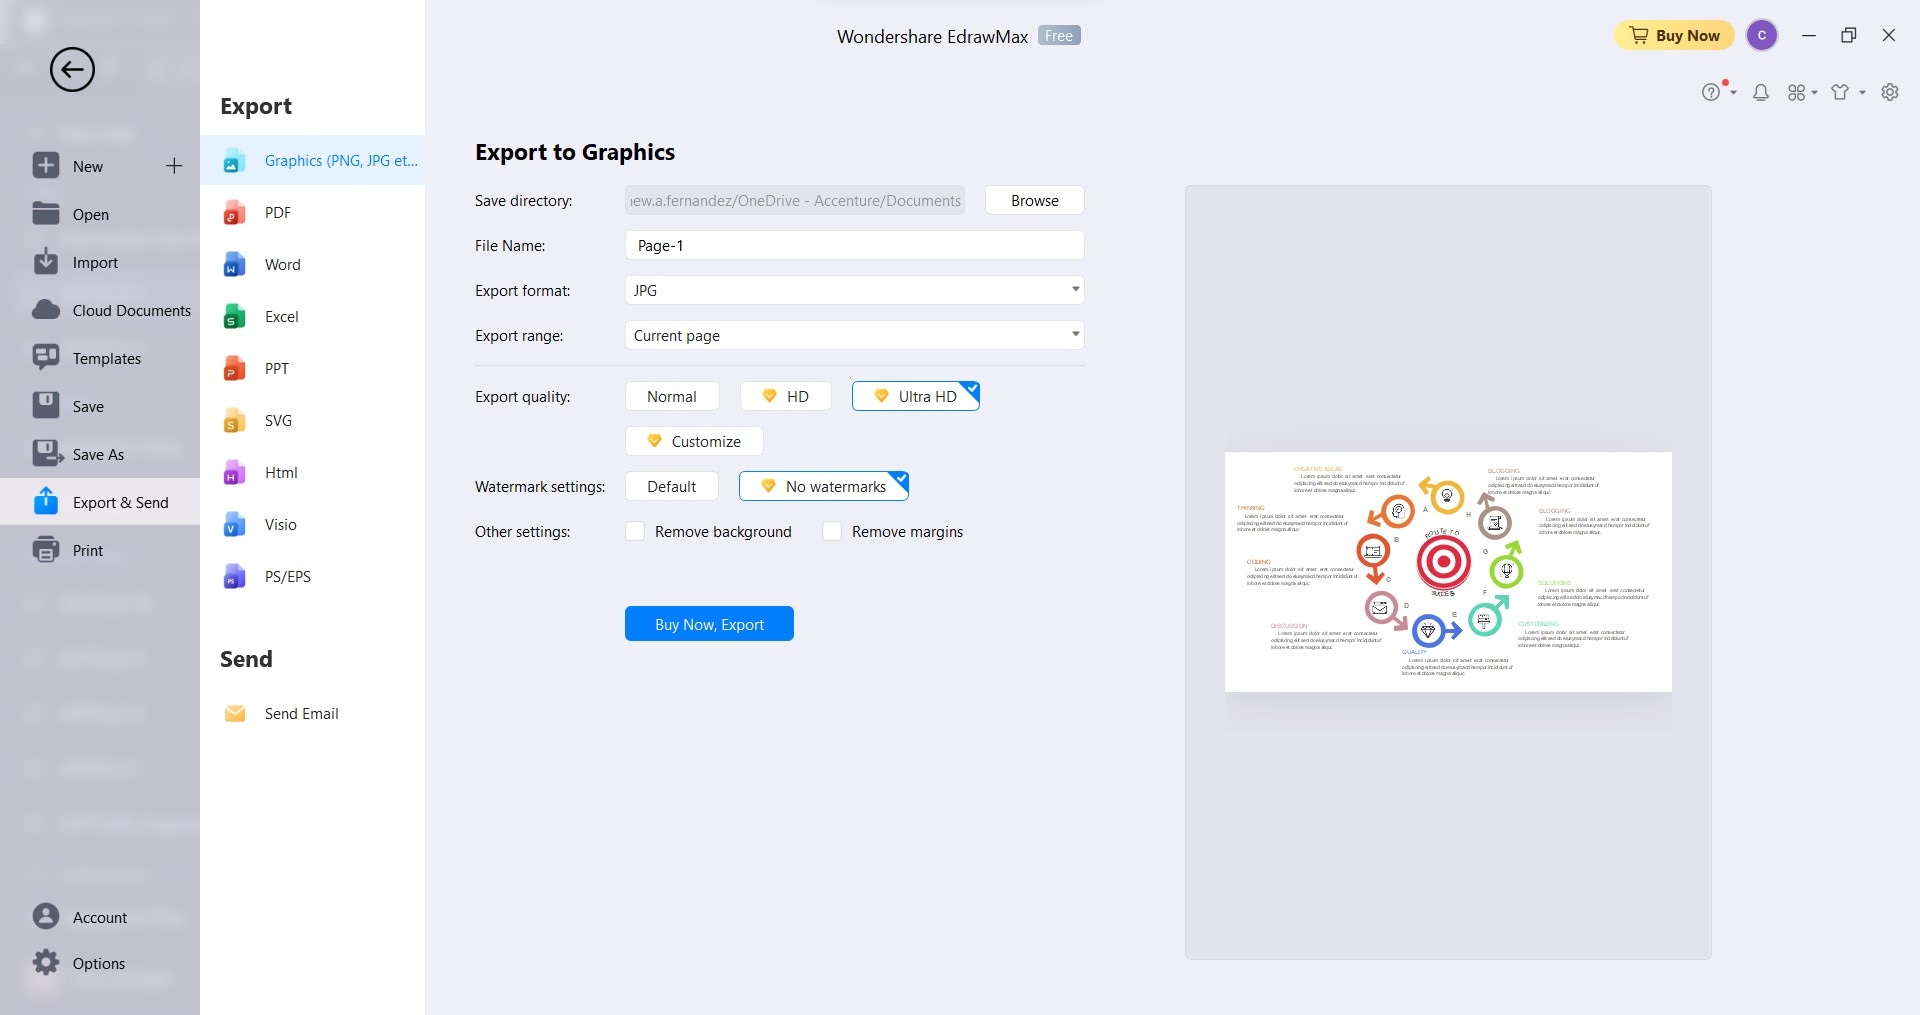
Step 6: When done, click File in the upper navigation pane. Then, click Export & Send in the left-side navigation pane and select the format you prefer.
Part 4. Benefits of Arrow Diagrams in Project Management
Arrow diagrams show the project managers the best way to do tasks in a project so teams can finish on time. It plays a crucial role in project management for several reasons:
Visual Representation
An arrow diagram helps you understand the right order for activities and how they depend on each other. It also helps project teams quickly understand the project's complexities. An arrow diagram helps improve communication and coordination among everyone involved in the project.
Resource Allocation
Understanding the sequence and interdependencies of tasks helps in allocating resources. You can split resources to complete the most work and minimize idle time.
Timeline Management
You can identify tasks that can be fast-tracked or delayed without affecting the project duration. This flexibility allows for better adaptation to changing project conditions.

Critical Path Analysis
Arrow diagrams show the longest sequence of activities, so you know which tasks are time-sensitive. It helps you find the project's critical path, which impacts the project's timing and where adding resources can make it faster.
Risk Management
You can identify areas that may cause delays with an arrow diagram and implement strategies to mitigate these risks. It allows for efficient task sequencing to avoid bottlenecks and delays.
Conclusion
Arrow diagrams are an excellent tool for project managers. They visually show complex relationships and help analyze critical paths in projects. Arrow diagrams also assist businesses with resource optimization. For smooth diagram creation, try EdrawMax. With its user-friendly interface and ready-made templates, EdrawMax makes it simple to see project tasks and complete them as planned.


 below.


