


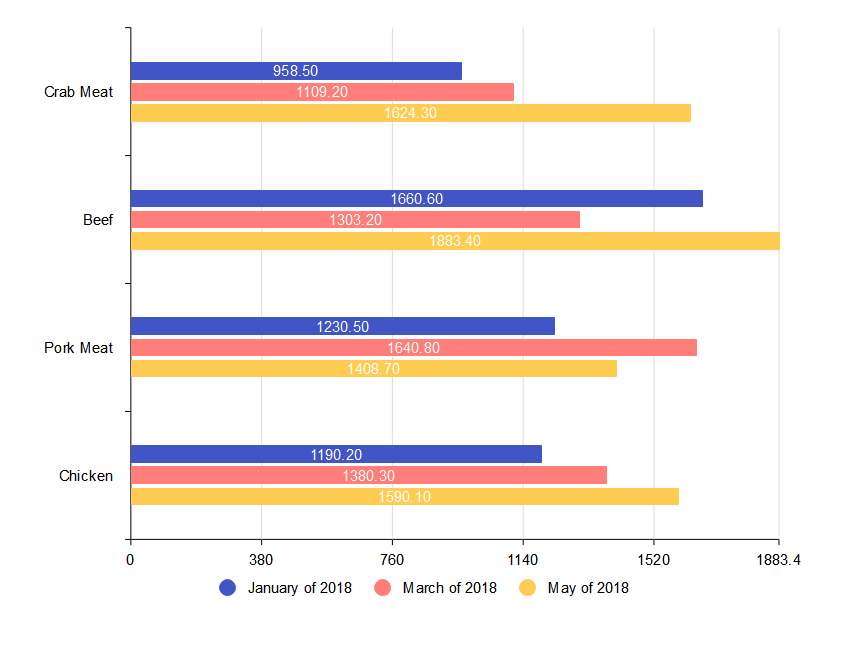
Bar graphs are commonly used to visually represent data and are known for their simplicity in both creation and comprehension. They are handy for comparing specific values across different data categories. Still, sometimes it could be challenging for a beginner to create a bar chart in a common tool like Excel. In this guide, we will show you how to create a bar graph in Excel, ensuring that even if you're new to the task, you'll be able to create a bar graph with ease.
But in case you need to make professional bar graphs while Excel is not a dedicated diagram maker, give our product EdrawMax a try. It features powerful functions and an intuitive interface, suitable for both pros and starters.
Part I. How To Make a Bar Chart in Excel
You can quickly determine the result from your data set by using bar graphs in Excel. For instance, a bar graph allows the viewers of a presentation or readers of a spreadsheet to more effectively break down the data. Here's a step-by-step guide:
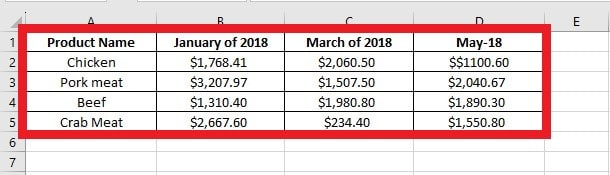
Step1Add Data
Before making a bar chart, input your data in Excel. Add and choose the data for the bar graph, then copy it to your clipboard.
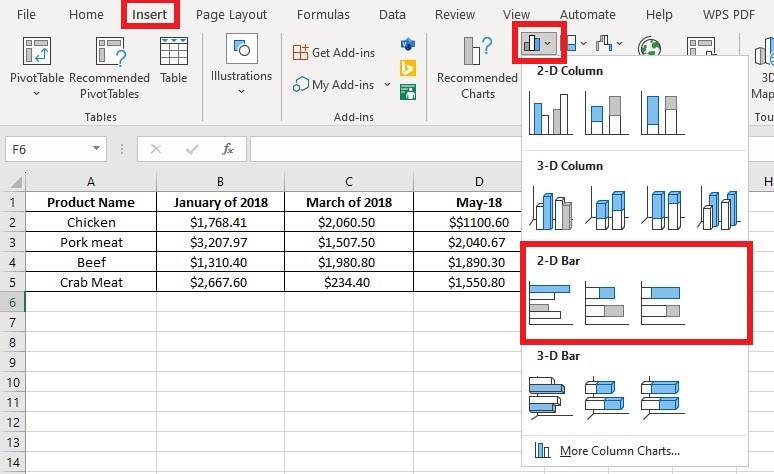
Step2Create Your Bar Chart
Include a bar chart into the spreadsheet after picking data. To do so, go to the Excel ribbon's Insert tab and pick Bar Chart from the chart selections.
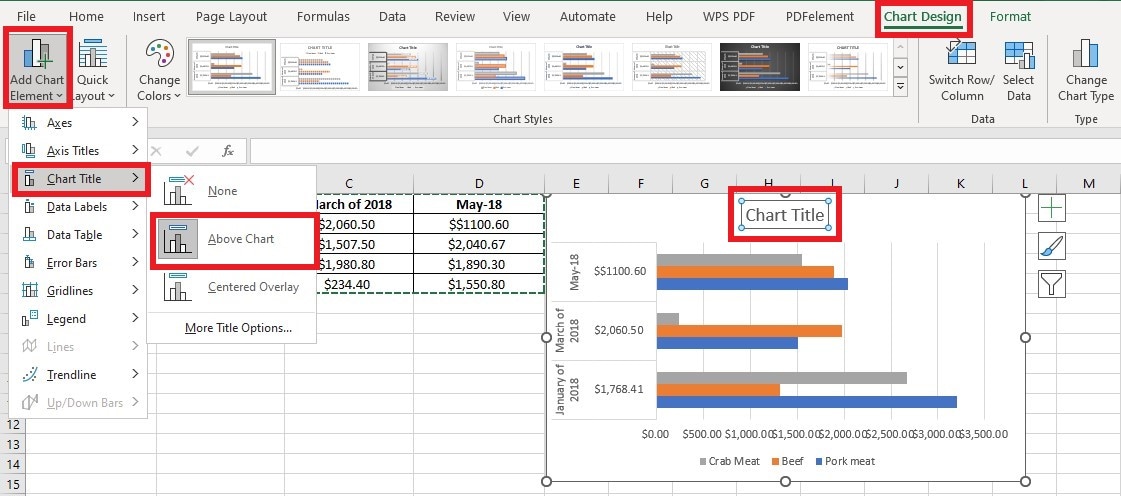
Step3Format Your Bar Chart
You may add a "title" and a "legend" to your bar chart to make it more informative. Go to Chart Design > Add Chart Element > Chart Title. From there, either choose Above Chart or Centered Overlay.
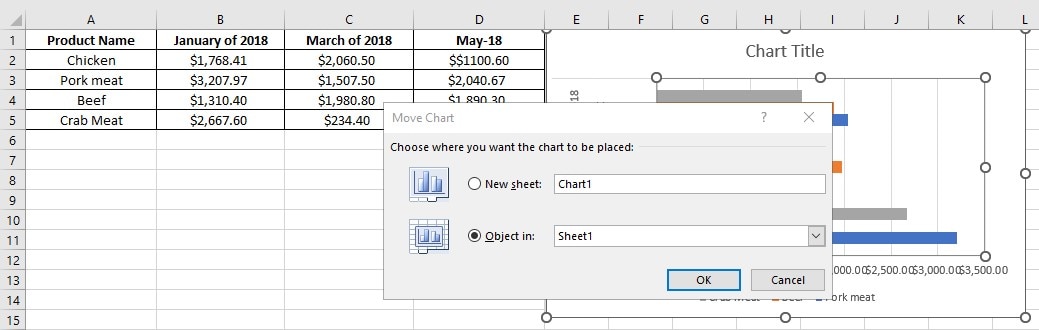
Step4Move Your Bar Chart
In Excel, you may quickly relocate a chart. To do this, start by clicking and dragging inside the chart's Chart Area to relocate it within a worksheet. When you move the chart, the mouse cursor appears as a four-pointed arrow. Release the mouse button when the chart is at the desired area to drop it into its new worksheet location.
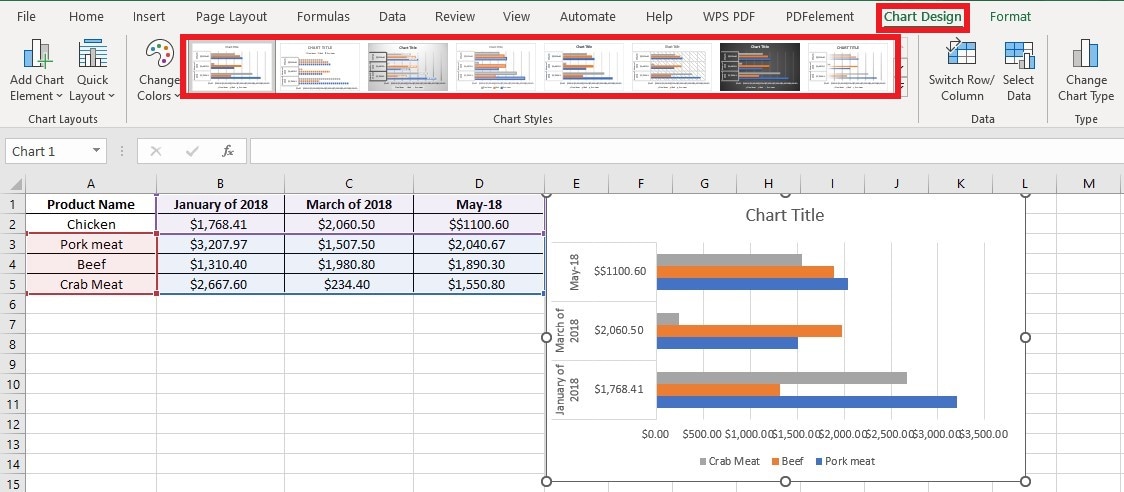
Step5Change Chart Type
Customize the bar chart to fit your needs. To do this, click the chart to choose it, use the options in the Chart Design and Format tabs on the ribbon. You may activate Data Labels and select a layout choice from the easy-access Chart Elements menu.
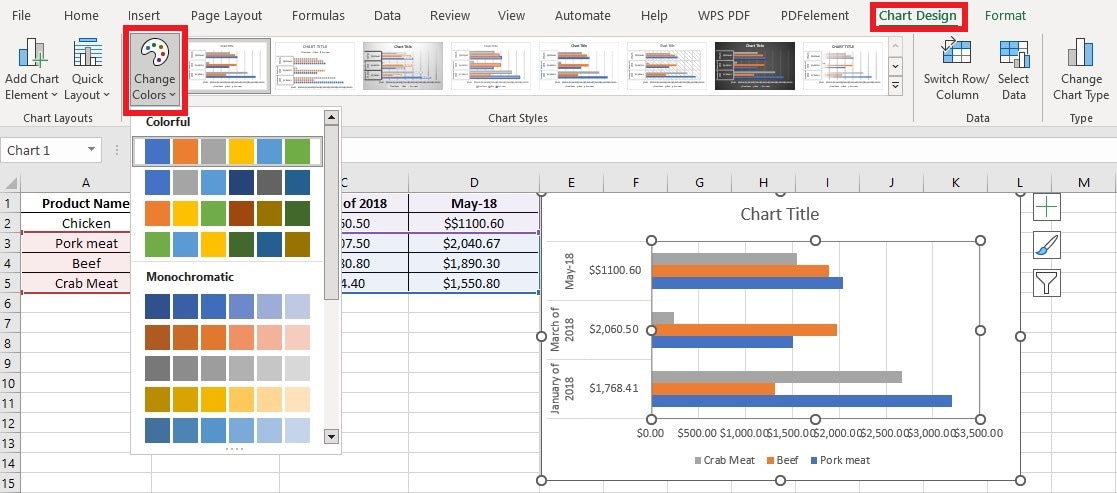
You can also set the color scheme using the quick access Chart Styles, and select your desired chart style.
Part II. Creating a Bar Chart in EdrawMax: Easier and Faster
Although Excel is a widely used tool, it may not be powerful enough to meet your needs if you want to make a professional bar chart. In that case, consider a dedicated diagram maker like EdrawMax. With its over 15,000 templates and intuitive interface, even diagramming beginners can quickly get started. Furthermore, EdrawMax offers an online version that you can try for free, saving you the hassle of downloading a large file.
Another great feature of EdrawMax is its sharing system, where the files can be edited or exported and downloaded online. The charts created with this free bar chart creator may be exported in a variety of formats, including Graphics, MS Office, Visio, and more. In addition, by utilizing the Presentation Mode, you may share your bar charts with your friends on social networking sites or just present your charts in front of people.
Here are EdrawMax’s ratings and some of its key features:
Compatibility: Windows, Mac, and Linux
G2 Rating: 4.3/5
Key Features
Rich Templates: Access to online templates speeds up design development and procedures, enhancing productivity.
Simple Customization: With its sleek and intuitive interface and drag-and-drop functionality, Edrawmax is easy to use for both pros and beginners.
Cross-Platform interoperability: The software's interoperability with Linux, Windows, Mac, and mobile terminals provides a smooth transition and integration between devices.
Export Format Choices: Its multi-format export choices allow customers to select the best format for their needs.
Part III. How to Create a Bar Chart with EdrawMax
Step1Create a File
Download, install, and open EdrawMax. Log in with your Wondershare ID or an account of Google, Twitter or Facebook.

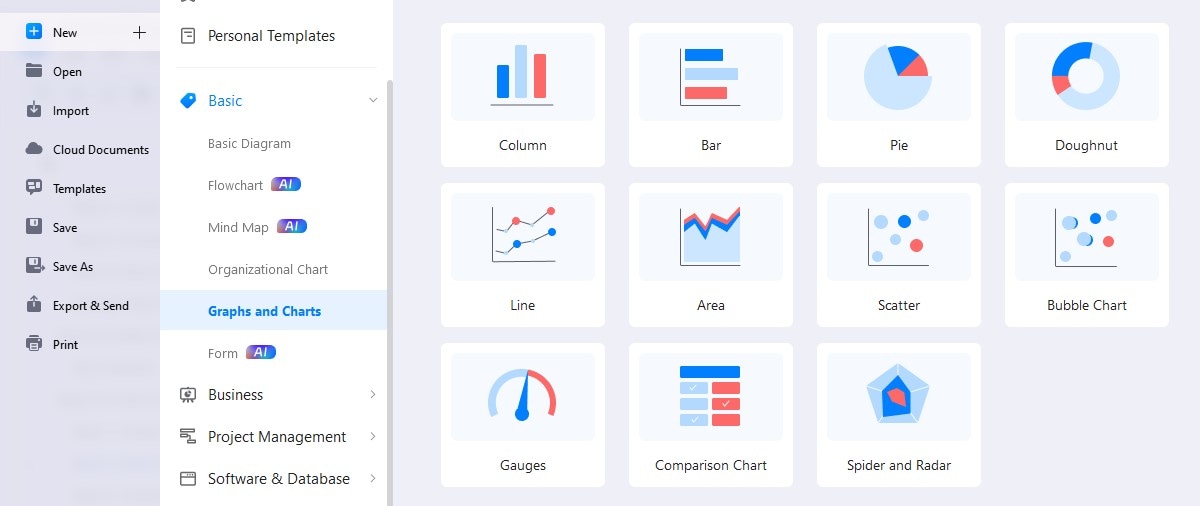
Step2Select a Template
Go to File > New > Graphs and Charts > Bar. Choose a built-in template or go to Templates, input "bar chart", and choose a user-generated bar chart.
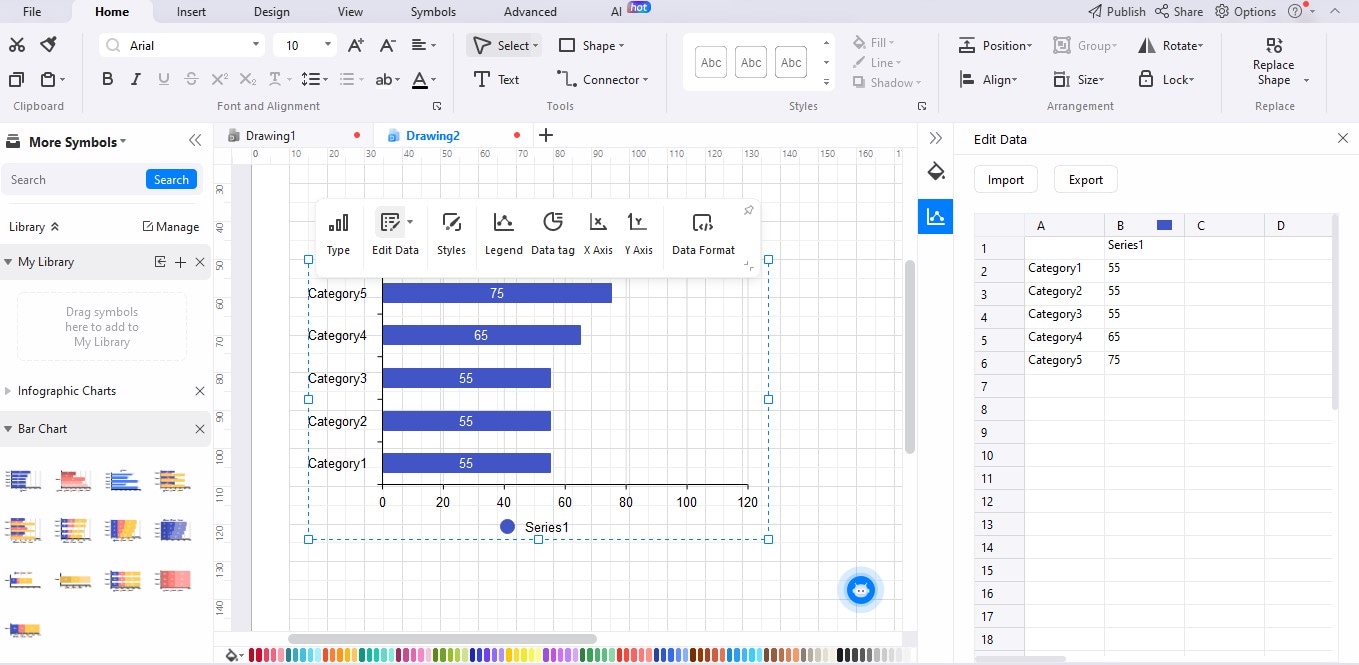
Step3Customize the Template
Manually enter data into the sheet on the right side, and the graph will alter its form accordingly. Customize your bar graph by changing the color of the bars and adding any number of rows and columns.
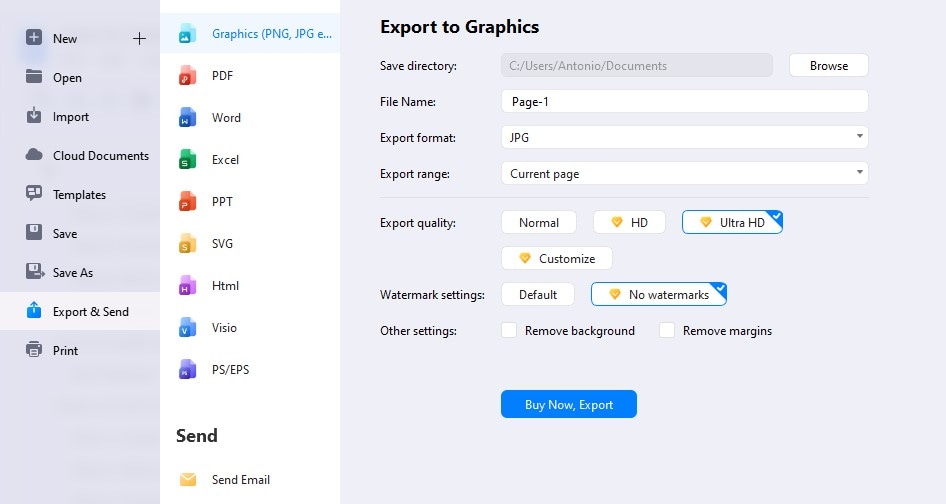
Step4Export and Share
When you finish the bar chart, save and export it as graphics (JPG, PNG), PDF, editable MS Office file format, SVG, or Visio file format. Go to Files, then click Export & Send. After that, choose the appropriate type of file you need.
Conclusion
A bar chart is a useful visual tool for comparing and presenting data across different categories or subgroups. Excel is the first application most people can think of. However, in some cases, you might want to try a dedicated diagram maker like EdrawMax. With its intuitive interface and a large number of popular templates, creating a bar chart will be easier than you think.
AI Diagram Generator
Enter your prompt. Upload files if needed. Generate diagrams, charts, or slides instantly.


