


Financial analysis has been the best approach in every business that is dependent on keeping track of incoming and outgoing transactions during the project, quarterly, biannually, or yearly basis. Initial investment, resource management costs, maintenance expenditures, anticipated budget scheduling, employees' wages, return on investment, and profit & loss are all included in monetary transactions.
To manage all these cash inflows and outflows, project & business managers exploit the cash flow diagram not only to highlight economic vicissitudes but also to track overall business progress. This article will impart insight into how you can create cash flow charts in Excel without investing extraordinary time & effort.
1. Overview of The Cash Flow Graph
Cash flow charts are diagrams visually representing the influx and outflux of money in a business realm, whether evaluating the cash flow in project management & execution, analyzing the past-year financial performance, or calculating the overall revenue. Such diagrams are also instrumental in establishing a well-organized financial future action plan to estimate the cost of various resources involved, equipment salvage, and the expected output from the project.
Cash Flow Diagram Example
Consider an example of a lorry purchased with $55,000, and its yearly fuel & maintenance cost is $9,500. Its engine is going to be replaced after 6 years at $22,000; if all these values are given, we can calculate the salvage value of the lorry acquired over the course of 9 years.

Formation Rules
Creating a cash flow diagram necessitates following some general rules that assist the viewers in understanding its mechanizing patterns. Here are some salient attributes essential to mention in a cash flow chart in Excel:
- The first attribute that is mandatory to mention in a cash flow diagram is the magnitude of the transaction; it is further dependent on two factors: cash flow orientation and the value of the US Dollar in that particular interval.
- The next parameter exploited in a cash flow chart is the time involved in that transaction; the time interval can be mentioned via exact date, or with monthly, quarterly, semi-annual, or annual frequency.
- Time is represented along a horizontal axis, and the unit of time interval involved decides the nature of the project or transaction.
- The financial gains, such as profit, resale values, and return on investment, are represented in positive values (Upward arrows), whereas financial losses, such as disbursements, expenditures, or losses, are represented in negative values (Downward arrows).
- The horizontal thickness of an arrow represents the timing of that specific cash flow; for example, a thicker arrow will denote a cash flow for a longer duration.
2. How To Draw a Cash Flow Chart in Excel?
Microsoft Excel is a powerful platform that is now firmly entrenched in today's digital business world, assisting in evaluating stocks, budgeting, formulating workable financial plans, managing client sale lists, and more. Organizing and sorting data into allusive categories, MS Excel helps business professionals identify commercial trends, compute complex data, and convert it into meaningful worksheets & charts.
Cash flow graph in Excel creation is incredibly straightforward, with a little effort involved in making and organizing your dataset. The detailed procedure for employing MS Excel to make the cash flow diagram is illustrated below:
Step1
Create a proper dataset containing a company or project's transaction-related information by adding the expense magnitude. Also, mention the time span in which the cash flow was made.

Step2
Select the cash flow amount column, click the "Quick Analysis" icon, and choose the "Chart" tab from the menu; select and apply your favorite chart type.

Step3
Another way to create the chart from the given data is to select the data, navigate to the "Insert" option, and choose the preferred chart type from the "Recommended Charts" option.

Step4
The next step is to add the date to the x-axis; right-click the chart, and pick the "Select Data" option from the dropdown.

Step5
Now, navigate to the "Horizontal Axis Labels" option and click the "Edit" button.

Step6
Select the Date column to add it to the chart's horizontal axis, and click "OK."

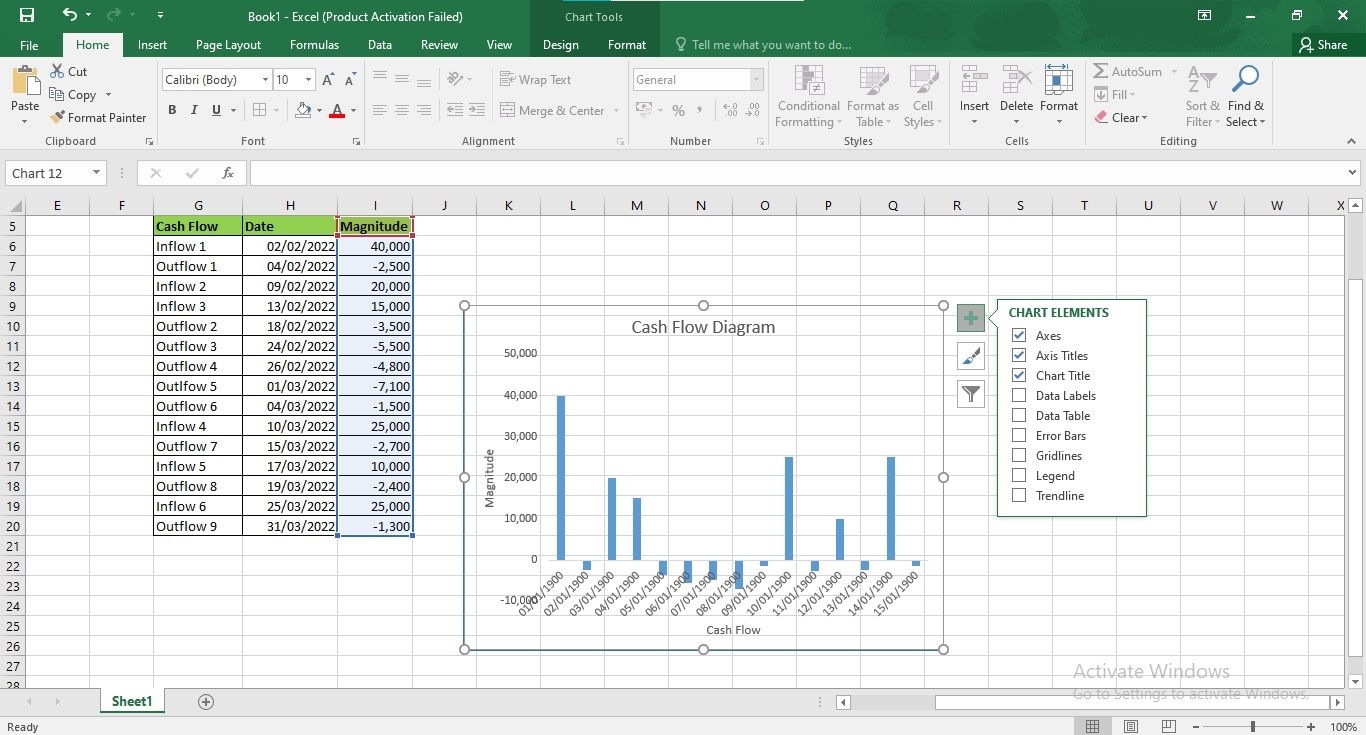
Step7
The next step after completing the chart formation is to format the chart elements; to do so, click the "+" button at the top right and tick the elements you want to include.
Step8
For Excel cash flow chart personalization, navigate to the "Design" option in the main menu, and perform your desirable layout customization.

Step9
If you want to customize the chart elements individually, right-click the chart, and choose the "Format Data Series" option. Now, select and customize your target element by employing the customization options in the right panel.

EdrawMax- The Best Alternative tool to Create a Cash Flow Graph
No doubt, Microsoft Excel provides top-notch services regarding business maintenance, leveraging the users with its smart computing and analytical features, but Excel is primarily a worksheet creation platform that offers diagramming as a part-time solution. To construct appealing and expressive cash flow diagrams, we suggest using EdrawMax, a top-of-the-line solution in the diagramming realm.
With its neuro-inclusive user interface, drag-and-drop functionality, & quick customization options, users can easily create, edit, and personalize cash flow charts.
Additionally, EdrawMax provides extensive integrations with external workspaces, allowing you to import worksheets from several platforms for a convenient cash flow chart creation experience.
Moreover, it offers an AI Flowchart option. This allows us to convert text into a flowchart. All we need is to type in our requirements and EdrawMax AI will give us the best result.
How To Create a Cash Flow Diagram with EdrawMax?
You don't need to reminisce complex formulas or go through intricate dropdowns to customize your cash flow chart; even a beginner-level user can craft a professional chart by performing a few steps. If you want to establish a cash flow diagram in EdrawMax, follow the given procedure:
Step1
Launch the “EdrawMax” application on your device to create a cash flow diagram.
Step2
Navigate to the "New" option in the left panel and choose the "Blank Drawing" tab from the main interface.

Step3
Navigate to the "Insert" tab in the main menu, click the "Chart" option, and select your preferred chart type from the given charts.

Step4
To edit the elements of your cash flow chart, click the "Edit Data" option after clicking the chart once.

Step5
If you want to add more columns to your cash flow chart, add values on the alphabetical cells; in contrast, for adding rows, add elements to the numerical cells.
Step6
Provide an appropriate direction to your cash flow diagram by adding a well-defined title; to add the title, choose the "Text" option under the "Home" menu.

Step7
To define the position of legends, click the "Legend" option present in the customization bar and select your preferred location.

Step8
If you want to quickly change the colors of your columns, click the "Styles" option, and then on the color box of that column. You can also modify the color of each column separately by selecting it and allotting a specific color to it.

Step9
For changing the chart type, click the "Type" option in the customization bar, and choose your desired chart type from the available choices.

Step10
EdrawMax provides integration with MS Excel; thus, if you want to import a dataset from an Excel worksheet, click the "Import" option in the right panel. Similarly, you can export the chart information into the XLSX format by clicking the "Export" option.

Step11
To enhance the visual appeal of your cash flow chart, customize its appearance by navigating to the "Design" tab in the menu; you can select your favorite layout, color scheme, fonts, and background color.

Step12
To add a background picture to your cash flow diagram, click the "Background Picture" option, and select your favorite background theme.

Step13
Click the "Export" icon at the top bar to save your cash flow chart in your desired format.
4. Conclusion
Cash flow diagram Excel is the diagrammatical expression of financial transactions performed within a particular time span. Beneficial in tracking revenues, disbursements, profits, losses, investments, salvages, and overall financial performance, cash flow graph Excel helps you level up your business spirit.
This article contains detailed procedures for creating a cash flow diagram in Excel; additionally, this guide provides a scalable alternative for effortless cash flow chart formation.
AI Diagram Generator
Enter your prompt. Upload files if needed. Generate diagrams, charts, or slides instantly.


