Pit boss PID controller diagram
Design your Pit Boss PID plant with a free, intuitive tool.

- Templates
- P&ID diagram templates
- Pit boss PID controller diagram
About the pit boss PID controller diagram
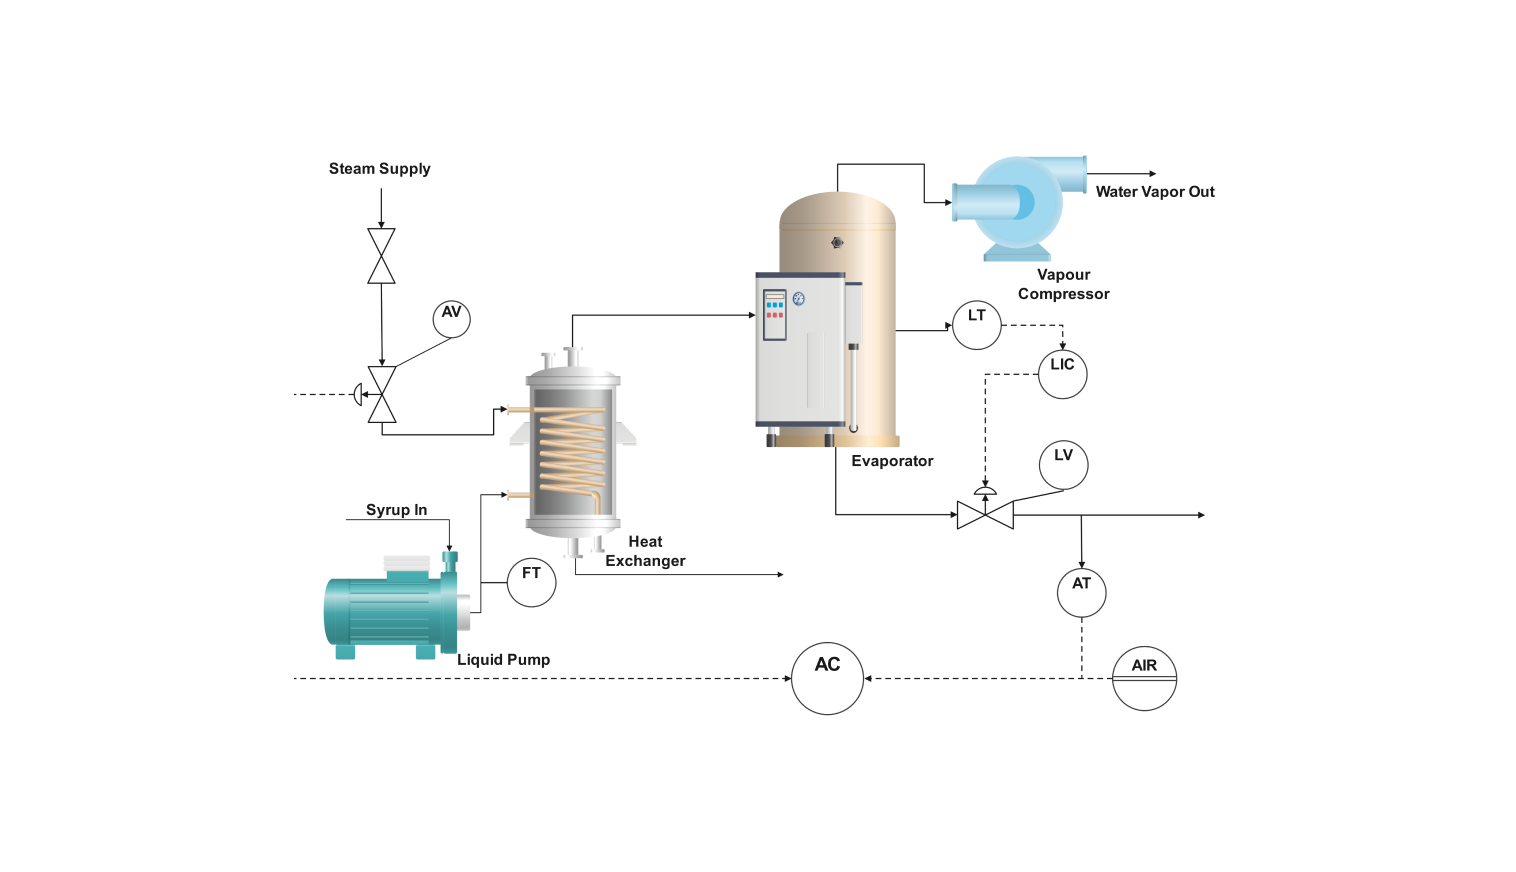
This diagram describes the process flow of double alkali flue gas desulfurization, which removes pollutant gases such as sulfur dioxide from power plant exhaust gases.
The exhaust gas is injected into a scrubber containing a sodium carbonate scrubbing solution and another solution of lime slurry. The sulfur dioxide reacts with the scrubbing solution to form calcium sulfite and sodium sulfate, which are less harmful.
After a while, the scrubbing solution is regenerated by inducing lime flour to maintain its effectiveness. The PID controller regulates the flow of lime slurry mixing with the new products in a regenerated liquid absorption tank.
The desired level of each flow variable is set via setpoint (SP) in the controller. The process variable (PV) is the actual measured variable. The PID controller continuously monitors the difference between the set point and the process variable.
The PID controller adjusts each variable's contribution based on the difference, and the flow of lime slurry is adjusted to achieve the desired solution.
How to use the template
Click on Use this template. You can use the library to add the tools or equipment you need to your process by dragging and dropping the symbols from the library. Give the equipment/instrument's description, model/type, and the required number.
Modify style and edit lines, shapes, and texts to make the PID diagram more apparent visually. Modify the pipeline pathways to suit your particular type of distillation process. The same elements and shapes and the standard shapes can also be saved in the library for future use.
After you are finished, export the diagram in various formats. Your options include SVG, PPTX, PDF, or JPG.
Why PID diagram for pit boss controller
A PID control diagram is a crucial element in understanding the workings of a controller and analyzing how the controller maintains its effectiveness of scrubbing solution for regeneration.
The PID diagrams also serve as a reference for process operators. It provides a clear picture of the flow of solutions, control loops, and valve placement. The operator can adjust the parameters of the instruments by using these diagrams.
The PID diagram of a flue gas desulfurization system is a vital facilitating agent that provides insights and coordination in design, operation, maintenance, and communication. It assures the manufacturing industry of effective and safe management of all the regeneration process systems.
FAQs about the pit boss PID controller diagram
-
Does the pit boss use a PID controller?
Yes, Pit Boss uses the PID controller to help maintain lime slurry's consistent temperatures and flow rates. The desired temperature and flow rate values can be adjusted using the set point value of the user’s choice.
-
What is the working principle of the PID controller?
A PID controller is a proportional-integral-derivative controller. It is widely used in industrial systems to control processes and adjust parameters like temperature, pressure, flow rates, and speed. It constantly monitors the difference between a desired setpoint and the measured value. The control is ultimately the task of minimizing the said difference.
-
How can the PID controller be adjusted?
The PID controller can be tuned in two ways: manual and automatic. P, I, and D values can be adjusted incrementally in manual tuning. Optimizing the controller to produce effective control is a tiring process.
Automatic tuning functions refer to software programs and other online resources that calculate and set the values of P, I, and D. Hence, they offer the end user a precise control of parameters.
Related Templates

Get started with EdrawMax today
Create 210 types of diagrams online for free.
Free Download Free Download Draw a diagram free Draw a diagram free Draw a diagram free