Smart plant P&ID diagram
Create your smart plant layout effortlessly with our free tool.
- Templates
- P&ID diagram templates
- Smart plant P&ID diagram
About the smart plant P&ID diagram
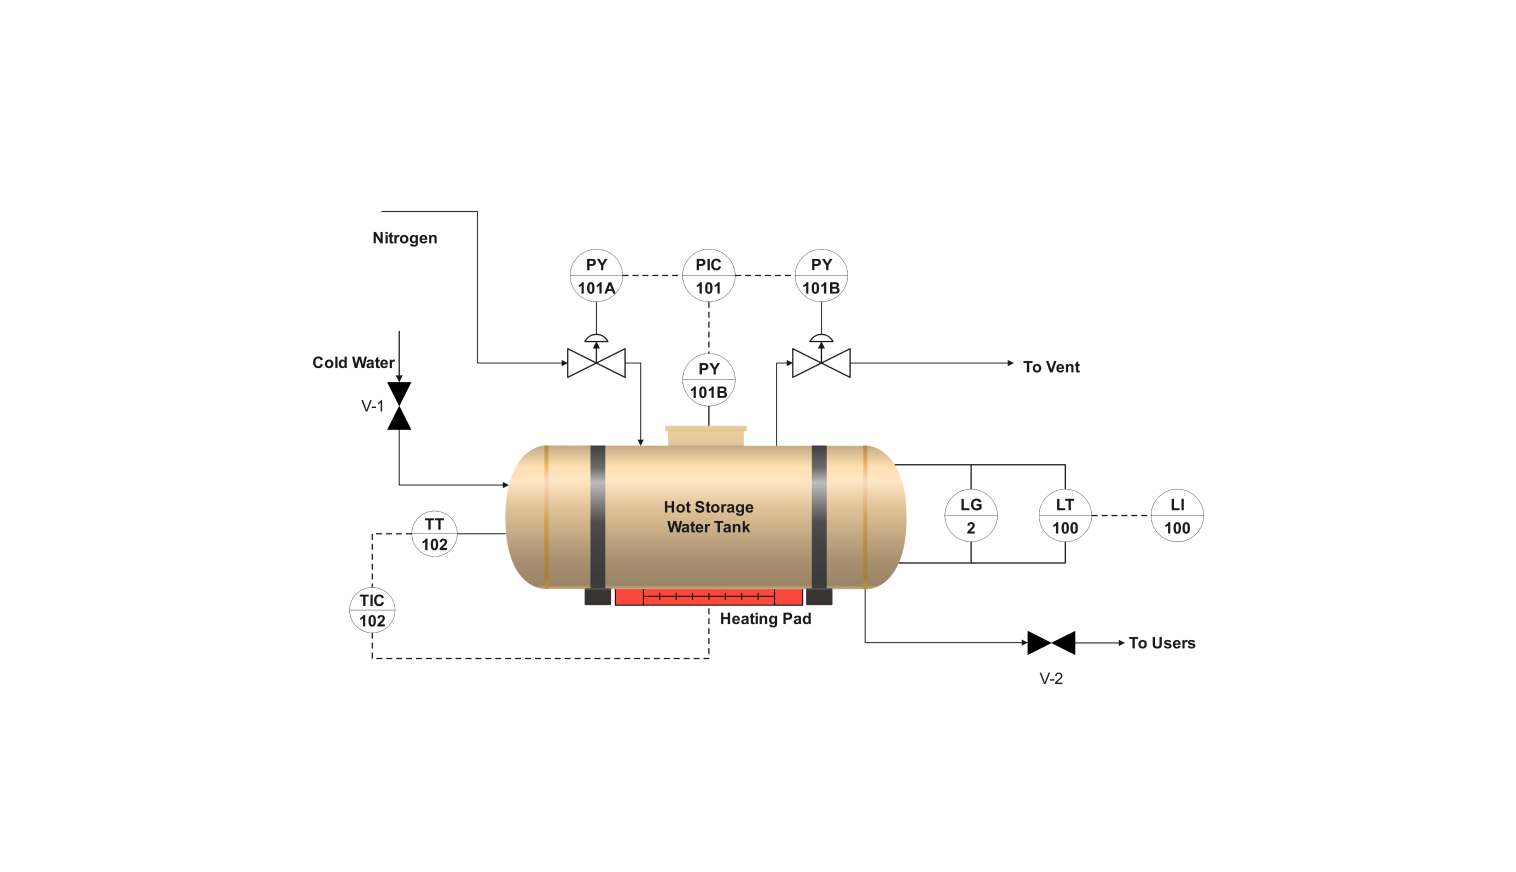
The diagram describes the process flow of a smart hot water storage system. The system consists of a tank to store hot water, a heating pad to transfer the heat to the water, and a vent to release the pressure.
The temperature control system, called TIC, maintains water at the required temperature. The pressure gauges monitor the system's pressure. In the diagram, these are labeled as LG, LT, and LI.
The smart water heating system operates as follows: Cold water is let into the tank through the inlet pipe V-1, and the heating pad heats it until it reaches the desired temperature, controlled by a temperature indicator controller (TIC). After the water reaches the required temperature, it is put to the user through the hot water outlet pipe V-2.
Nitrogen gas in the tank stops oxidation and maintains the pressure at the desired level. Thus, the water is kept free of contaminants, and the tank is kept at the given pressure level. This smart water heating system is efficient and economical; hence, it can be considered an innovative way of meeting water heating needs.
The software's interface is user-friendly; thus, users can customize elements such as instruments, valves, pipes, and connectors. This variety encourages people to create and visualize their water heating systems easily.
How to use the template
Click on Use this template. Customize the template according to your requirements, and drag symbols from the library to add the necessary equipment or instruments to your process by searching for them in the left pane.
Style and edit lines, shapes, and text to clarify your PID diagram visually. Adjust the pipe pathways to match your specific distillation process. Common elements and shapes can also be saved in the library.
After you are finished, export the diagram in various formats. Your options include SVG, PPTX, PDF, or JPG.
Why P&ID diagram for a smart plant
For engineers, the P&ID is the baseline of the planning process. It assists them in identifying the best possible arrangement of equipment, thus maximizing space usage and smoothing material flow. Besides, the diagram also stipulates the necessary equipment size and kind, averting the expensive mistakes that would be caused if the wrong equipment was used.
Nevertheless, the benefits are not limited to the design phase only. It shows the whole process. Thus, you can follow the movement of materials, find out what control loops do to keep the conditions stable and see where the valves are placed for adjustments. This visual illustration is significant when you have to solve problems.
The P&ID diagram serves as a connection between the design and operation of an intelligent factory. It allows engineers to build efficient systems and will enable operators to keep their performance at the highest level. The P&ID aids in the smooth functioning of these modern automation projects by providing a common language and a precise notion of the complicated processes involved.
FAQs about the smart plant P&ID diagram
-
What is a smart plant P&ID?
A smart plant commonly refers to an automated process flow diagram that uses controllers and other instruments. Diagrams that map the workings of smart plants are generally called smart plant P&ID diagrams.
-
What is smart plant instrumentation?
Electronics, digital instruments, and smart equipment can make the process flow of a smart plant possible. Controllers that can automate the process and other instruments like closed-loop valves and pressure gauges all fall into the category of smart plant instrumentation.
-
What are the benefits of smart P&ID?
Smart P&ID diagrams refer to automated processes that can work with minimal to no input from the operator. Smart plants can learn users' usage patterns and be automated to use them most effectively. This benefits the user and the stakeholders due to increased efficiency and cost-effectiveness.
Related Templates


Get started with EdrawMax today
Create 210 types of diagrams online for free.
Free Download Free Download Draw a diagram free Draw a diagram free Draw a diagram free