A pie chart is a visual data representation showing the relationship between a set of statistical figures and certain variables. The circular graph is divided into radial portions in which every slice represents a particular percentage or allocation. Dealing with large volumes of data and plotting them individually in the pie chart may seem a difficult task. But it is really not. Creating a comprehensive circle chart is simple and easy with the help of a pie chart creator.
In this article, we’ll discuss how to produce an instructive pie chart using the best and free pie chart creator. Don’t worry. The steps are so easy to follow. No advanced technical skills are required in the procedure. Let’s check it out.
Part 1. Using EdrawMax to Create Pie Charts
In the field of sales and marketing, each slice of the pie chart is proportional to the size of that category in the group as a whole. The simplicity of a pie chart is its strength. It graphically conveys facts in an easy-to-understand format for audiences of all levels. Even if no numbers are utilized, knowledge may be gleaned rapidly, and data can be analyzed swiftly.
EdrawMax is a great pie chart creator with a free version and can be accessed online. It allows you to automatically build the pie chart by just embedding the table or entering the appropriate detail in the supplied column. As soon as you add data to the table, your pie chart will be ready to use.
Steps of Creating Pie Chart Using EdrawMax
It’s now time to create a pie chart. Don’t worry. EdrawMax is equipped with advanced diagramming tools and numerous pie chart templates to make it much easier for you. Here’s a quick guide on how to use EdrawMax’s pie chart creator.
Step1Select Template
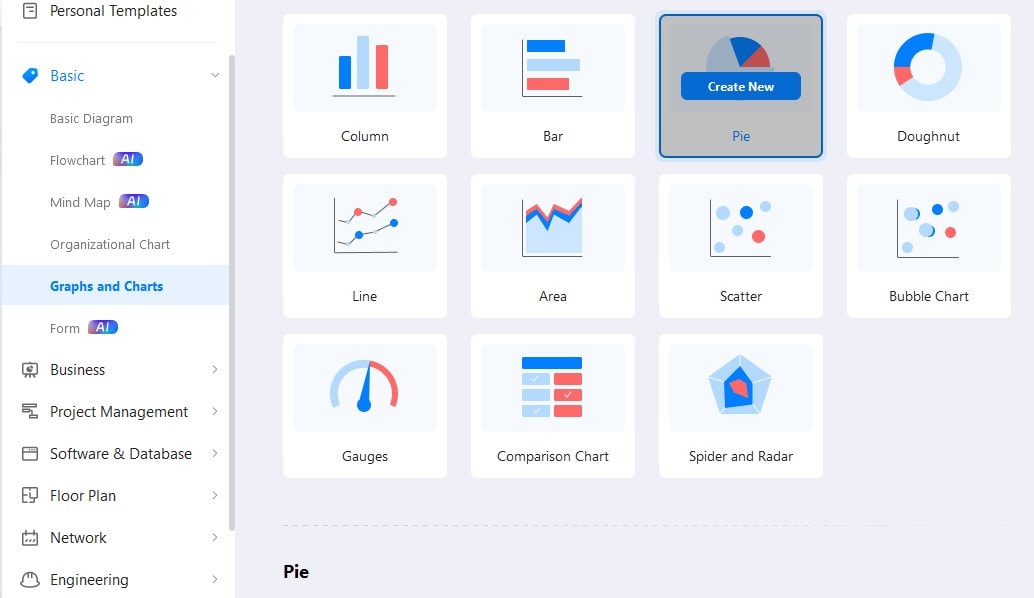
Install and launch it on your computer. After it fully loads, navigate to New > Graphs and Charts > Pie. You’ll then be taken to a new and blank document.

Step2Customize the template
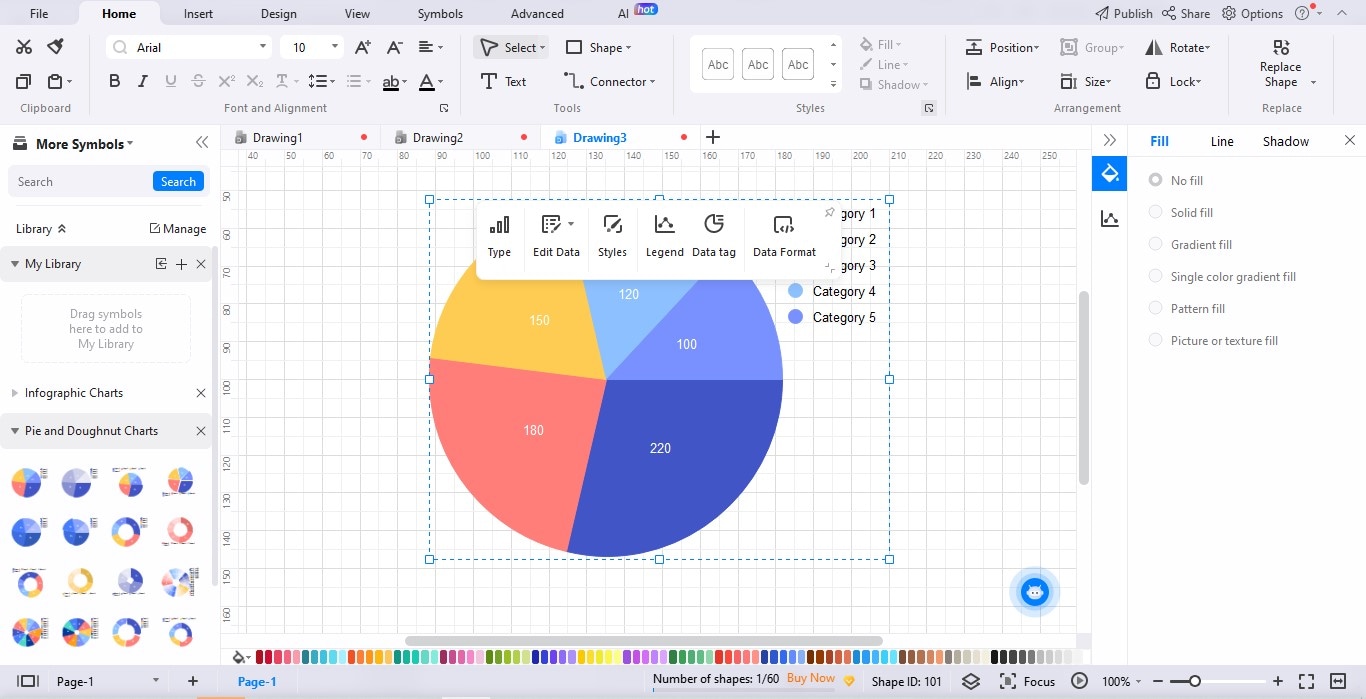
From there, you'll see different choices and templates for pie charts. Choose your desired template. And then, click and drag to place it in your document. You can customize the pie chart's color, data, type, etc.

Step3Export and share
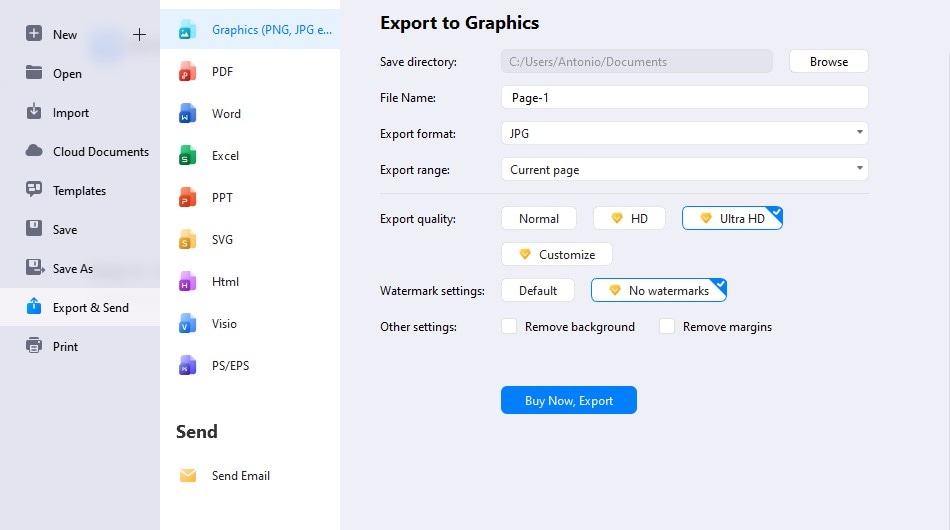
After creating the pie chart, it’s time to export your finished work. You may export it in different formats, such as JPG, PNG, PDF, editable MS Office file format, SVG, and Visio VSDX file format. Moreover, you can also share it through social media and sharing links. If you wish to save the format on the platform, you may also upload the pie chart to EdrawMax's online template collection.

Part 2. 5 Best Pie Chart Templates to Start With
Now if you are just a beginner with little experience of diagramming, there is no need to worry. With EdrawMax’s enormous templates community, you can effortlessly get started. All you have to do is browse its wide selection of pie chart templates and choose your preferred style. Below are some of the most popular templates.
Monthly Budgeting Pie Chart
The monthly budgeting pie chart is one of the most common pie chart templates. It is used by businesses and individuals to have a clear overview of their finances. With this, we can easily keep track of how we spend, save, or invest our hard-earned money.
Water Usage Pie Chart
Next on the list is the water usage pie chart. If we find it hard to keep tabs on our water consumption, we can use this water usage template. It has a comprehensive pie chart design that displays how we consume the water supply in our household.
Pie Chart for the Cost of House Construction
Are you planning to build your house any time soon? That’s great. But before that, you must ensure that everything is well-planned to avoid hiccups while the construction is ongoing. To see how much money you need to save, you can use this cost of house construction pie chart. Designate each pie to the house structures along with their estimated costs.
Internet Usage Pie Chart
If your current internet subscription doesn’t offer unlimited usage, you should keep an eye on how you use it daily. You can utilize this internet usage pie chart to allocate your consumption equally across all your gadgets. Just a quick note, designate the highest percentage to the device you use for work.
Blank Pie Chart
Well, you can use this blank template if you prefer to personalize your pie chart. Feel free to add your own title, legends, and variables. The design is fully customizable as well. Change the shape and color of the pie based on your personal taste. Take it as your own using EdrawMax pie chart creator.
Part 3. Why Choose EdrawMax to Create Pie Charts
Pie charts are among the most common types of representation tools. But as mentioned earlier, creating one is not a walk in the park. That’s why using a complete-package pie chart creator like EdrawMax is ideal. The program provides a wide array of features to help you build well-defined graphs. It offers +15,000 templates, which you can easily start with or customize on your preference.
In addition, EdrawMax is easily accessible from almost every device. It is compatible with Windows, macOS, Linux, or any web browser for online use. It also has a mobile version available both in Android and iOS. Thus, you can use it anywhere and anytime you need it.
Listed below are some key features of the EdrawMax pie chart creator:
- Large collections of pre-designed pie chart templates.
- Automated pie chart generation with Edraw AI.
- Wide selection of advanced diagramming tools and visual elements.
- Collaboration features with a cloud-hosted workplace.
- A lot of ways to export and share finished pie chart outputs.
Conclusion
Pie charts are indeed useful to all of us. We use it at work, school, or even for personal matters. In this article, we have explained how to build a pie graph, and a few pie chart templates from EdrawMax. If you are looking for more templates you can get started with, visit our templates community.
[没有发现file]


 below.
  below.


