


Using diagrams in your presentations is a game-changer. It makes your audience more interested and helps them understand better. Google Slides is great for this because it's easy to use, and you can access it from anywhere online. It's a hit with both regular folks and companies. Want to get good at making diagrams in Google Slides? Check out this article.
And if you're in a hurry to make slick diagrams, try EdrawMax. It's free and packed with over 15,000 templates, so you can whip up a professional-looking diagram in no time.
In this article
Part 1. Why Use Google Slides?
Google Slides is a versatile presentation software by Google as part of the G Suite productivity suite. Its cloud-based nature allows users to create, edit, and collaborate on presentations in real-time. It eliminates the need for software installation and enables seamless access from any device with access to the Internet.
Key Features
One of the standout features of Google Slides is its ability to create dynamic visuals that enhance the overall presentation. The platform offers a variety of built-in tools and features to accomplish this.
- Slide Master: The Slide Master feature allows users to establish a consistent layout, theme, fonts, and colors throughout the presentation. It maintains a cohesive visual identity, making the presentation more professional.
- Shapes and Lines: The software offers an array of shapes and lines that users can easily insert and customize. These elements are invaluable for creating diagrams, flowcharts, and other visual aids.
- Charts and Graphs: Google Slides allows users to generate interactive charts and graphs using spreadsheet data. These dynamic visuals help present complex information in a visually appealing and easily understandable manner.
- Image and Video Integration: Users can incorporate images and videos from their Google Drive or the web into their presentations. The convenience enables the addition of engaging multimedia content to enhance the audience's retention of key points.
- Animation and Transitions: Google Slides offers an array of animation and transition effects to add flair to presentations. These effects can be applied to individual elements or entire slides, making the presentation more captivating and professional.
Part 2. How To Make a Diagram on Google Slides
Creating a diagram on Google Slides is a valuable way to visualize workflows or decision trees. Follow these step-by-step instructions to make a diagram.
Step1
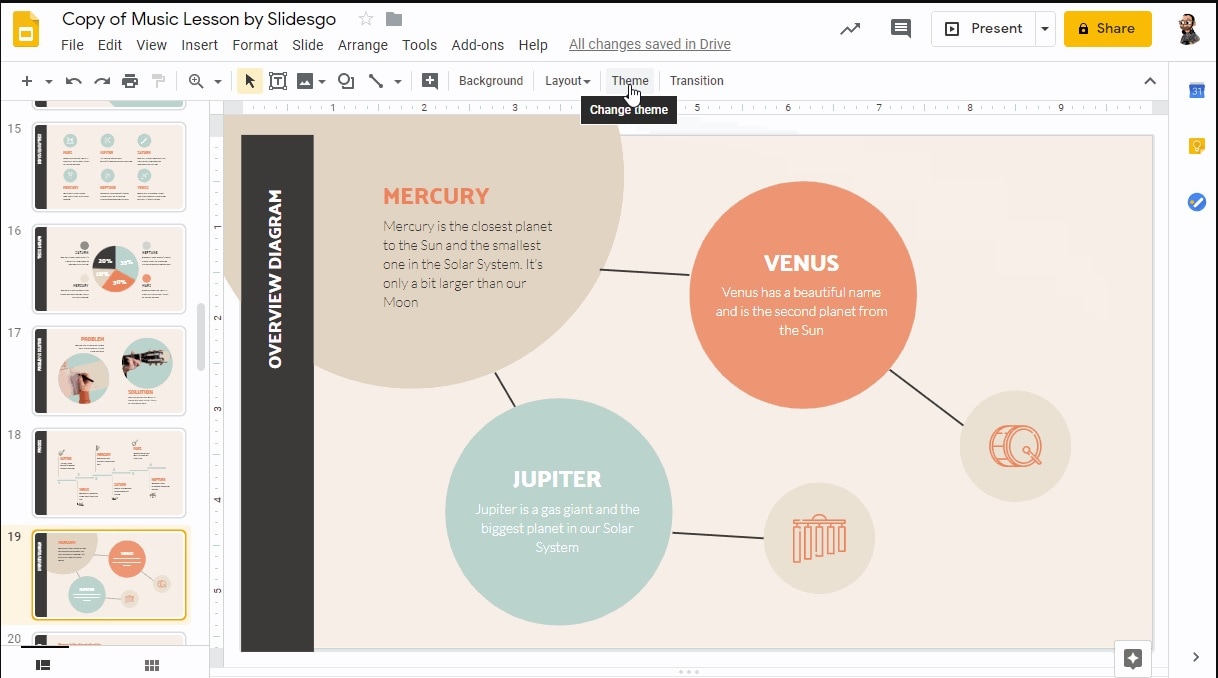
Open Google Slides and start a new presentation or access an existing one.
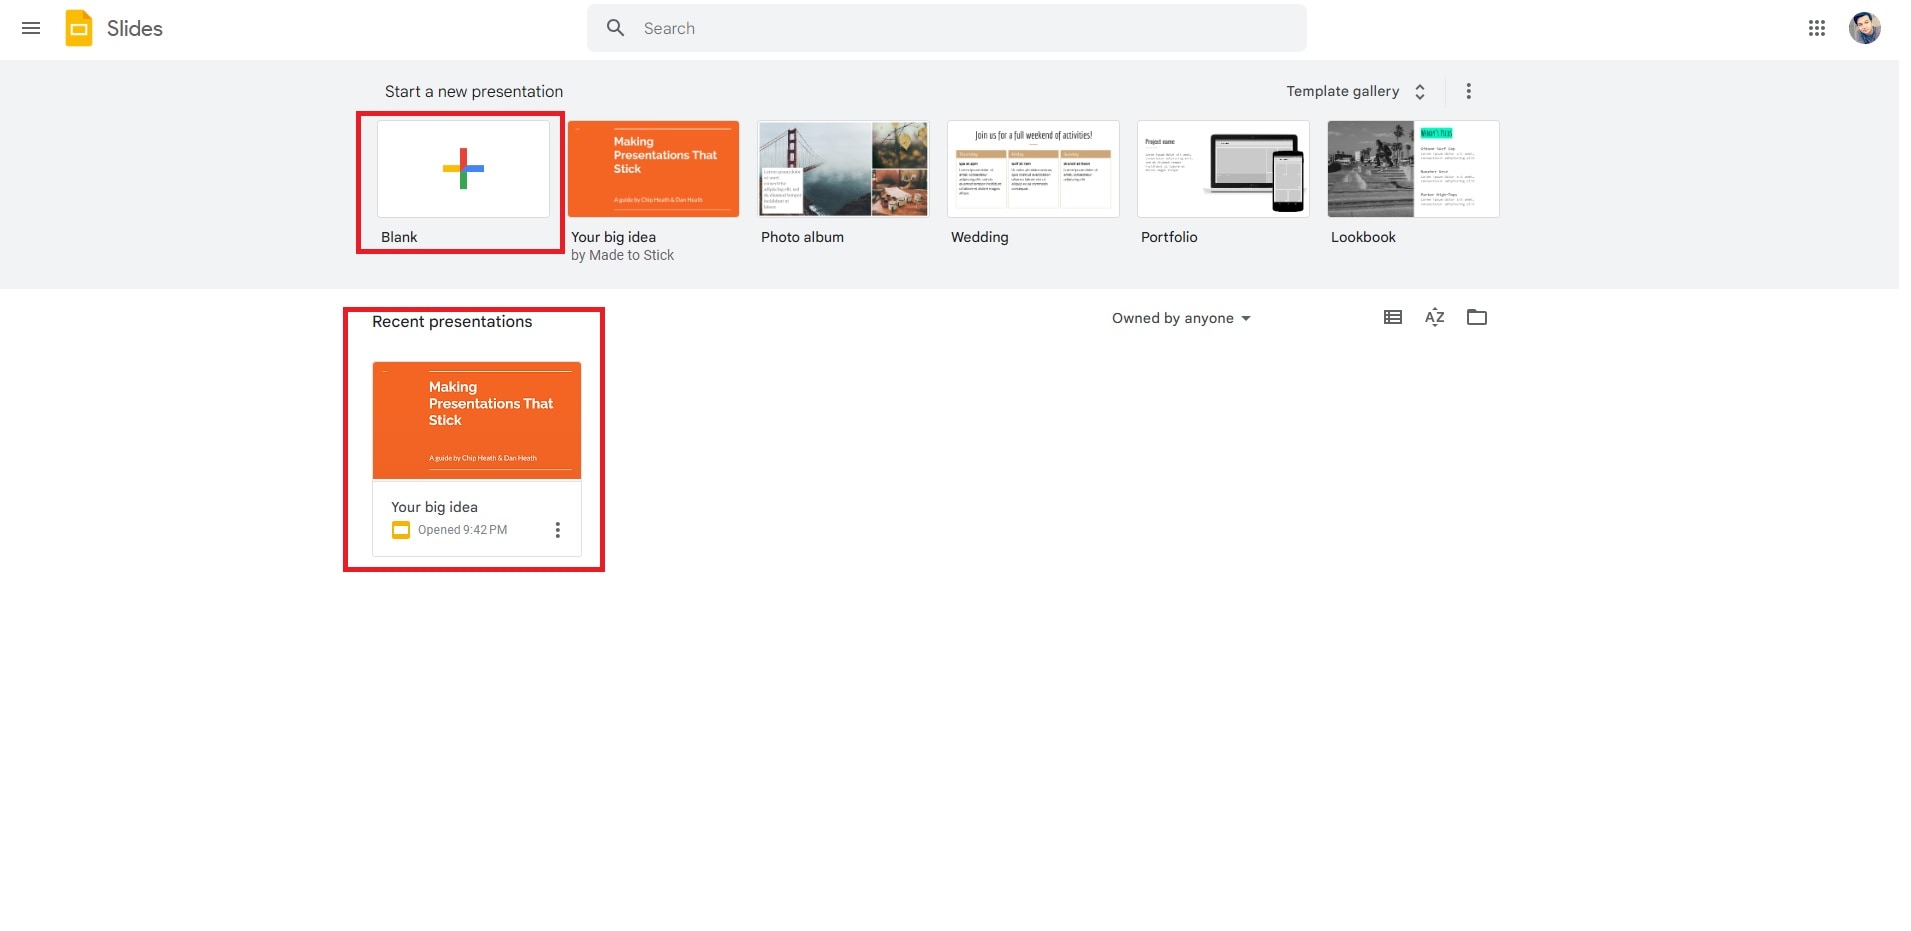
Step2
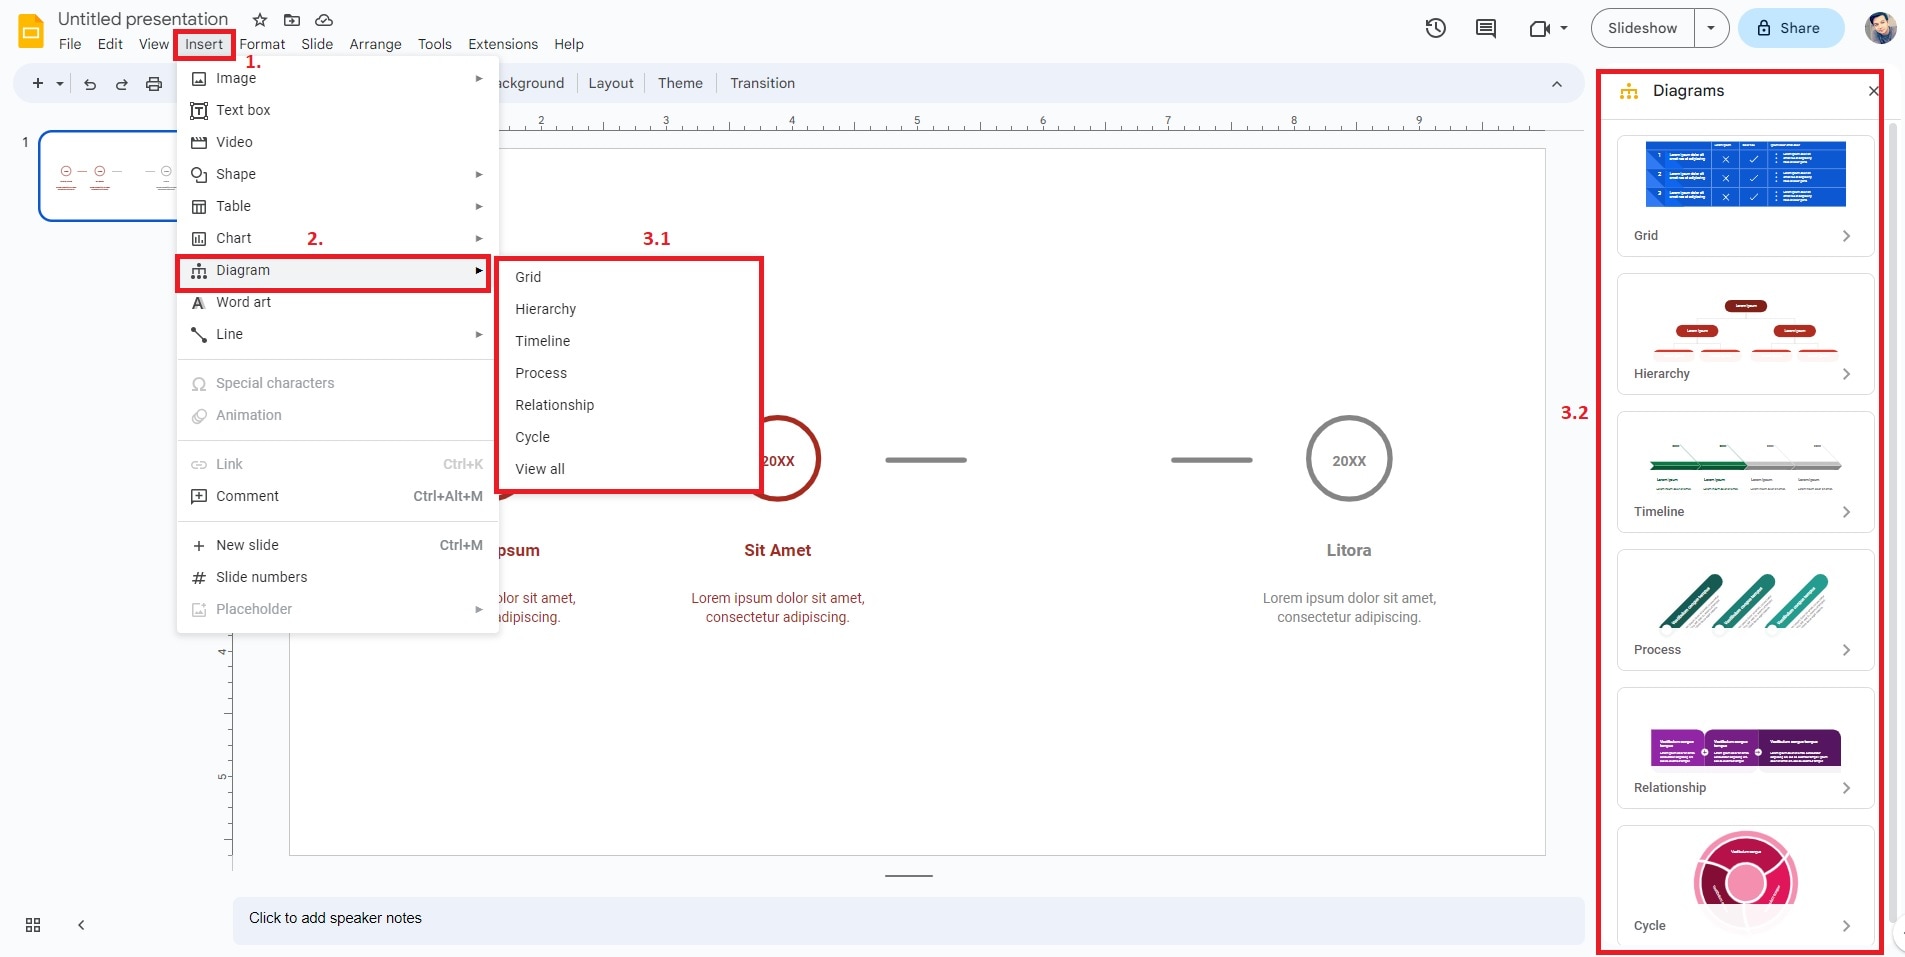
Click the Insert menu in the top toolbar and select Diagram from the dropdown list. Choose the type of diagram you want to create in the Diagram window that appears.
Step3
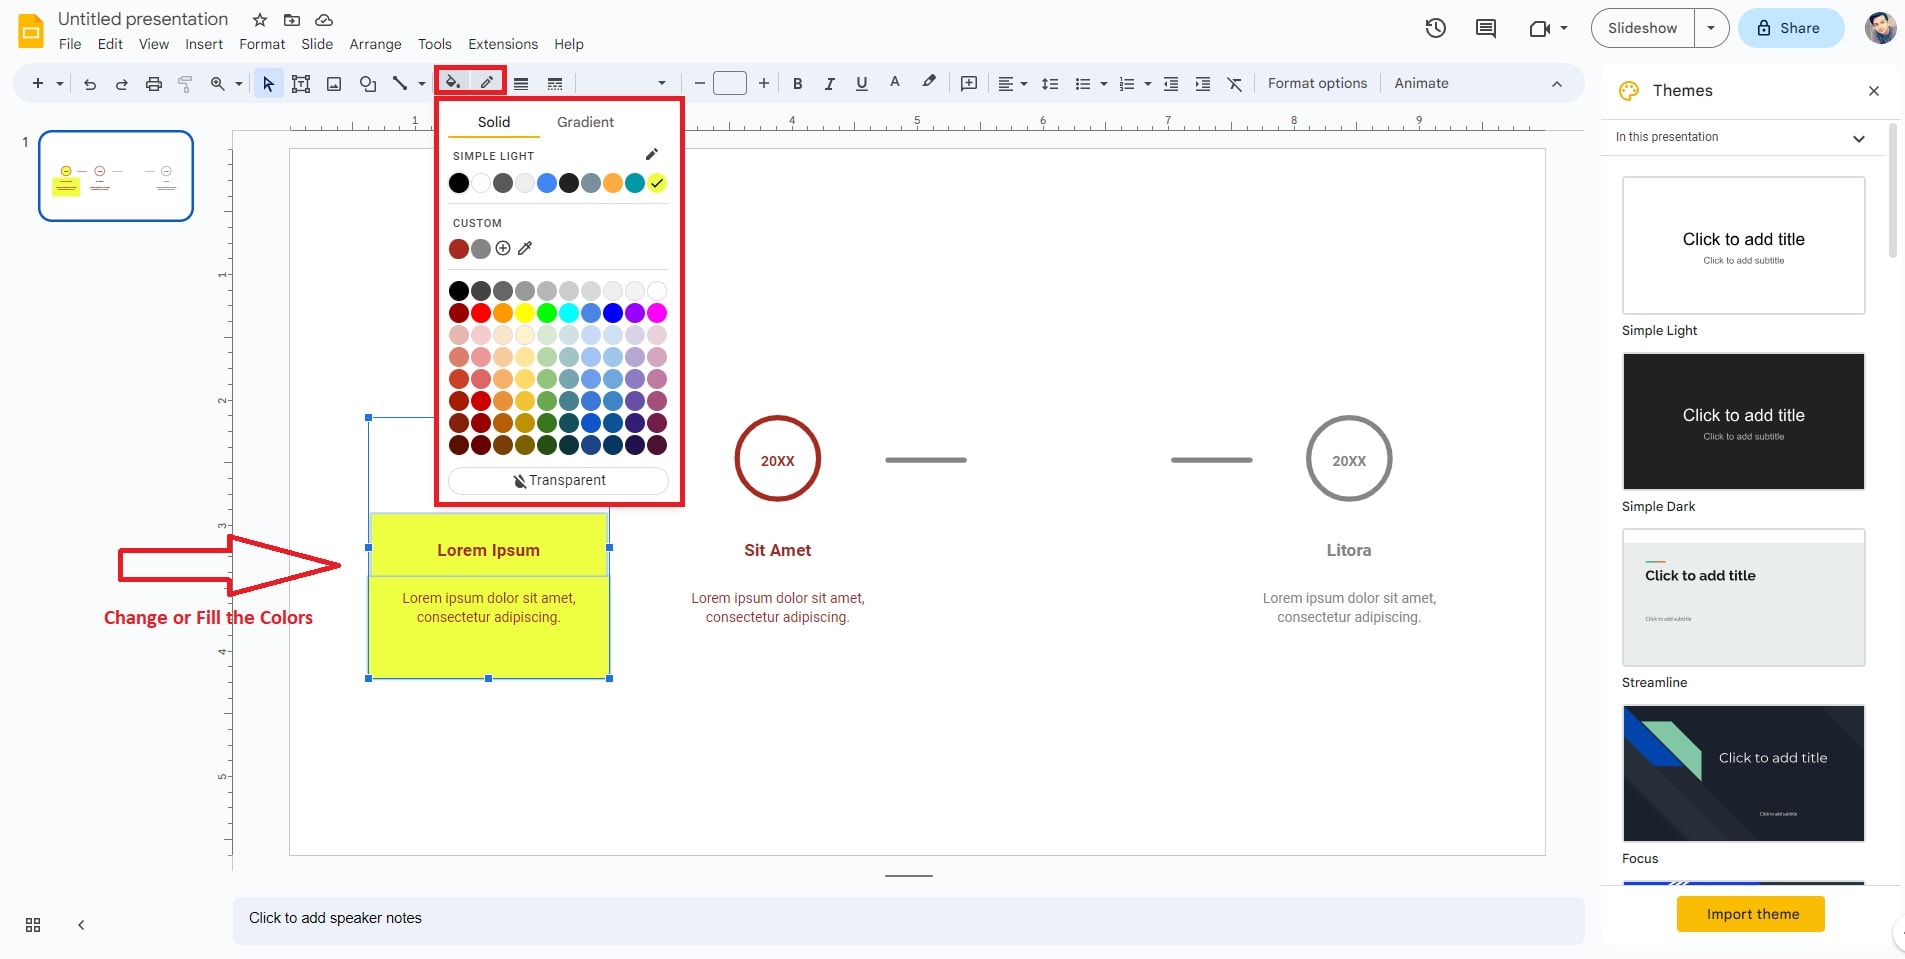
A blank diagram will be inserted onto your slide. You can customize it by clicking the circles to add text or by resizing and repositioning them. To change the color or style of the circles, click the Fill color or Border color options in the top toolbar.
Step4
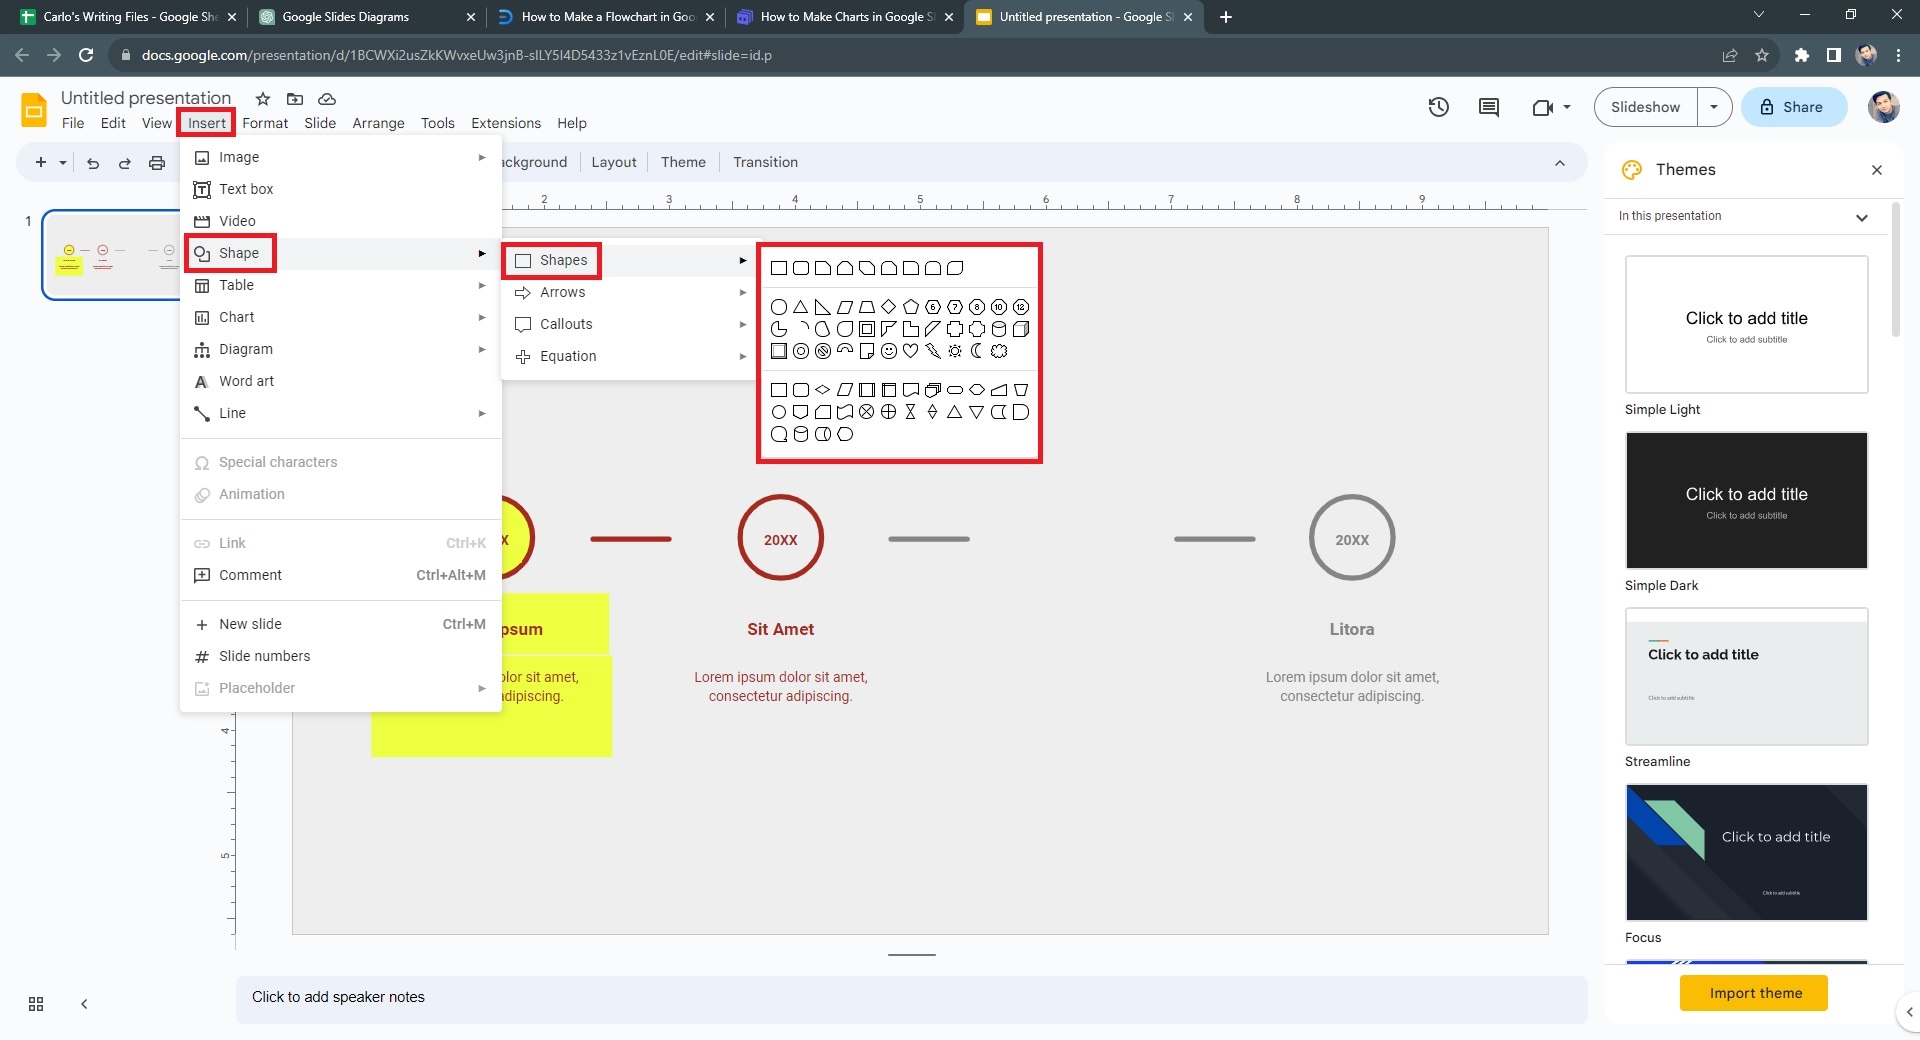
To add text inside the circles, click the circle and start typing. You can also change the font style, size, and alignment from the toolbar. To create overlapping portions of the diagram, adjust the circles' positions as needed. If you want to add more elements to the diagram, go to the Insert menu, select Shape, and choose the desired shape to complement your diagram.
Step5
Once you're satisfied with your diagram or flowchart, you can add additional slides to your presentation. Next, continue with other content to complement your visuals.
Part 3. Make Better Diagrams With EdrawMax – Easier and Faster
EdrawMax is a versatile software program that streamlines the creation of intricate diagrams. With over 280 types of diagrams, more than 15,000 templates, and 26,000+ symbols, EdrawMax enables you to make stunning diagrams on its beginning-friendly interface within minutes.
Key Features
EdrawMax is one of the most popular tools today for creating diagrams. Below are its major highlights.
- Extensive Resources: EdrawMax offers 280+ diagram types and 15,000+ pre-designed templates, 26,000+ symbols for various diagrams.
- Versatile Customization Options: The software allows for comprehensive and simple customization, from adjusting colors, fonts, and line styles to adding annotations and images.
- Intelligent Edraw AI: The Edraw AI feature takes diagram creation to the next level. Users can input raw data with a single click, and Edraw AI will automatically generate a fully-fledged diagram, saving time and effort.
Primary Advantages of EdrawMax
These advantages below make EdrawMax a standout choice for diagramming.
Wide Range of Diagram Types
EdrawMax offers a comprehensive selection of diagram types. It covers everything from flowcharts, mind maps, and org charts to floor plans, network diagrams, and more. This wide variety ensures that users can find the perfect template for diagramming needs. It's a versatile solution for professionals across different industries.
User-Friendly Interface
EdrawMax has an intuitive and user-friendly interface. It makes the software accessible to both beginners and experienced diagram creators. The drag-and-drop functionality, smart tools, and interactive editing options streamline the diagramming process. It enables users to create stunning, professional diagrams without a steep learning curve.
Cross-Platform Compatibility and Collaboration
EdrawMax is designed with collaboration in mind. It offers seamless cross-platform compatibility for all users. The platform allows access to Windows, macOS, and even web browsers. Moreover, its cloud-based storage and sharing options facilitate real-time collaboration among team members. The feature ensures smooth communication and productivity in group projects.
Part 4: How To Make Diagrams With EdrawMax
Below is a comprehensive step-by-step guide to creating professional diagrams with EdrawMax. Follow the guide below for impactful presentations in a few simple steps.
Step1
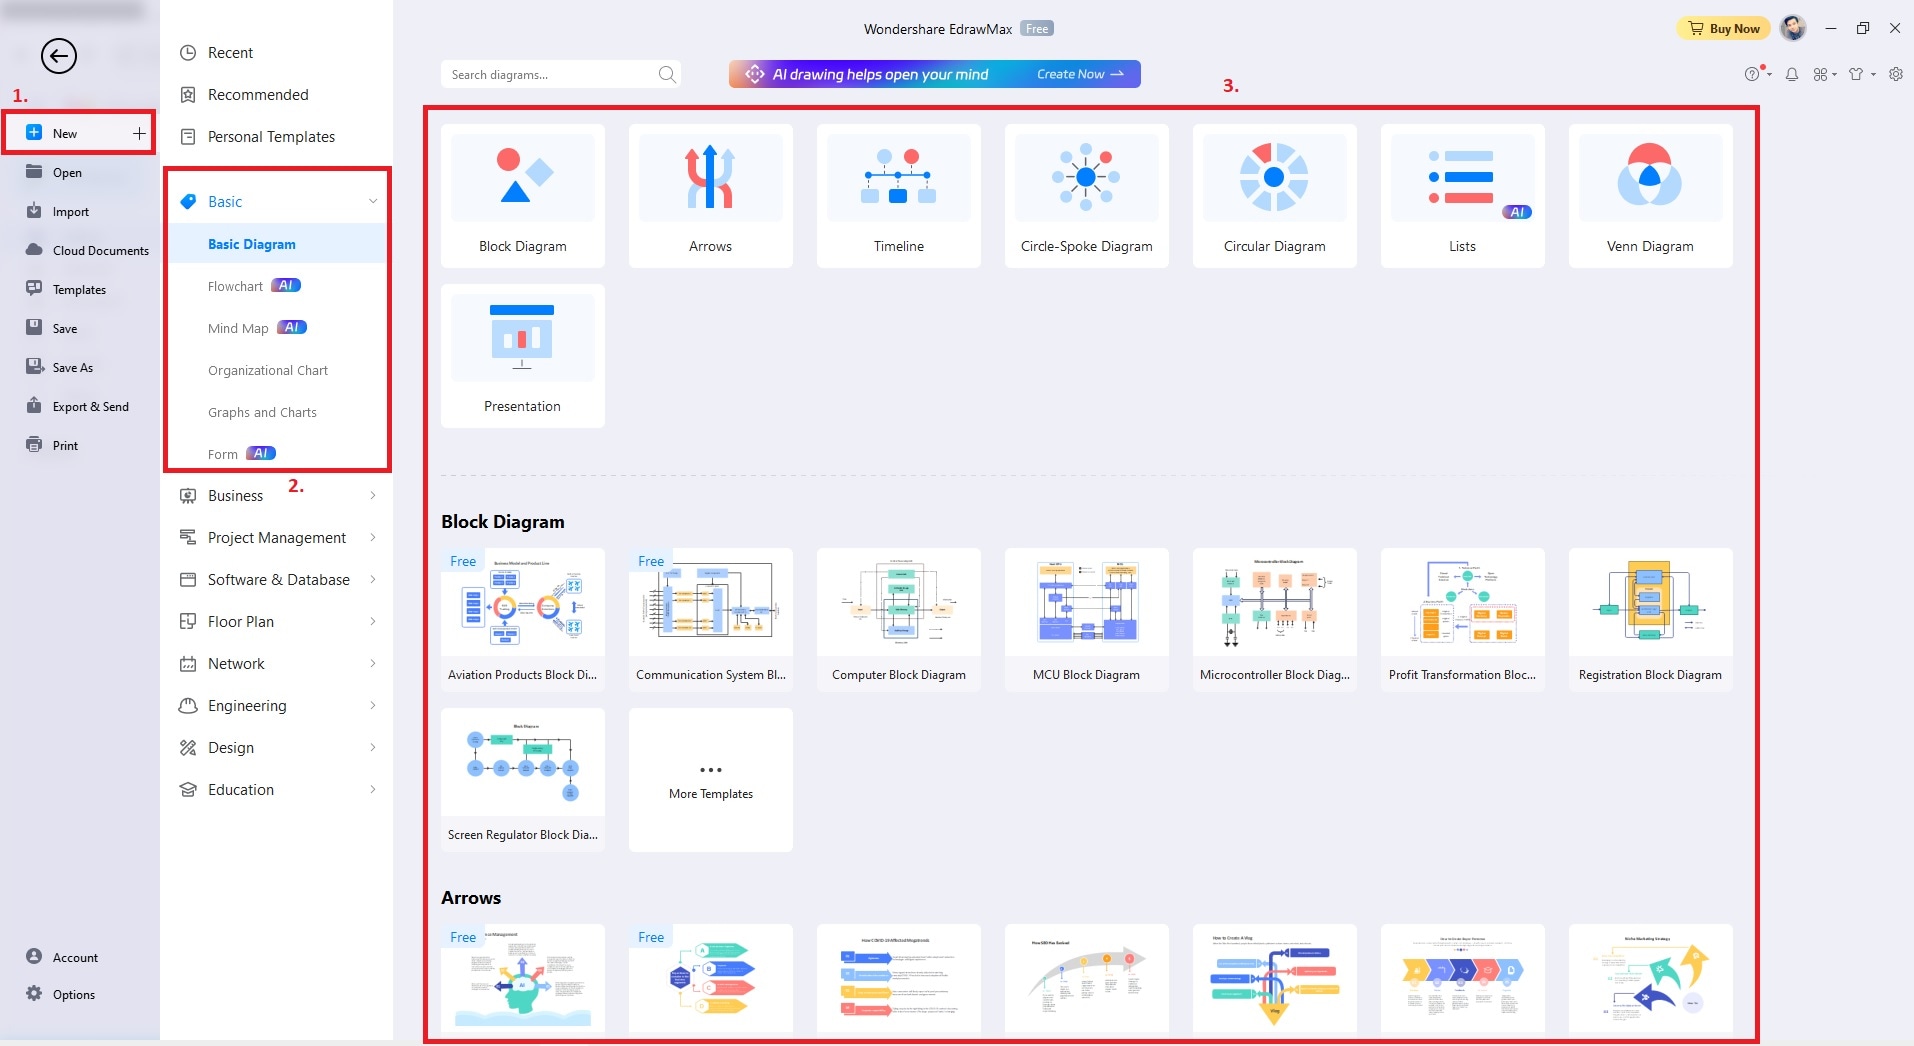
Download and install EdrawMax. Launch the platform. Click New and choose the appropriate Diagram for your project. Alternatively, you can choose from pre-designed templates to get started right away.
Step2
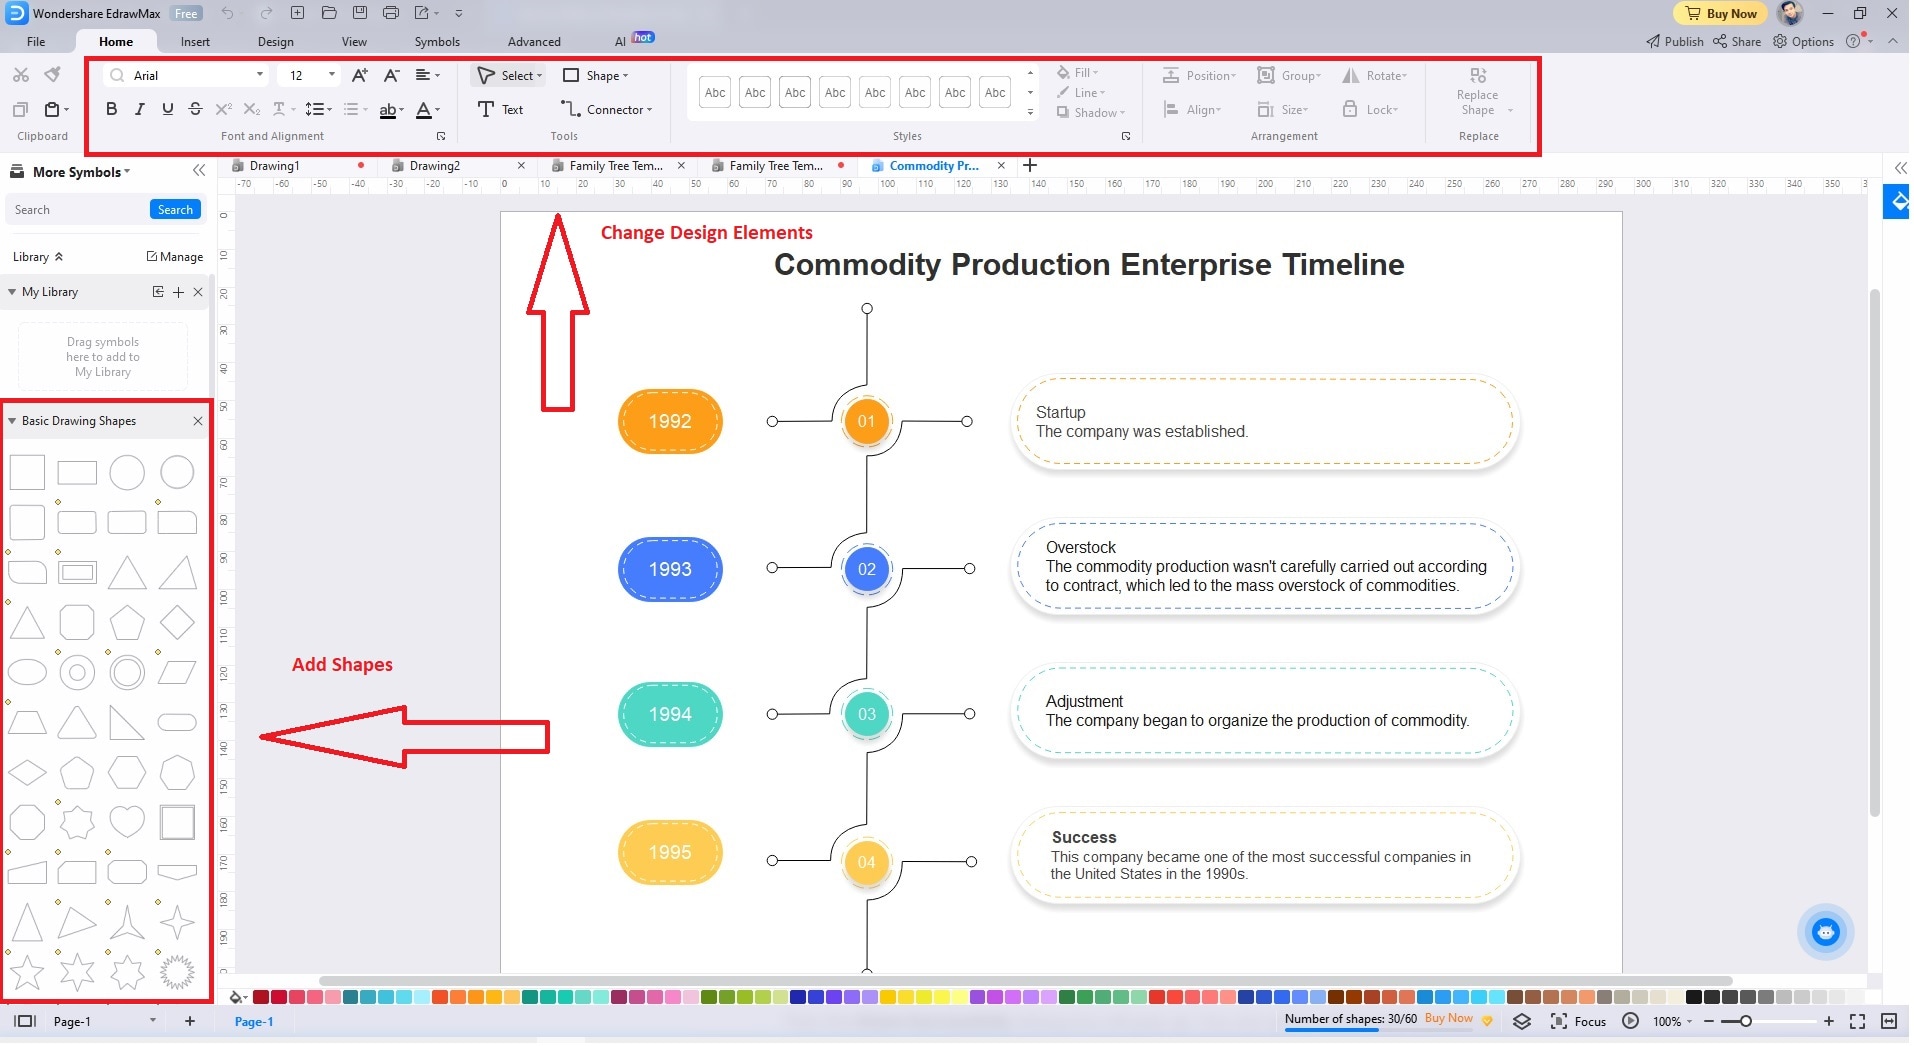
Drag and drop shapes from the left sidebar onto the canvas to build your diagram structure. Next, modify the shapes, colors, fonts, and other design elements using the formatting options in the top toolbar. You can also click shapes to add text or labels to provide context and explanations for each element.
Step3
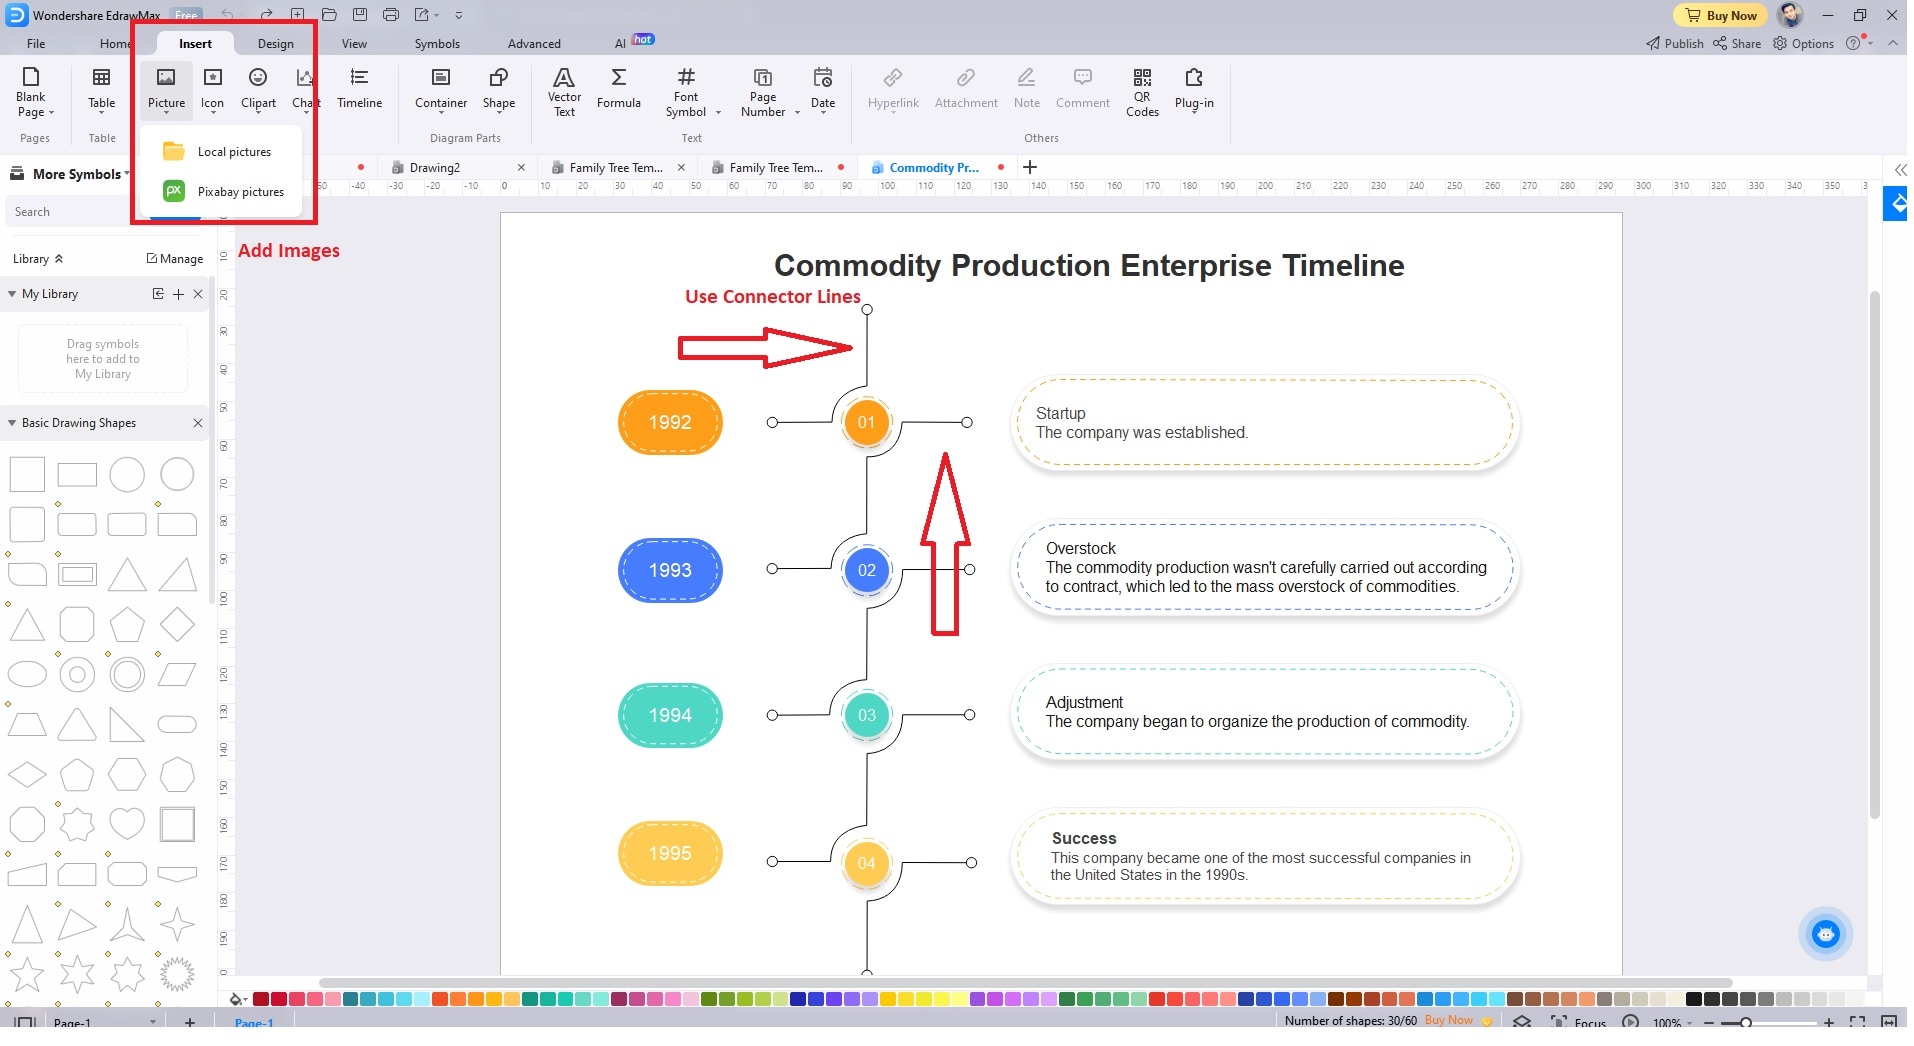
Use connector lines or arrows to link different shapes and establish relationships between them. In addition, enhance your diagram with images or icons that support your message.
Step4
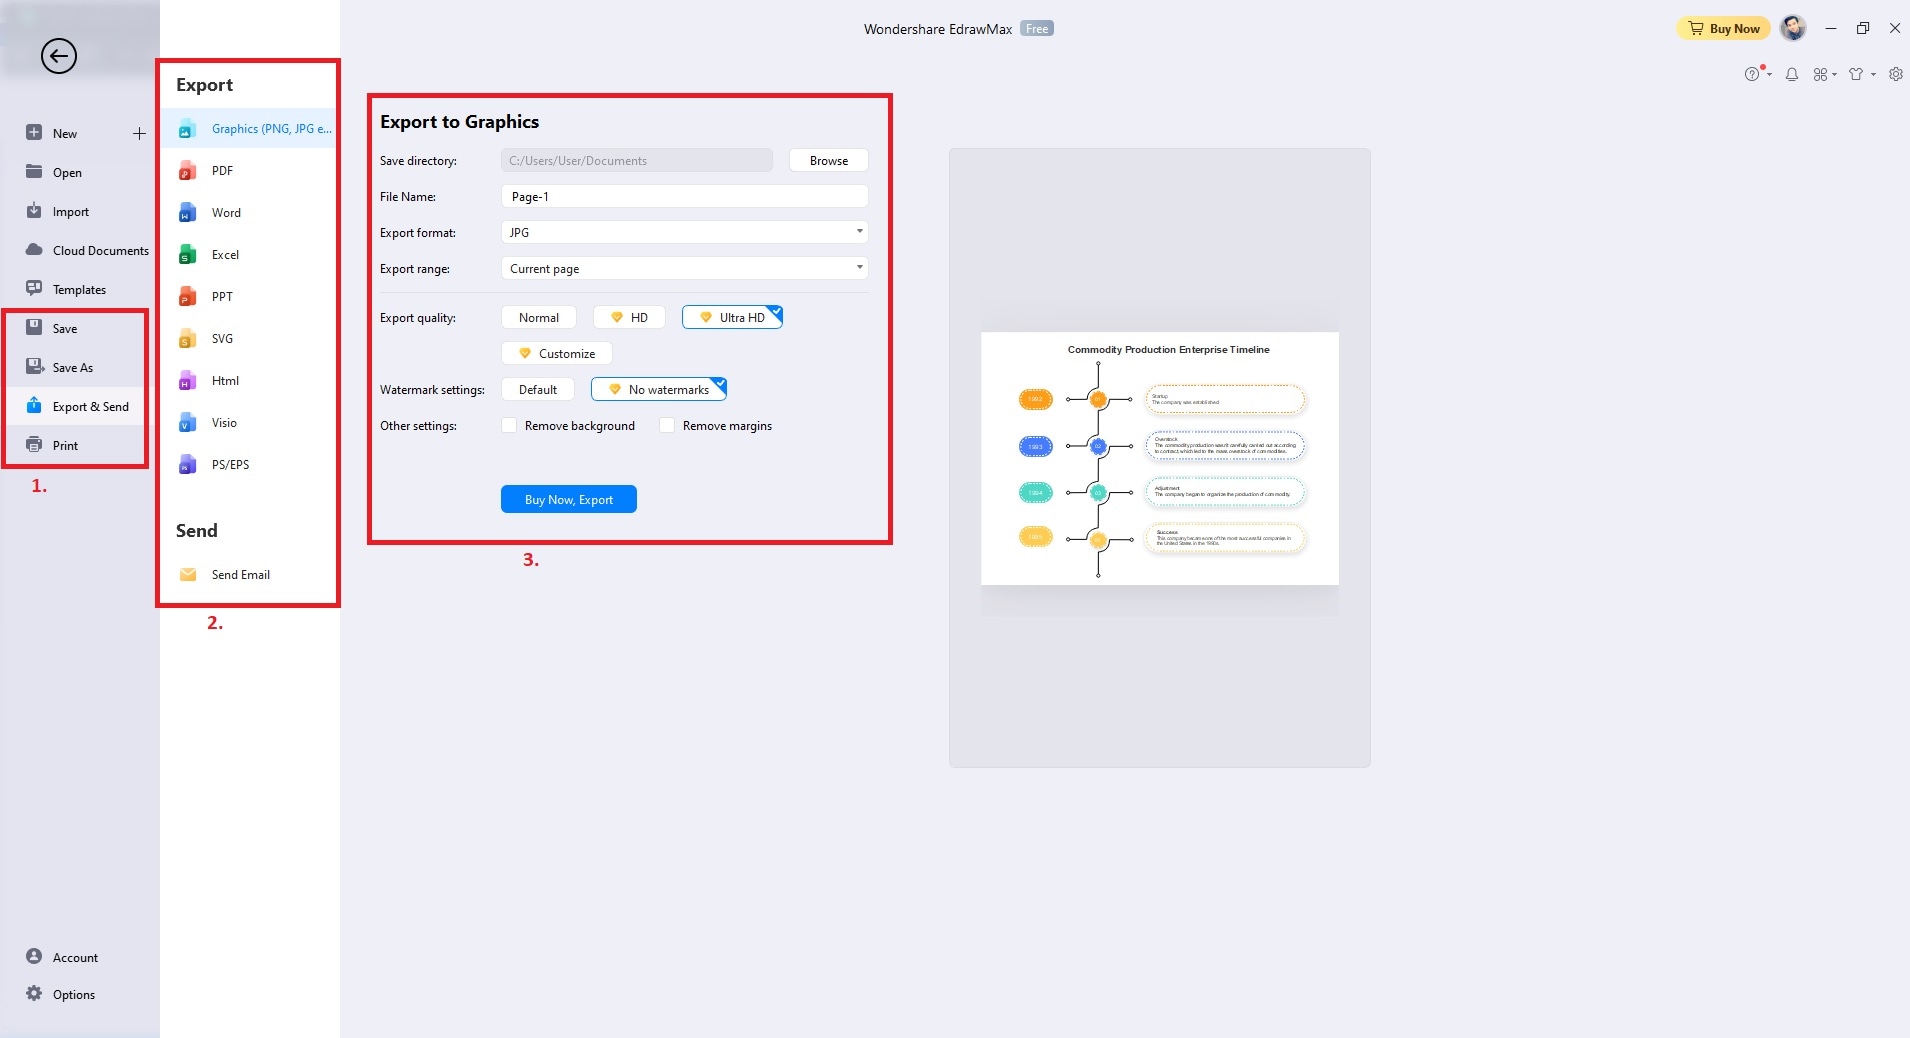
Once your diagram is complete, save it in your preferred format or export it to share with others.
Tips: Making Diagrams on Google Slides
When presenting diagrams, explain each element concisely. Help the audience understand the information better. Use the diagrams as visual aids to support your speech. Practice your presentation to maintain a smooth flow and manage timing effectively. Add interactive elements to your diagrams to engage the audience, if possible.
By following these tips, you can make your Google Slides visually appealing.
- Simplify and Focus. Keep your diagrams clean and straightforward. Focus on the main points. Avoid cluttering with excessive elements that may distract the audience.
- Consistent Design. Maintain a consistent design throughout your presentation to create a cohesive and professional look. Use the Slide Master to set a unified theme for all slides.
- Use Smart Guides. Enable Smart Guides in Google Slides. This aligns and spaces your diagram elements for a polished appearance.
- Utilize Animations Wisely. Add animations sparingly to enhance the presentation's flow. Avoid overusing them, as they can be distracting.
- Color Palette. Choose a harmonious color palette that complements your content.
- Accessibility. Ensure your diagrams are accessible by using alt text for images. Provide descriptions as well for visually impaired audiences.
Conclusion
Visual communication is a powerful tool that enhances the effectiveness of presentations. Through learning how to design a diagram on Google Slides, you can make complex information more accessible and engaging for the audience. Well-crafted visuals simplify concepts, improve retention, and leave a lasting impact.
For those seeking a diagramming solution beyond Google Slides, EdrawMax is a top choice. The platform empowers users to create stunning diagrams and visuals. It can create compelling and impactful presentations with ease. With its vast library of templates and extensive options, you will go right with EdrawMax.
AI Diagram Generator
Enter your prompt. Upload files if needed. Generate diagrams, charts, or slides instantly.


