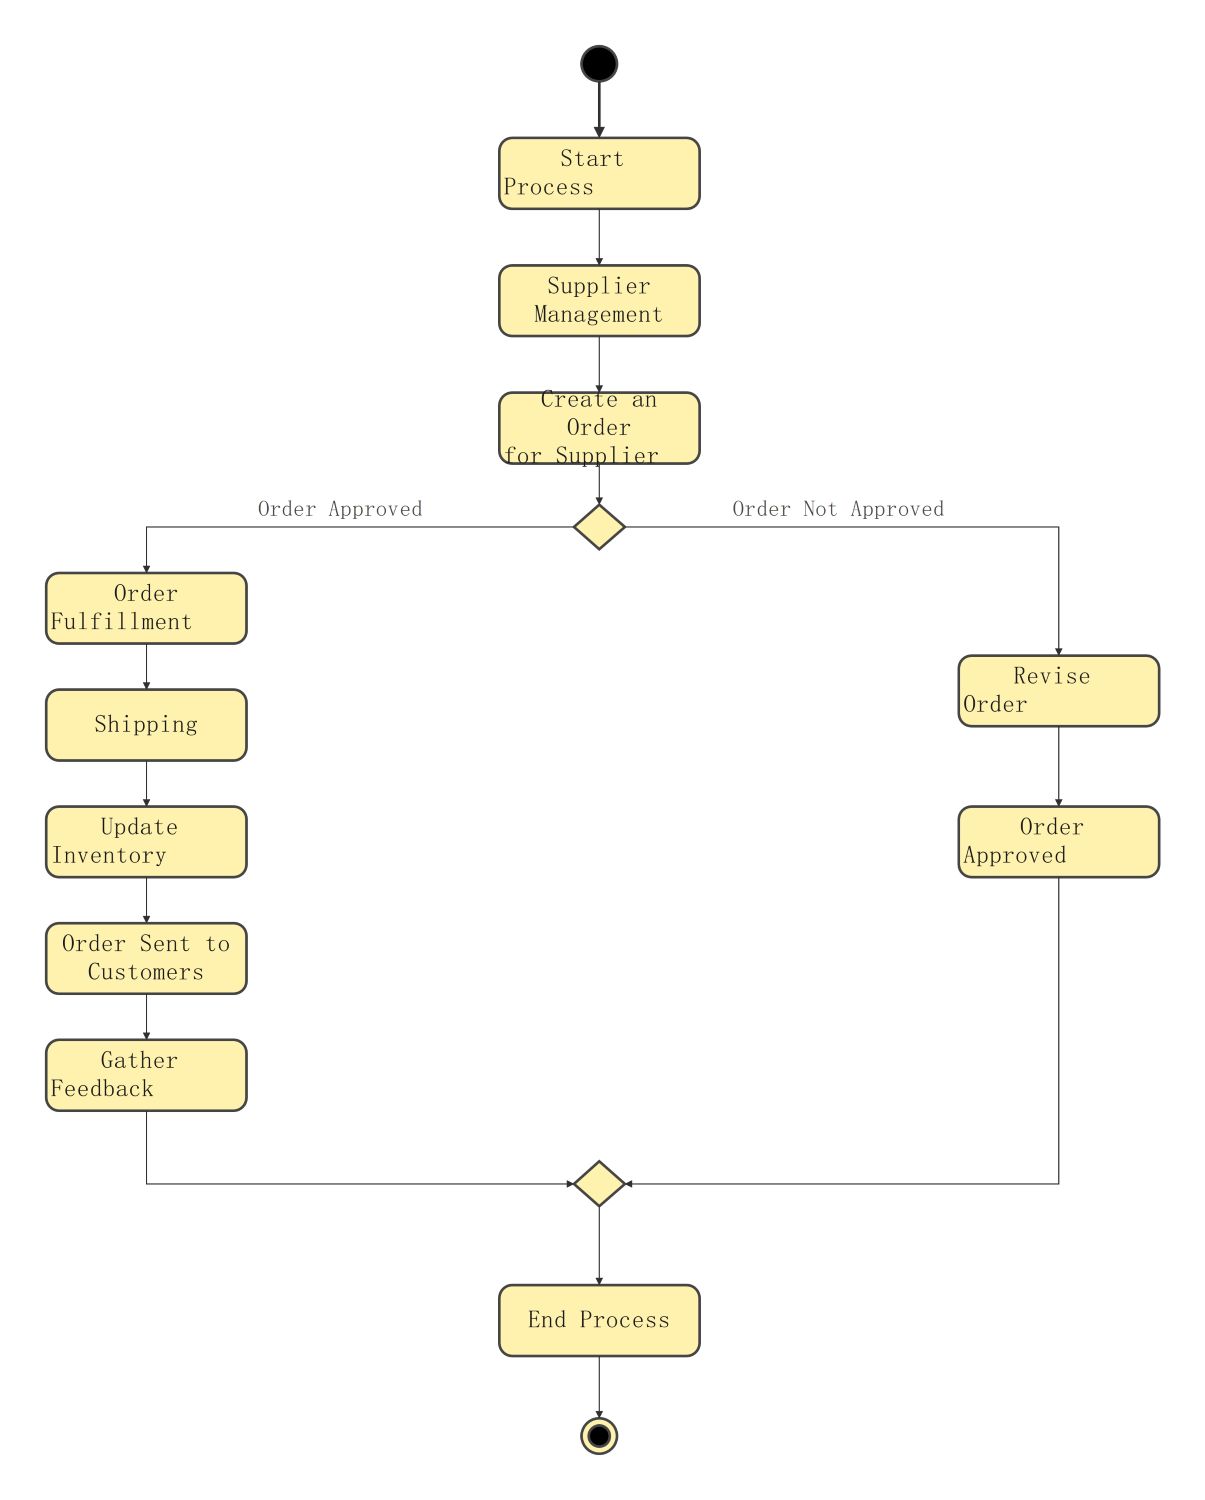
About this UML Activity Diagram for Business Analysis template
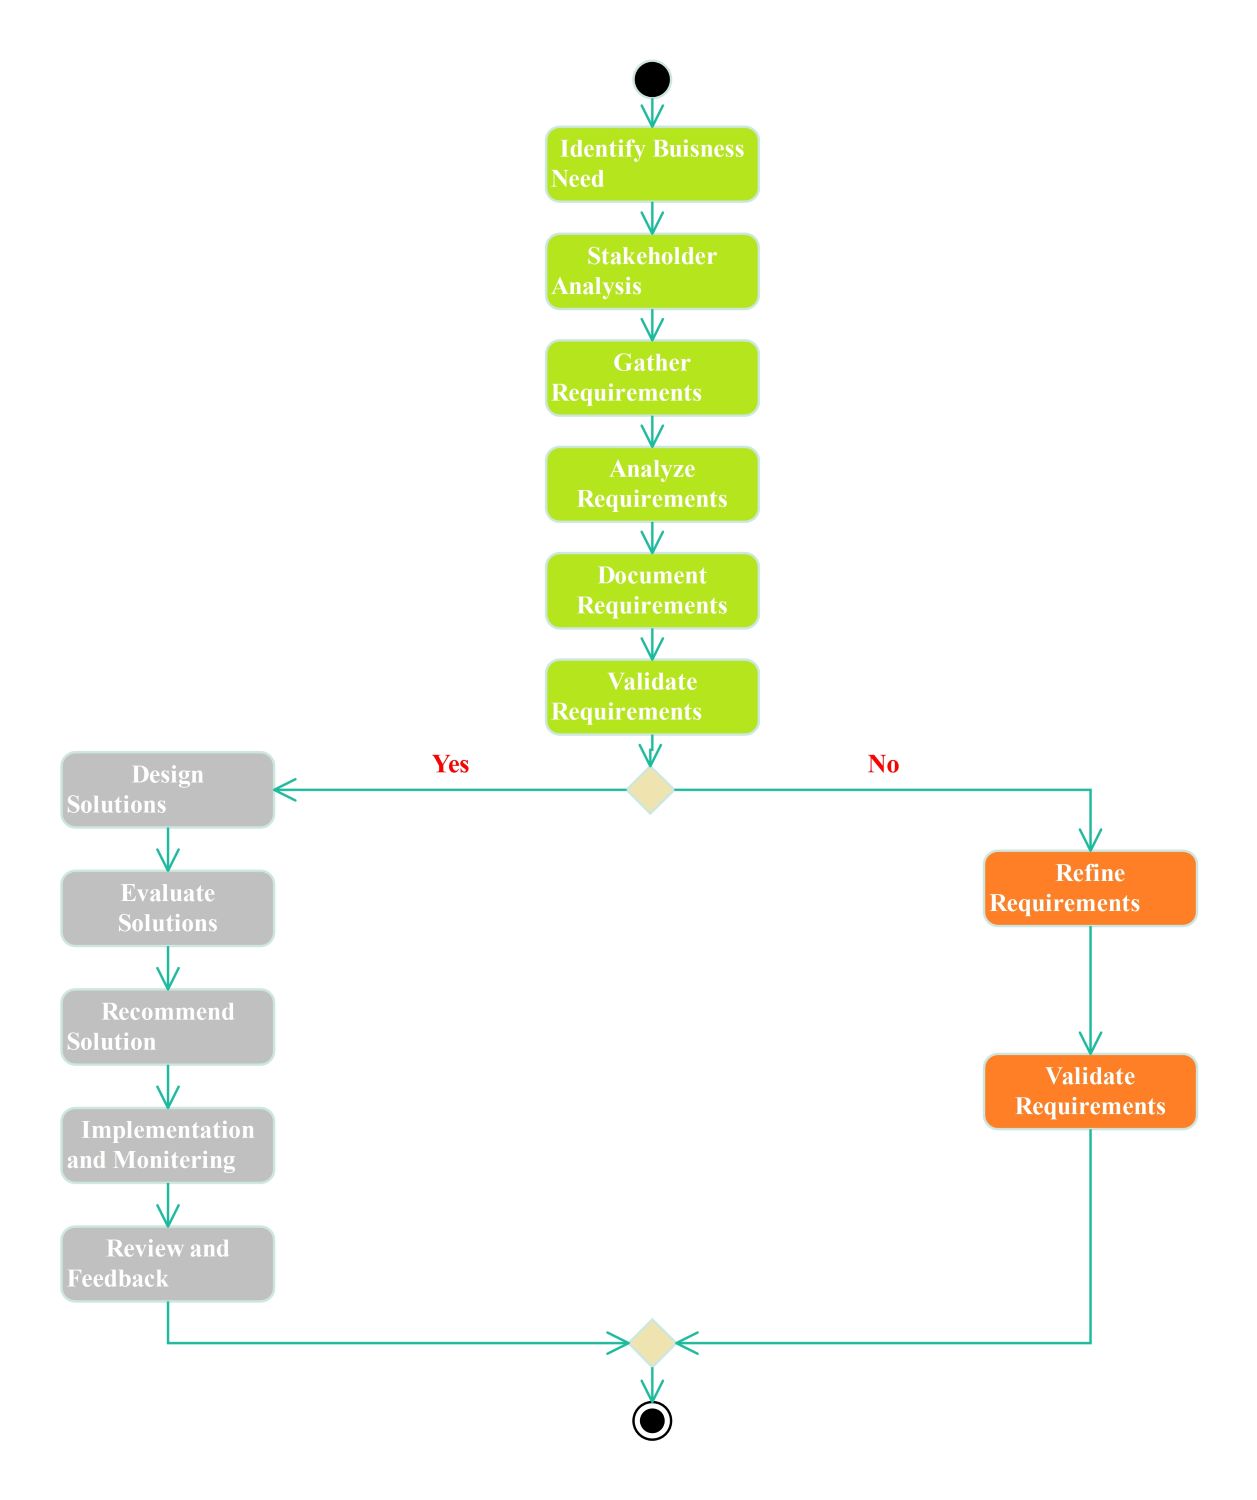
This template provides a clear roadmap for business analysis processes. It helps professionals visualize the sequential steps required to manage requirements and design effective solutions. Use this visual guide to streamline your project management and ensure consistency.
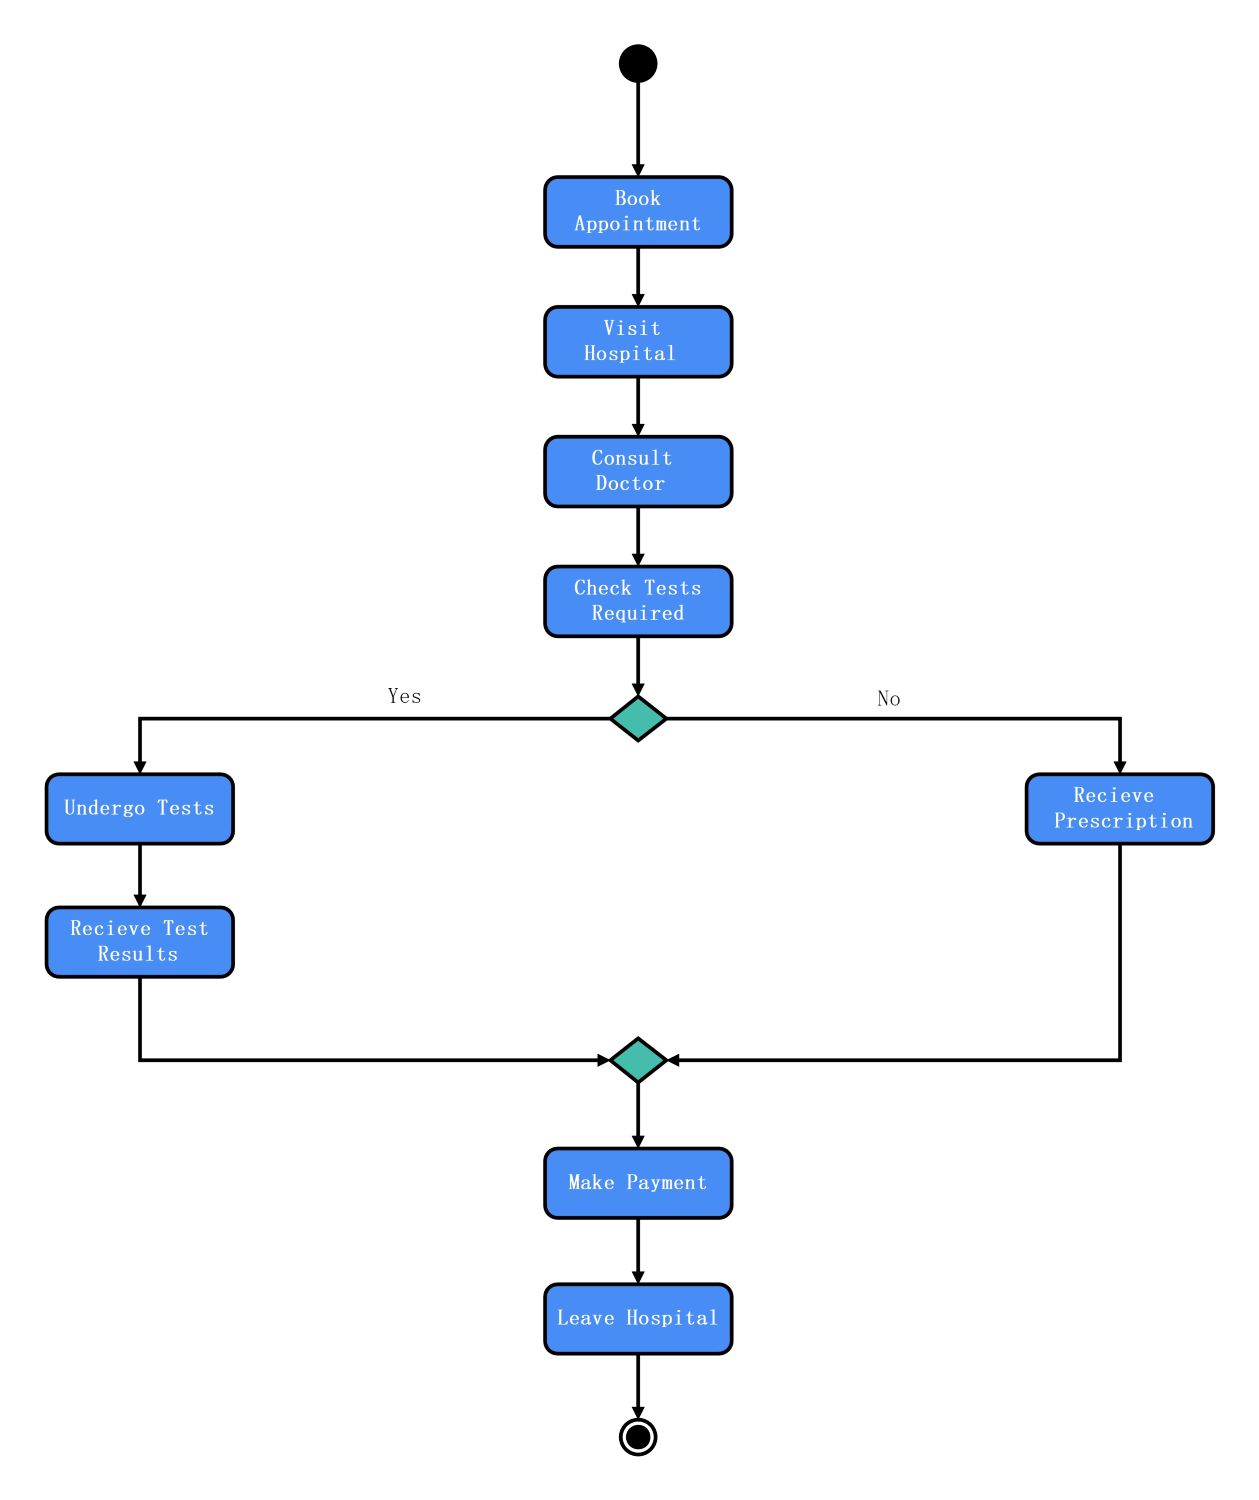
Requirement Planning and Validation
This initial phase focuses on identifying the core needs of the business and stakeholders. It establishes a solid foundation by gathering and analyzing critical data before moving forward with any technical or operational solutions.
- Identify Business Need
- Stakeholder Analysis
- Gather Requirements
- Analyze Requirements
- Document Requirements
- Validate Requirements
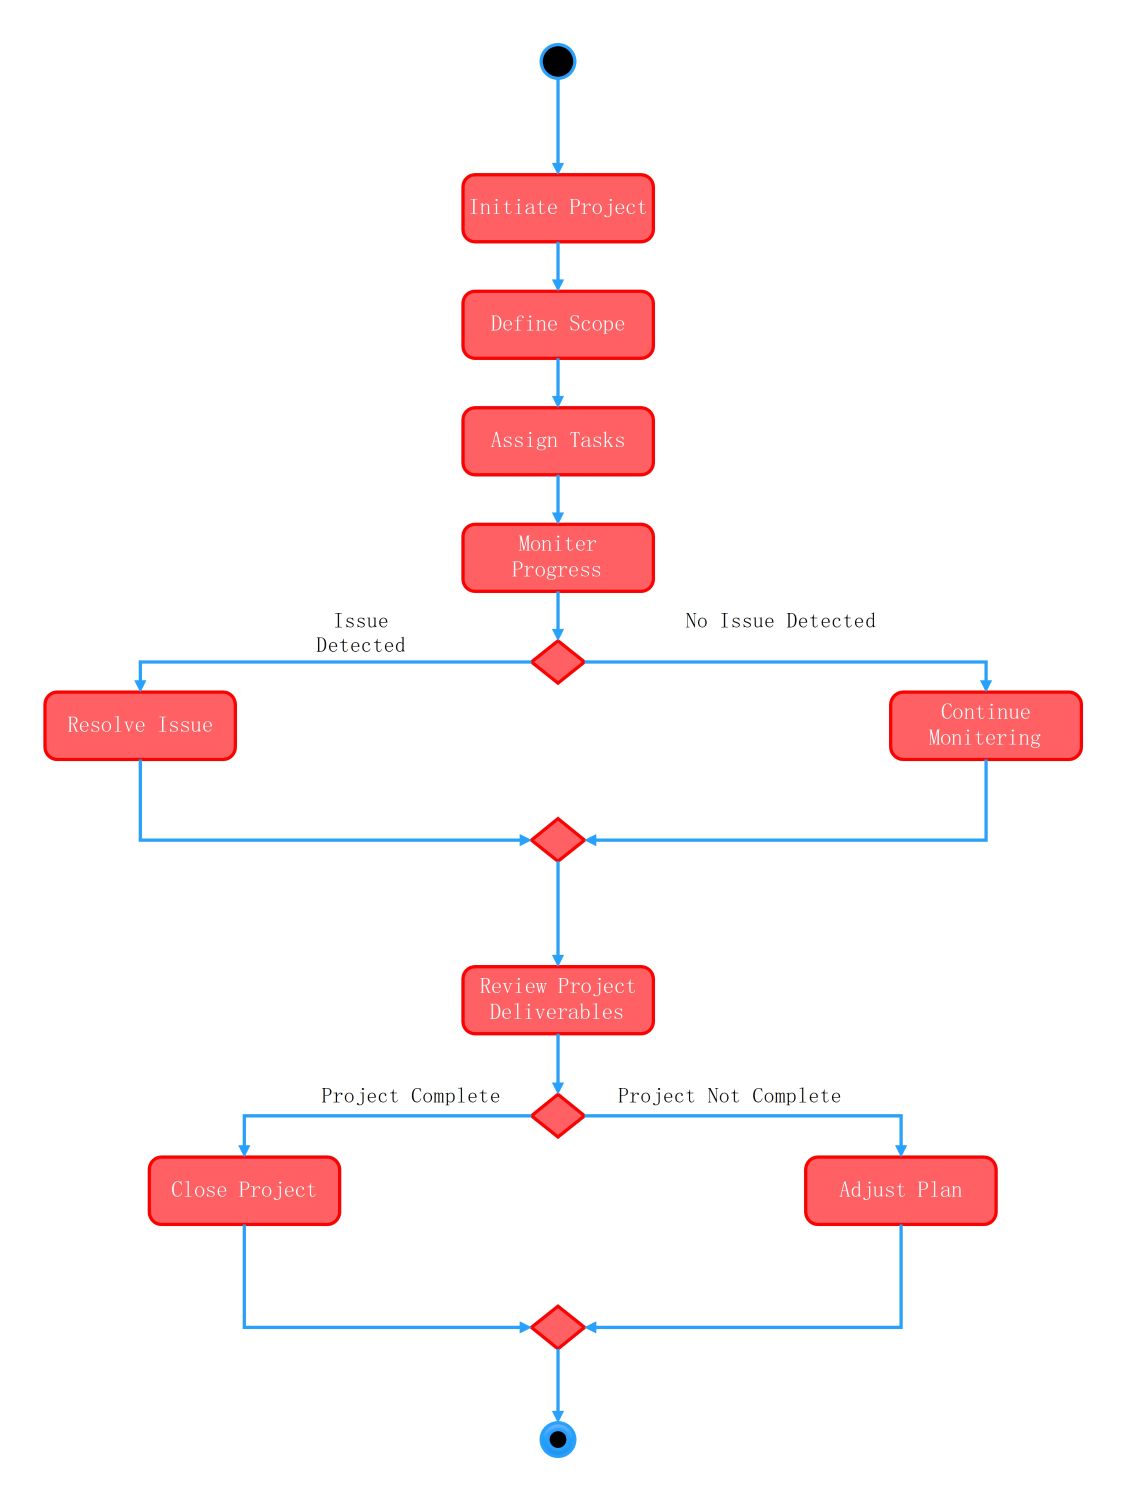
Requirement Refinement Process
When requirements do not meet the validation criteria, the process enters a refinement loop. This ensures that every detail is corrected and re-validated to prevent project failure or scope creep during later stages.
- Refine Requirements
- Validate Requirements
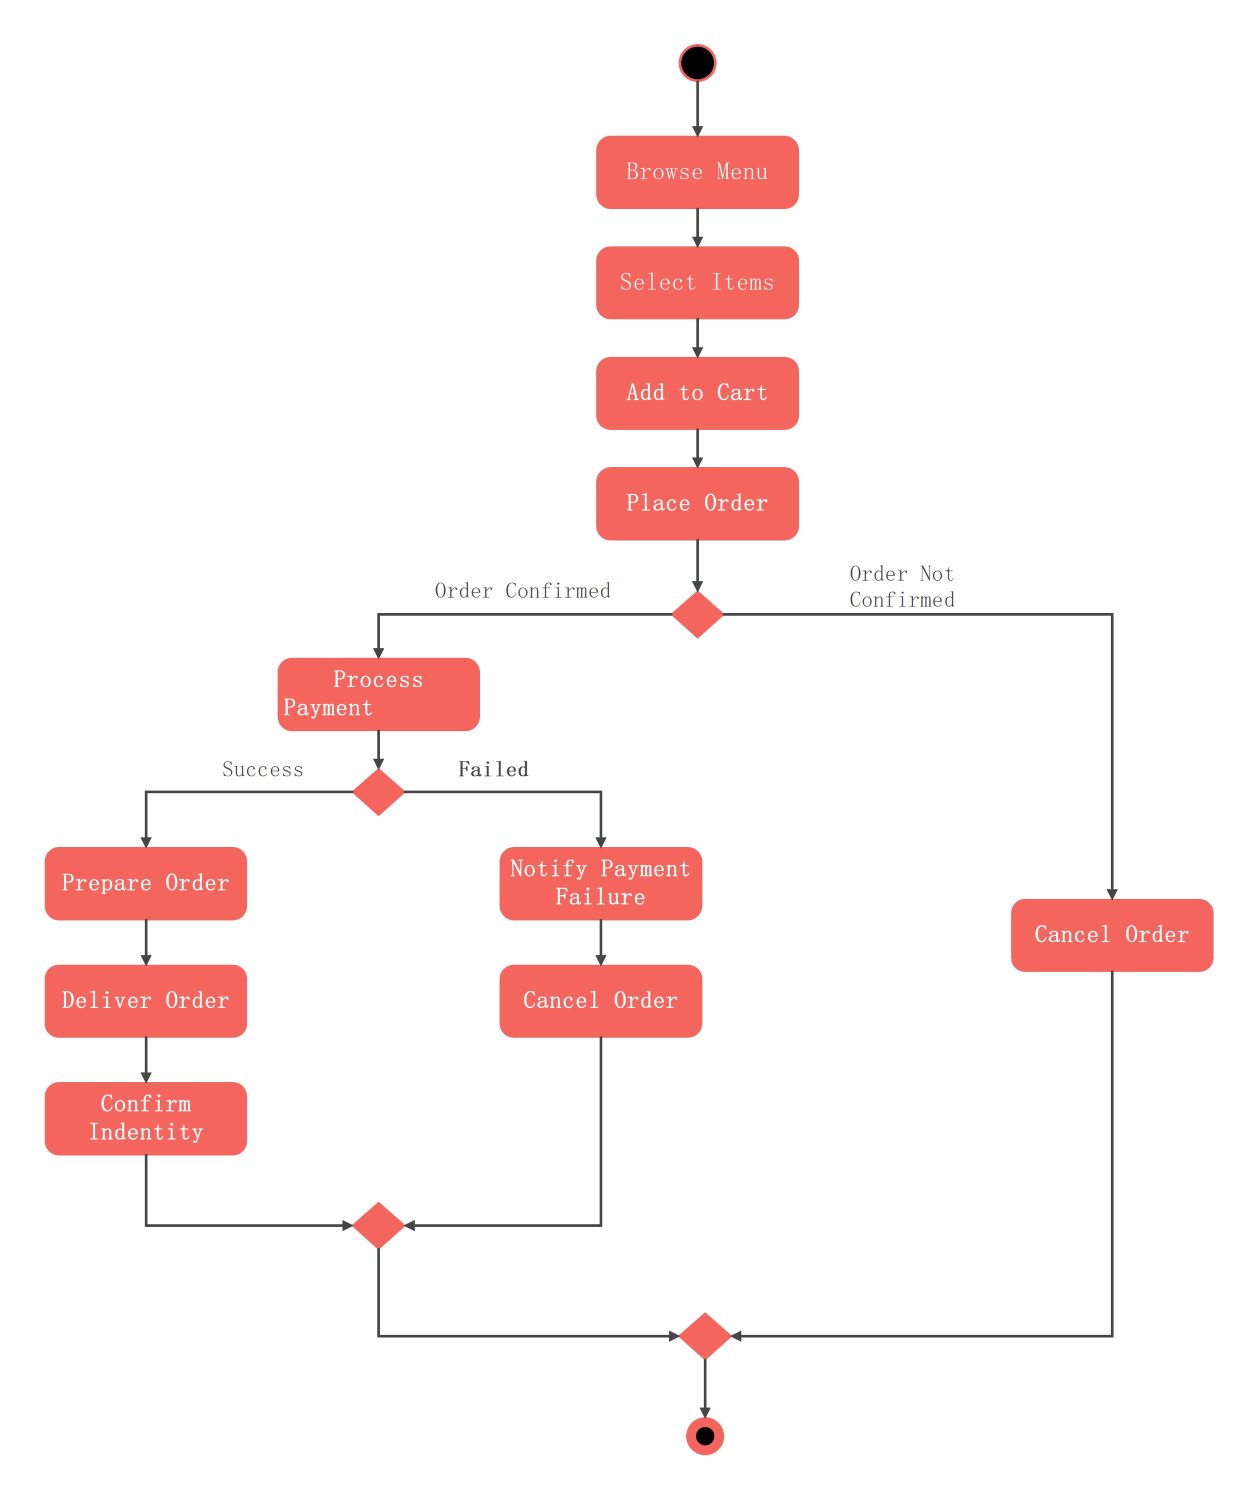
Solution Design and Implementation
Once requirements are validated, the focus shifts to creating and deploying the actual solution. This phase involves evaluating various options and monitoring the results to ensure the project meets the initial business objectives.
- Design Solutions
- Evaluate Solutions
- Recommend Solution
- Implementation and Monitoring
- Review and Feedback
FAQs about this Template
-
Why is a UML activity diagram used in business analysis?
A UML activity diagram is used in business analysis to visually represent the step-by-step flow of work. It helps analysts identify bottlenecks, decision points, and parallel processes. By mapping out activities like requirement gathering and validation, teams can ensure they follow a logic-driven path. This clarity reduces misunderstandings among stakeholders and improves the overall efficiency of the project lifecycle.
-
How do you handle failed requirement validation in this diagram?
If requirement validation fails, the diagram directs the user to a refinement loop. In this stage, the business analyst must revisit the documented needs and make necessary adjustments based on feedback. Once the refinements are complete, the requirements undergo validation again. This repetitive cycle ensures that the final solution design is based on accurate, high-quality information that meets business goals.
-
What are the main benefits of solution monitoring and feedback?
Implementation and monitoring are crucial for tracking the performance of a new solution. This stage allows business analysts to gather real-world data and user feedback. By reviewing this information, the team can determine if the implemented solution solved the original business problem. It also provides valuable insights for future updates or process improvements, ensuring the business continues to evolve effectively.