Gantt chart example for PowerPoint
Communicate project timelines with a free Gantt chart PowerPoint template.
- Templates
- Gantt chart templates
- Gantt chart for PowerPoint
About this template
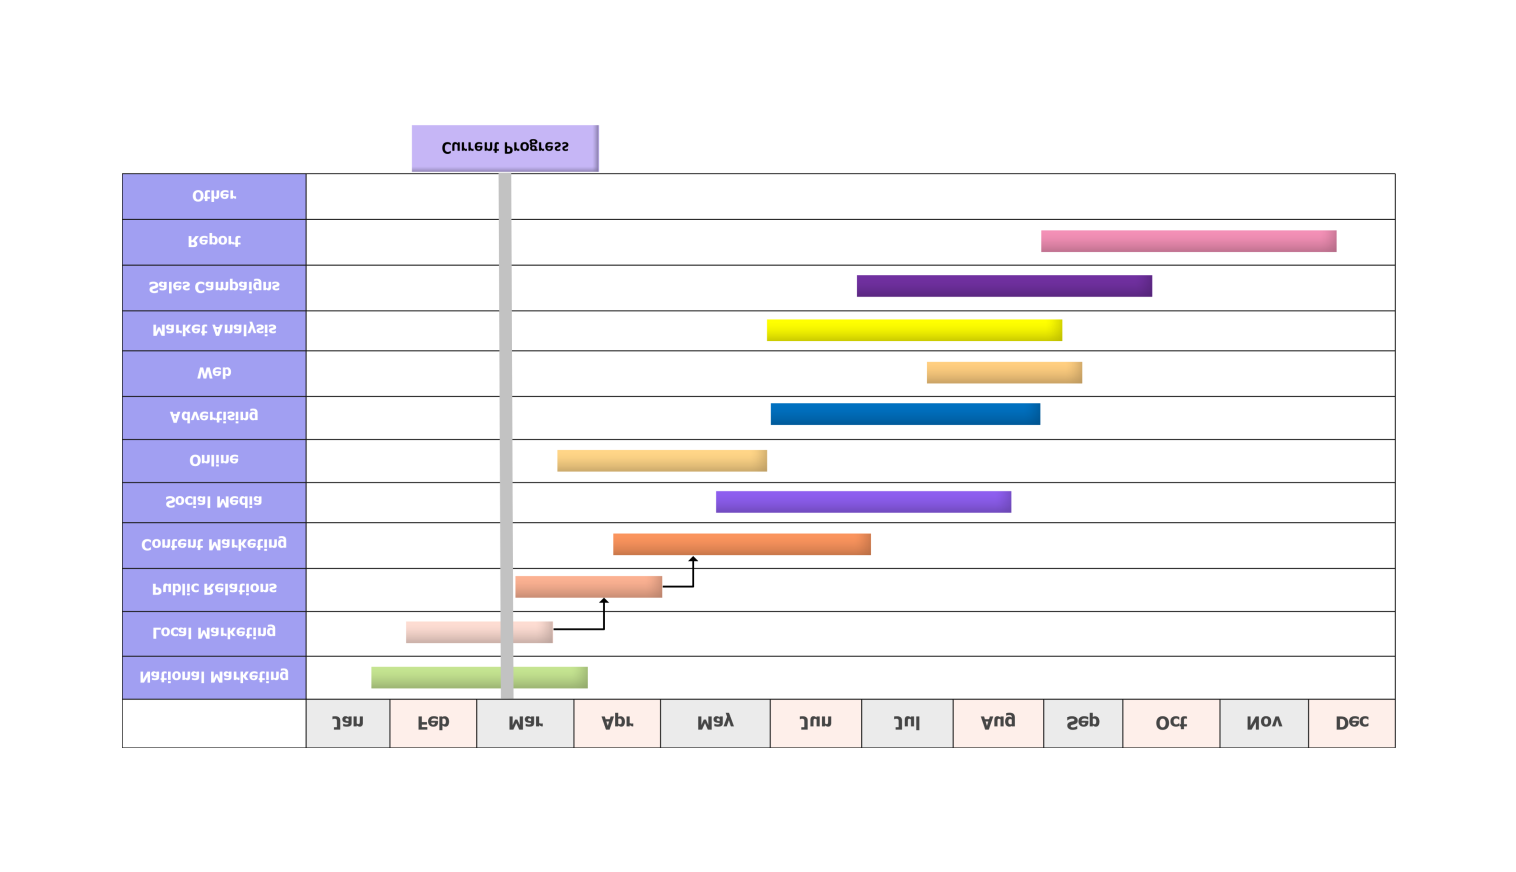
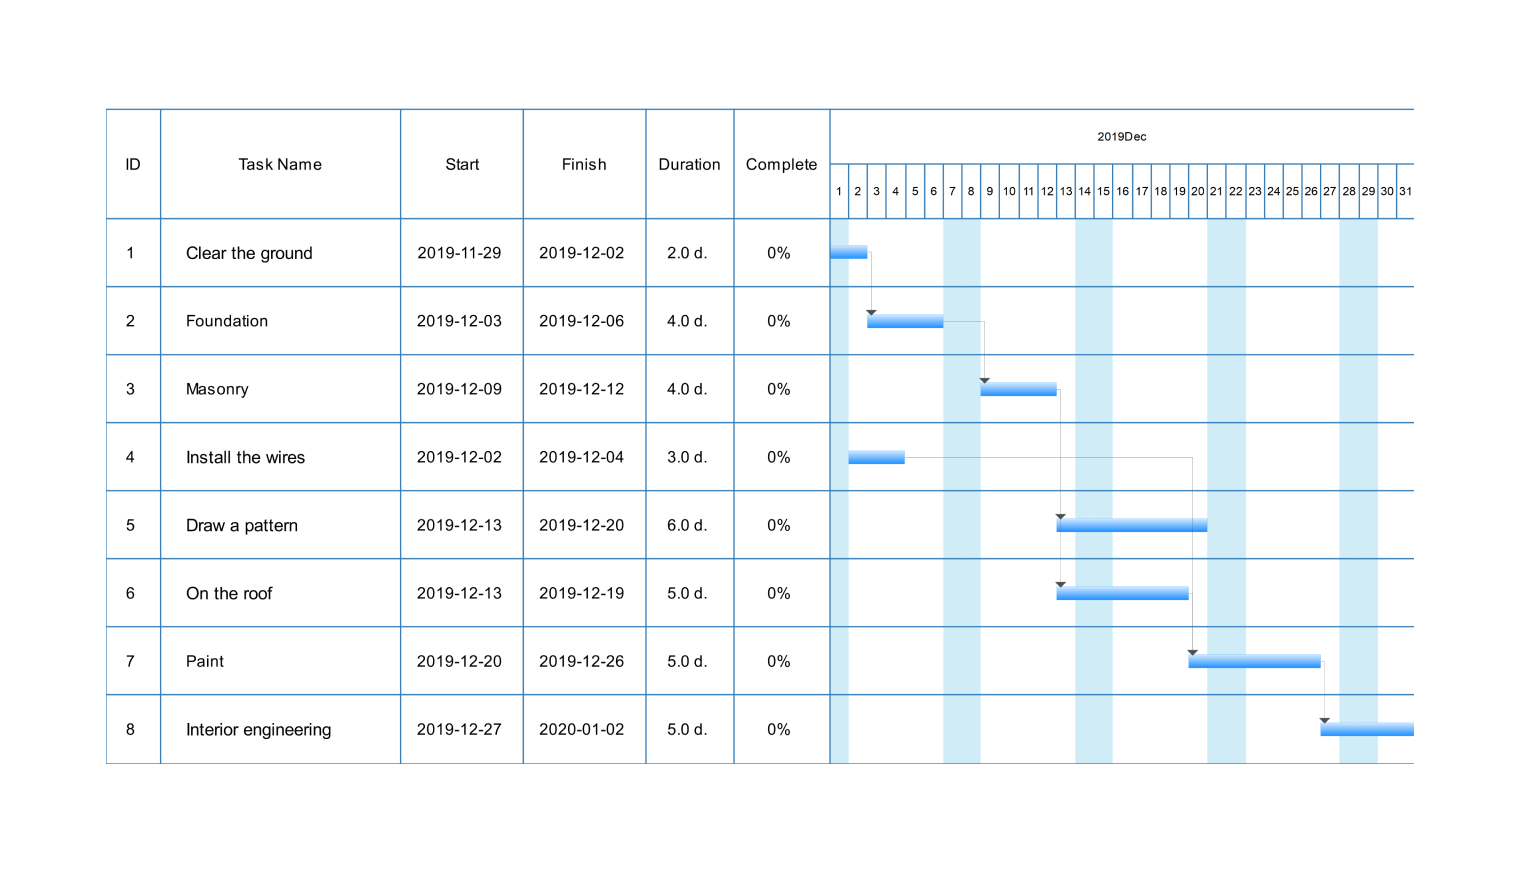
The Gantt chart for the PowerPoint template features a pre-formatted table on the left side of the slide. This column allows you to list your project tasks in chronological order.
Each task has a corresponding bar on the right side of the chart. The length of the bar visually represents the duration of the task. You can easily drag and adjust the bars to reflect your project schedule.
The left side of the bar indicates the start date and the right side indicates the end date. The timeline at the top of the chart provides a visual reference for the project timeframe.
How to use this template
Click Use this template.
Fill in the left side with your project tasks. Add or remove rows to fit your needs.
Click and drag the ends of the bars on the chart’s right side to adjust the duration of each task.
Use the formatting options within EdrawMax to change the colors and fonts. Add arrows on the table and chart to match your presentation theme.
Once you’ve customized the Gantt chart template to fit your project needs, save the file and export it as a PowerPoint file.
Benefits of the Gantt chart PowerPoint template
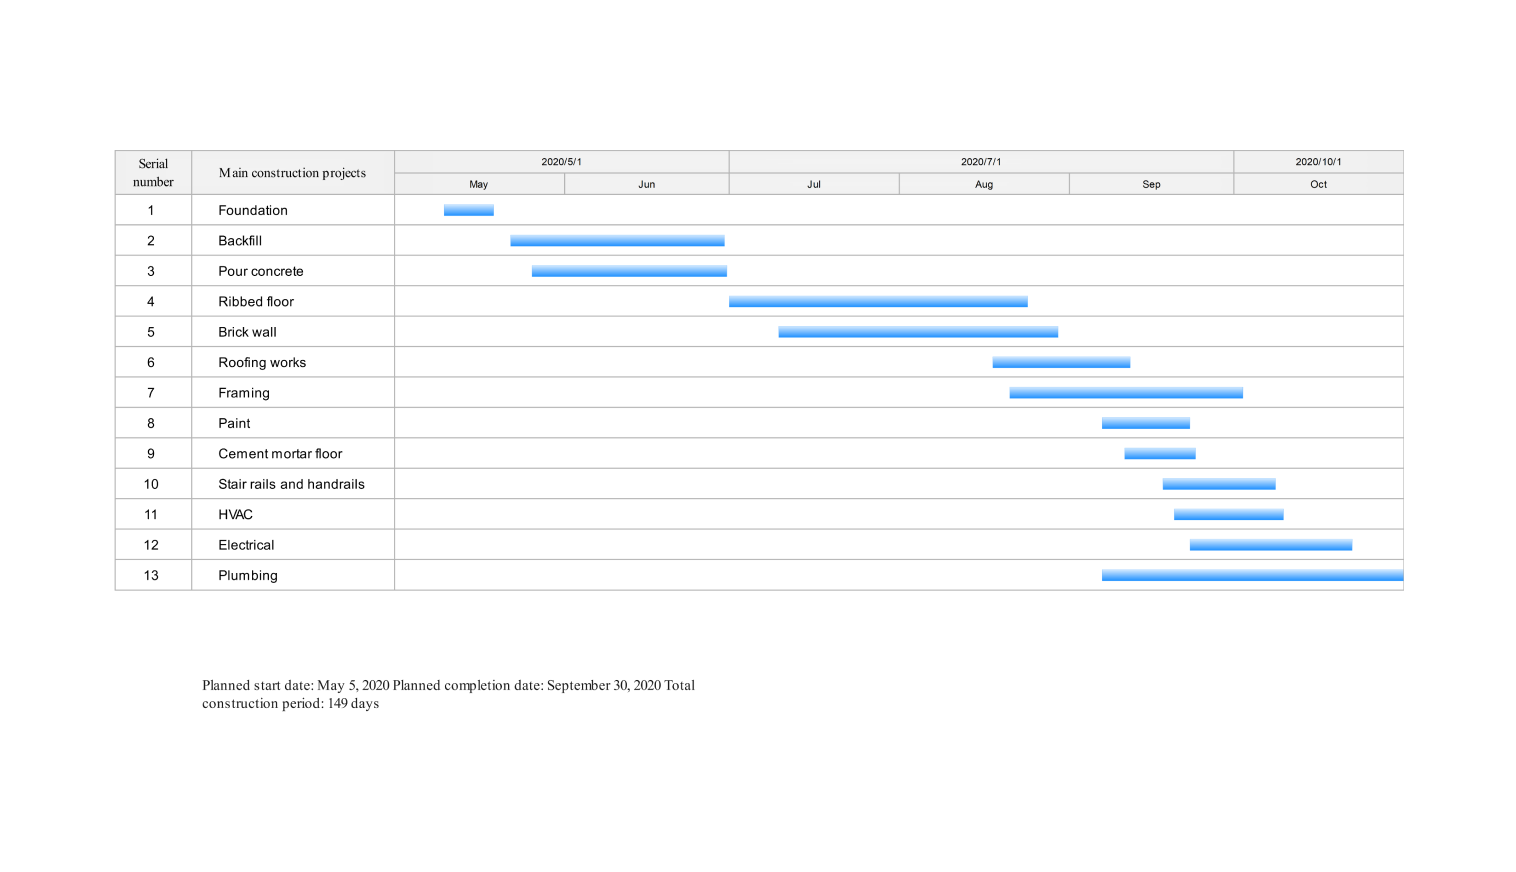
A Gantt chart PowerPoint template provides a pre-built framework for visualizing project schedules. The example above provides a layout that makes it easy to show project tasks, durations, and deadlines.
This is helpful because it saves you time and effort compared to building a Gantt chart from scratch. The template uses bars on a timeline to represent tasks, with lengths reflecting how long each will take. This allows viewers to identify potential scheduling conflicts immediately.
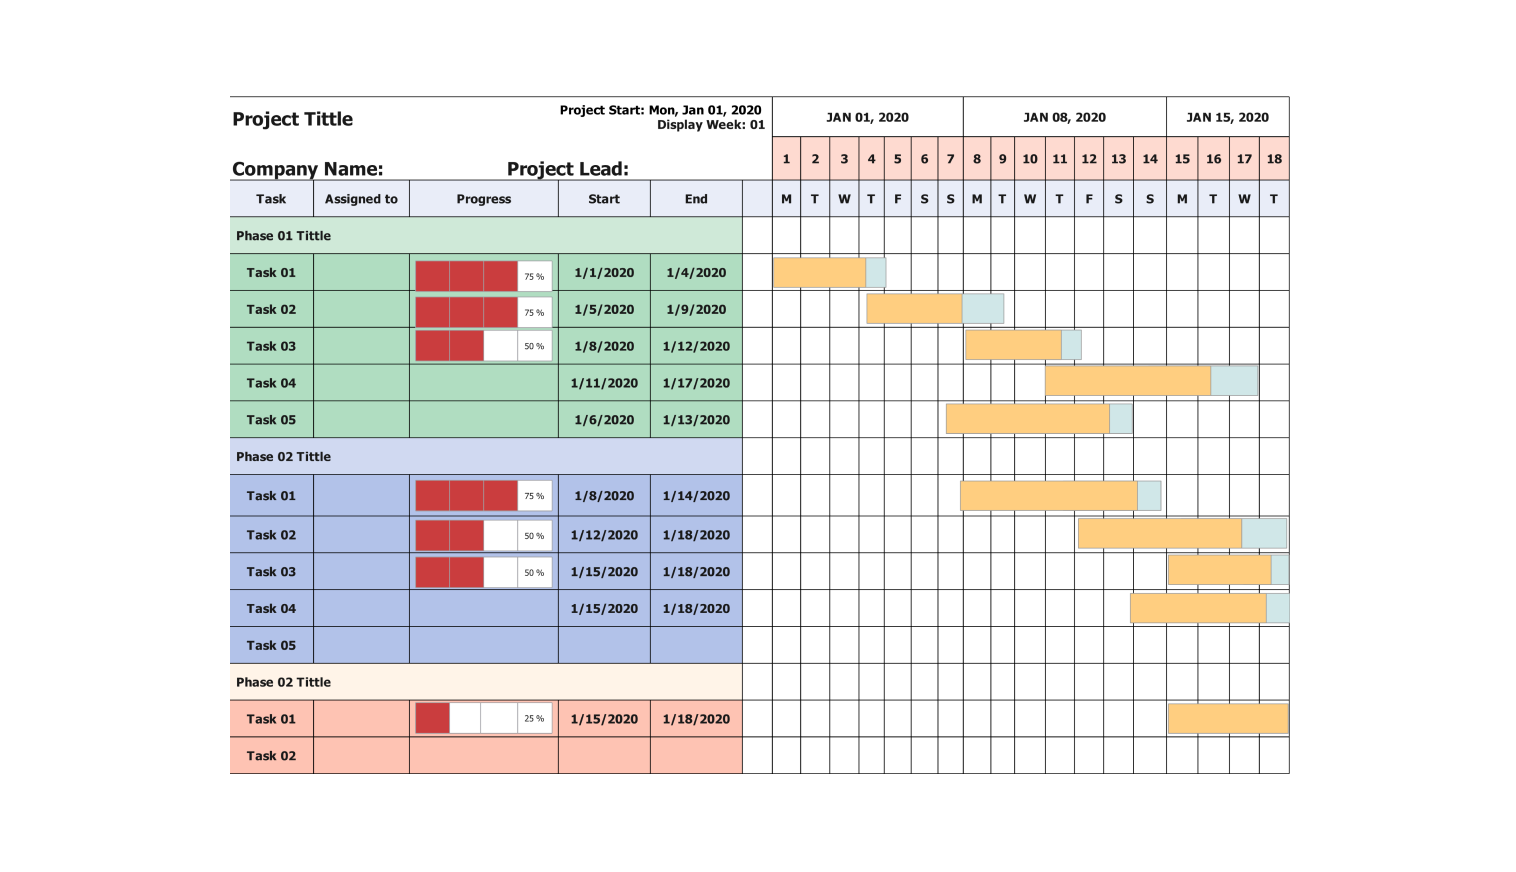
There are also Gantt chart shapes from EdrawMax, which allow you to show how much of each task is completed, keeping your audience informed on project advancement.
Frequently asked questions
-
What does Gantt stand for?Henry Gantt, a project management pioneer, is known by his last name, Gantt. He created the first chronological chart. Since then, the term has been frequently used to refer to these kinds of charts. In its simplest form, a Gantt chart is a horizontal bar chart that displays a project plan on a timetable.
-
What are the four key components of a Gantt chart?A Gantt chart consists of four primary elements: tasks, deadlines, dependencies, and completion. The project’s various actions are called tasks, and the timeline indicates when each task is scheduled to be completed.
-
Is the Gantt chart a timeline?A timeline provides a visual summary of events in chronological order. But if you need more detail, a Gantt chart is the way to go. It builds on a 2D chart by adding the duration of each task and showing how tasks depend on each other.
Related templates
Get started with EdrawMax today
Create 210 types of diagrams online for free.
Free Download Free Download Draw a diagram free Draw a diagram free Draw a diagram free