Simple Gantt chart
Get a clear picture of the project schedule with a free template.
- Templates
- Gantt chart templates
- Simple Gantt chart template
About this template
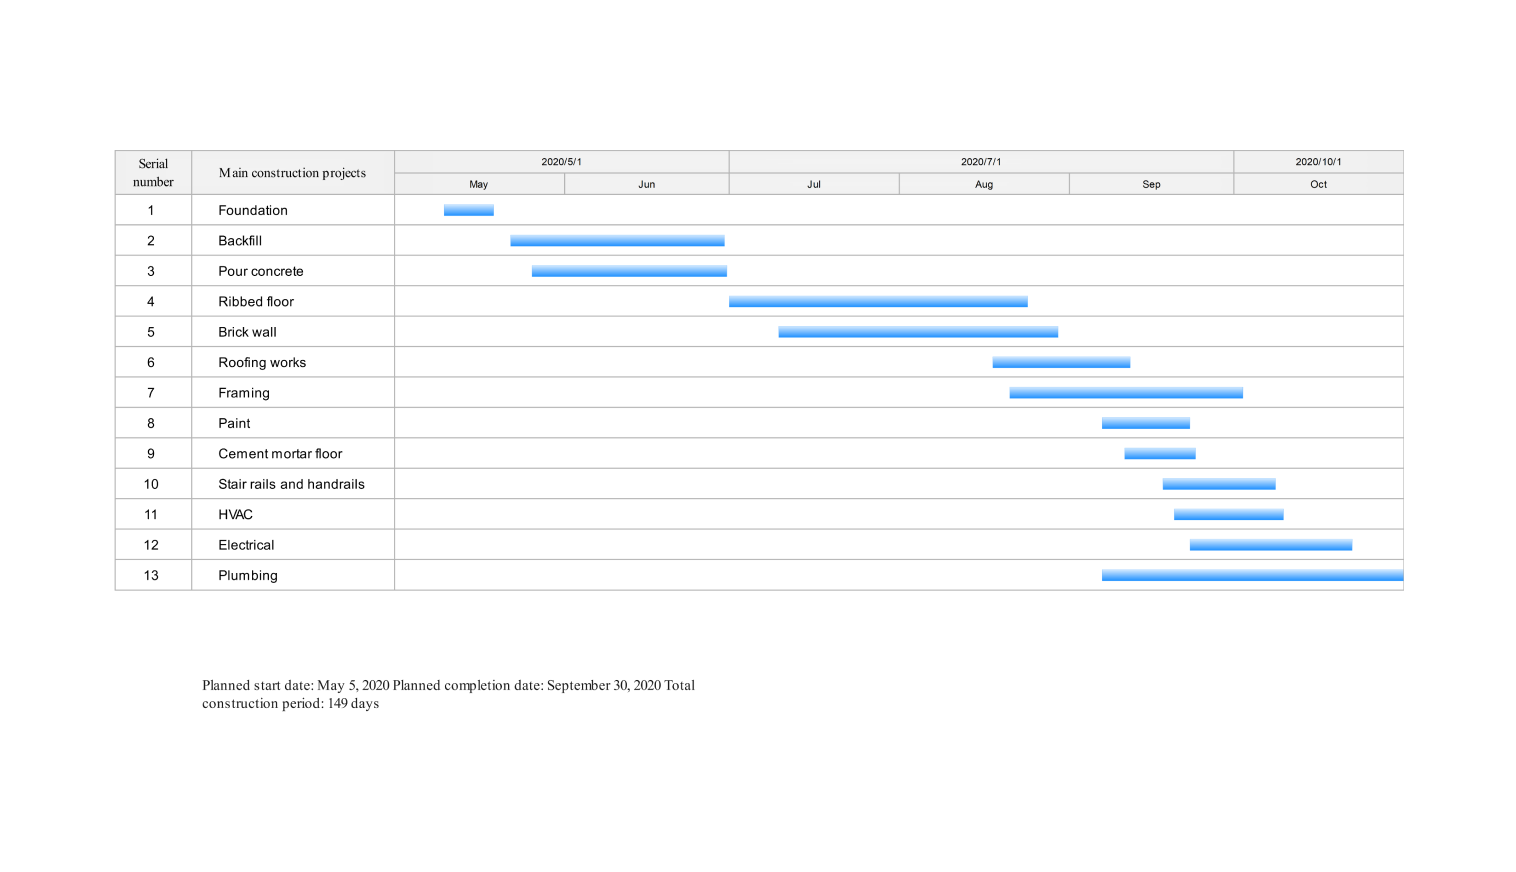
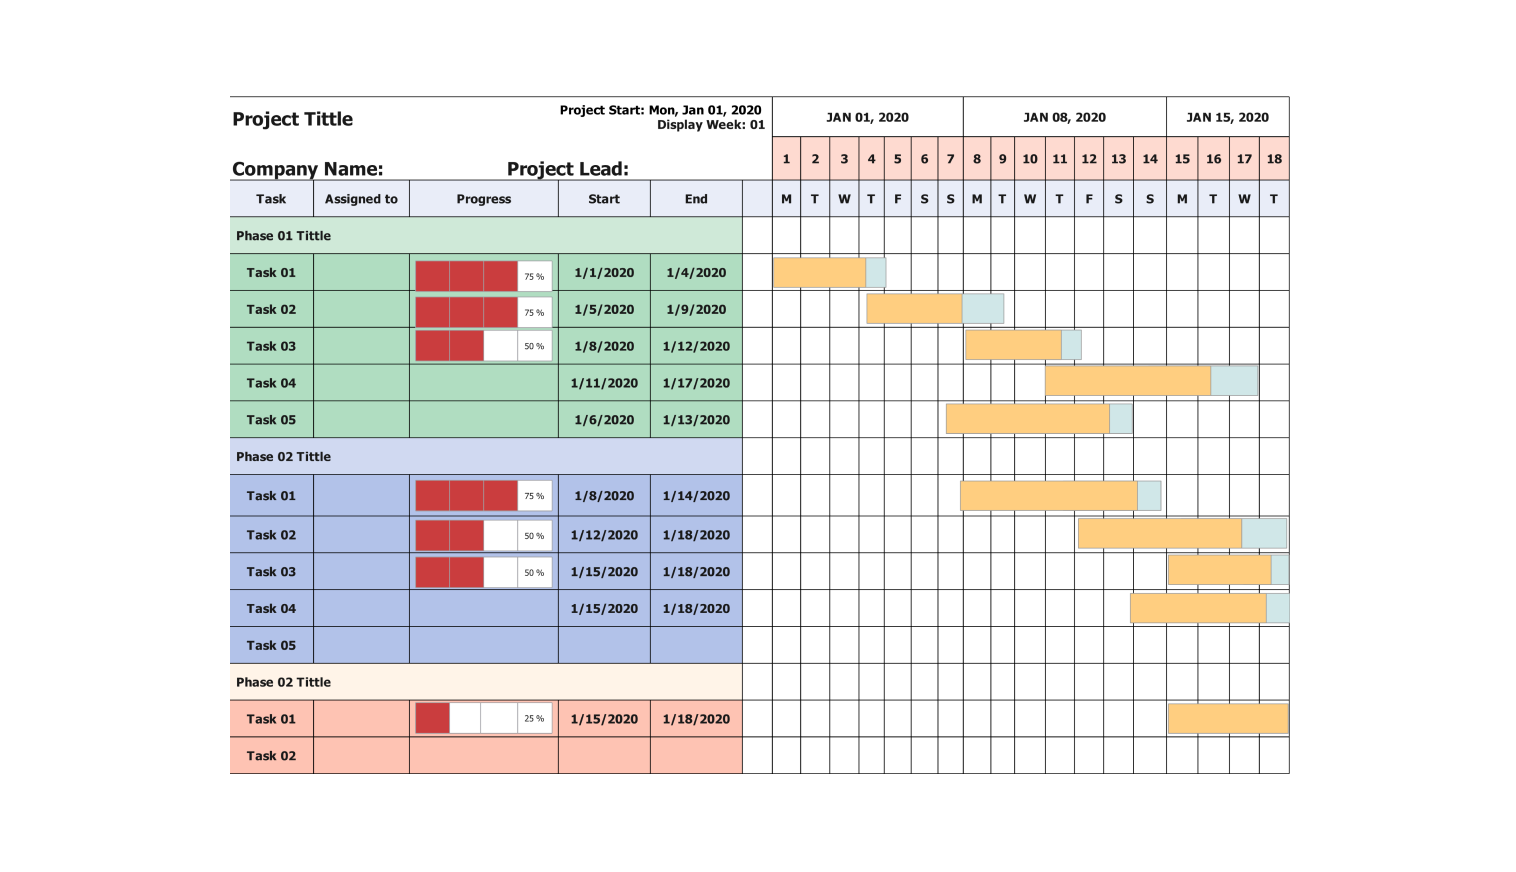
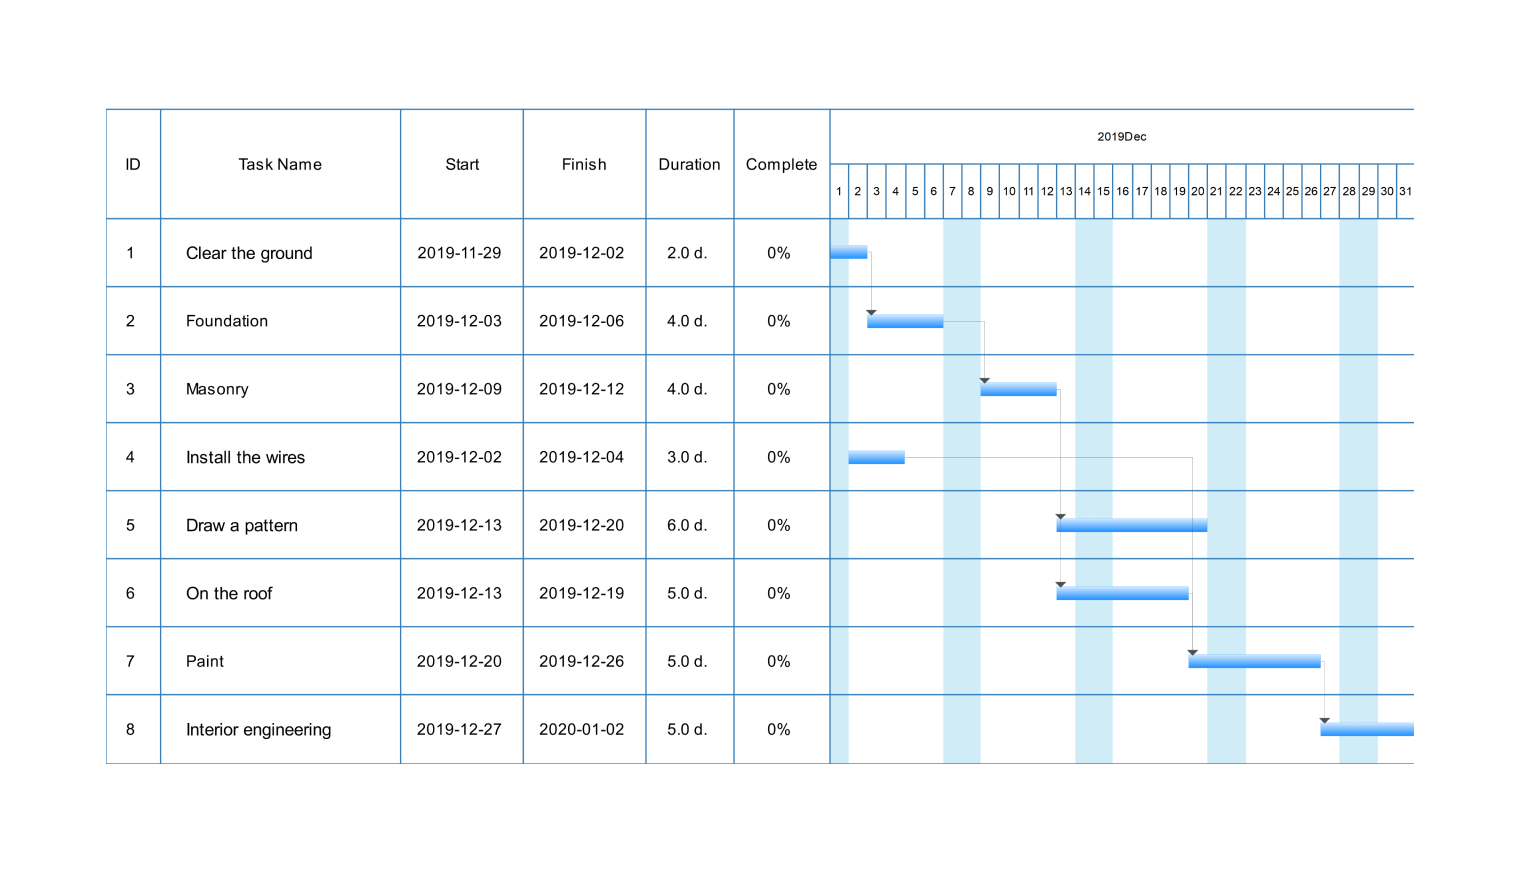
The simple Gantt chart template is a project management tool that illustrates a project schedule over time. It displays tasks in a table format and their start and end dates, duration, and completion percentage.
The length of the bar shows the amount of time the task takes to complete. Shading within the bar may indicate the percentage of the finished task.
For example, in the Gantt chart example, Task 1, “Clear the ground,” starts on November 29, 2019, and ends on December 2, 2019. The duration of this task is 2 days and is 0% complete. The longest task is drawing a pattern, which is expected to take six days.
How to use this template
Click Use this template.
Select a cell and use the floating toolbar to insert more tasks and edit Task Information. Use it to set up the Priority level, Start Date, End Date, and Duration.
Adjust the Gantt Chart View settings from the Overview in the floating toolbar.
Once you’ve entered all your tasks, you can customize the look of your Gantt chart by changing the Theme, fonts, and other elements.
After editing your Gantt chart, save it, export it as a Microsoft Office file, or share it with others.
Benefits of the construction Gantt chart template
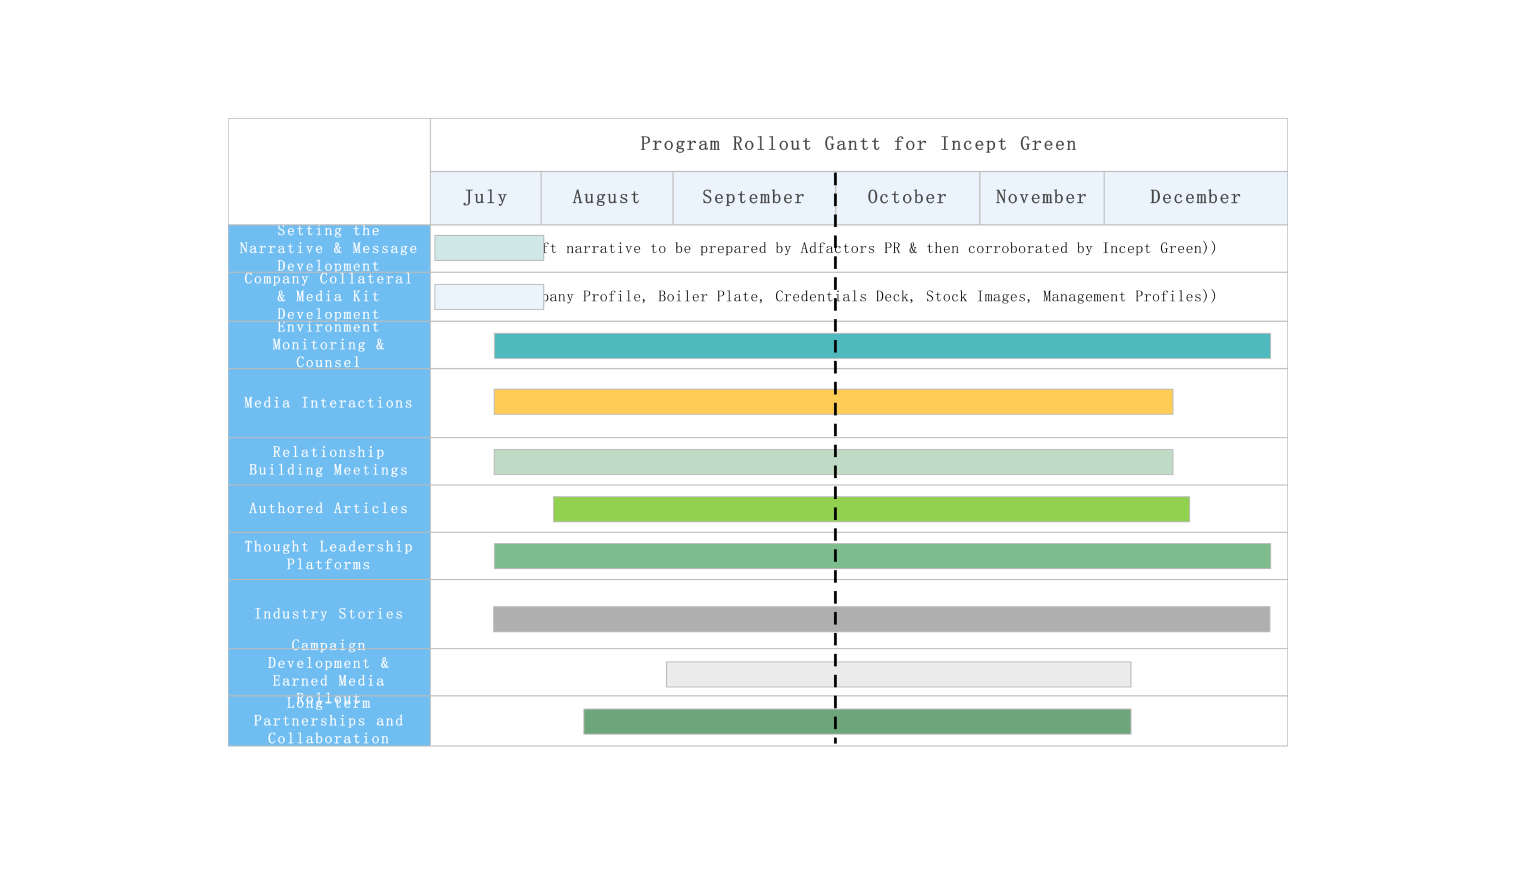
A Gantt chart helps you present your project schedule, ensuring everyone involved understands the tasks and their timing and identifies any potential bottlenecks.
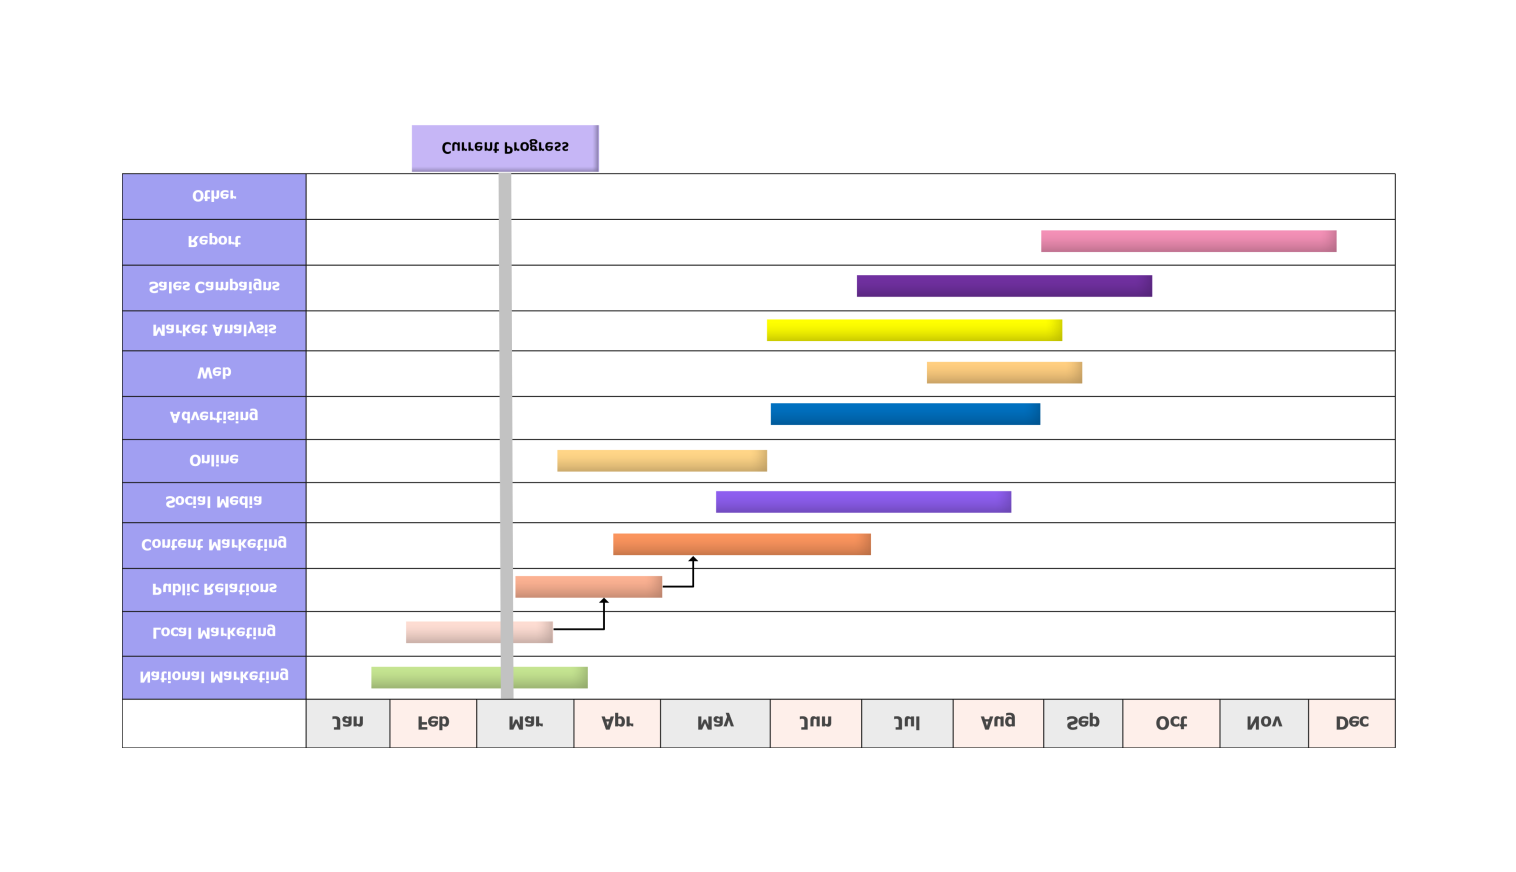
Next, a simple Gantt chart can also help you to identify dependencies between tasks. A dependency is a task that cannot start until another task is completed. By identifying dependencies, you can make sure your project is scheduled realistically and better manage your time and resources.
You can use a Gantt chart to track the progress of your project. As proceeding tasks, you can shade in the bars on the chart. This will help you to see how far you have come and how much work remains. This would also help the construction manager avoid project schedule delays.
Frequently asked questions
-
Can Excel create a Gantt chart?Even without a built-in Gantt chart type in Excel, you may still make one with free templates. With color-coded categories and visual cues to help you track project work, Microsoft 365 subscriptions include Gantt chart templates. You can also use EdrawMax free Gantt charts online and export them as an Excel file.
-
When not to use a Gantt chart?While Gantt charts can help visualize the project timeline, they shouldn’t be the first step in planning. Before creating a Gantt chart, you’ll need to understand the project scope, tasks, and dependencies. If your project has a lot of unknowns and the scope is constantly changing, a Gantt chart can become outdated quickly. Using a more flexible tool like a Kanban board might be better.
Related templates
Get started with EdrawMax today
Create 210 types of diagrams online for free.
Free Download Free Download Draw a diagram free Draw a diagram free Draw a diagram free