Construction Gantt chart
Plan and schedule construction projects with this free Gantt chart.
- Templates
- Gantt chart templates
- Construction Gantt chart template
About this template
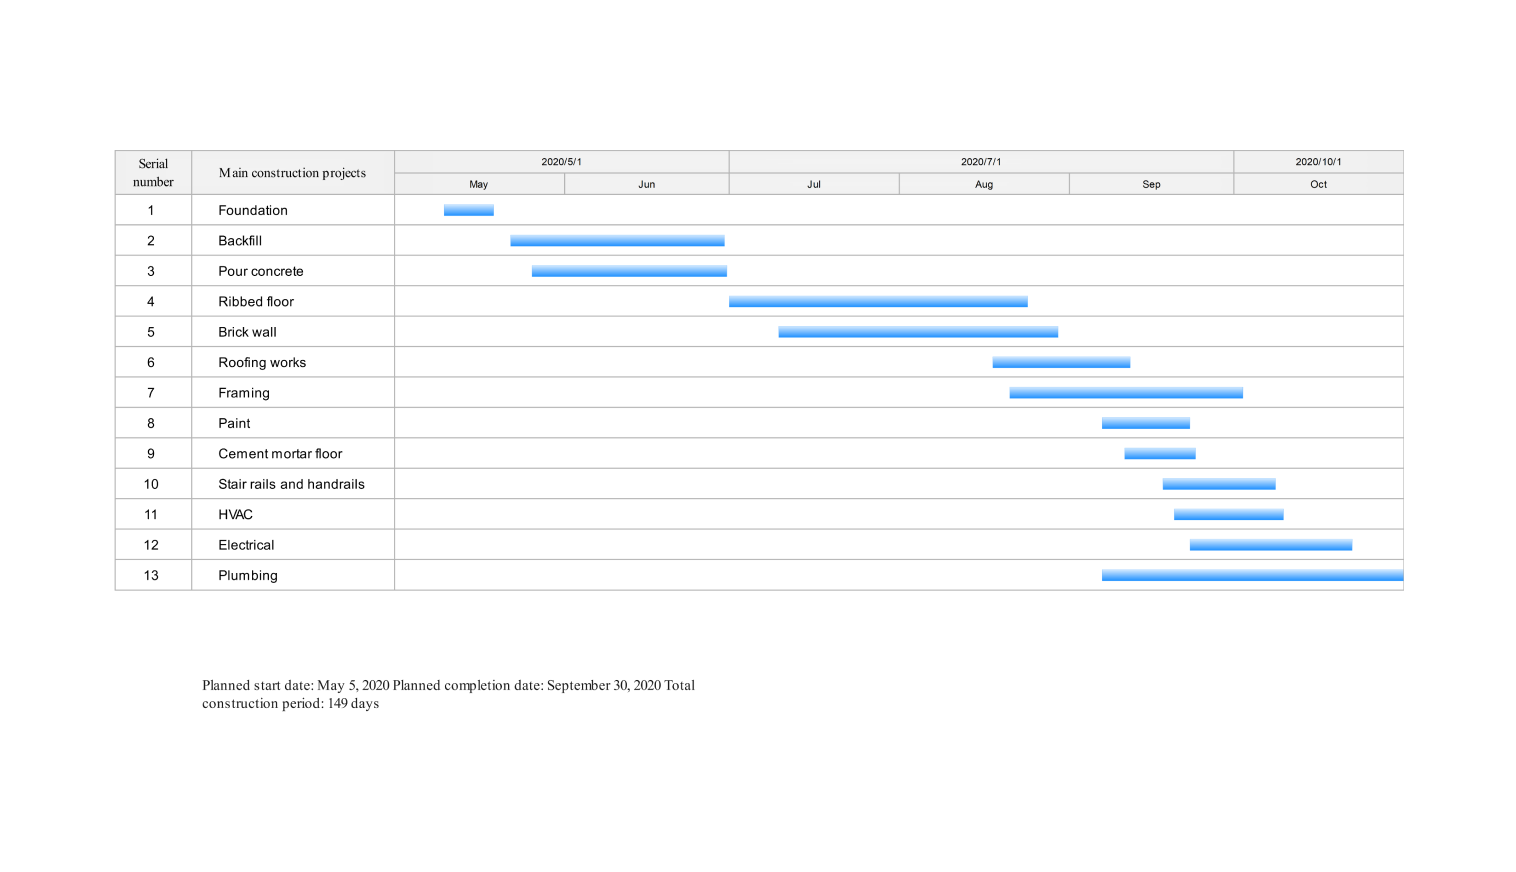
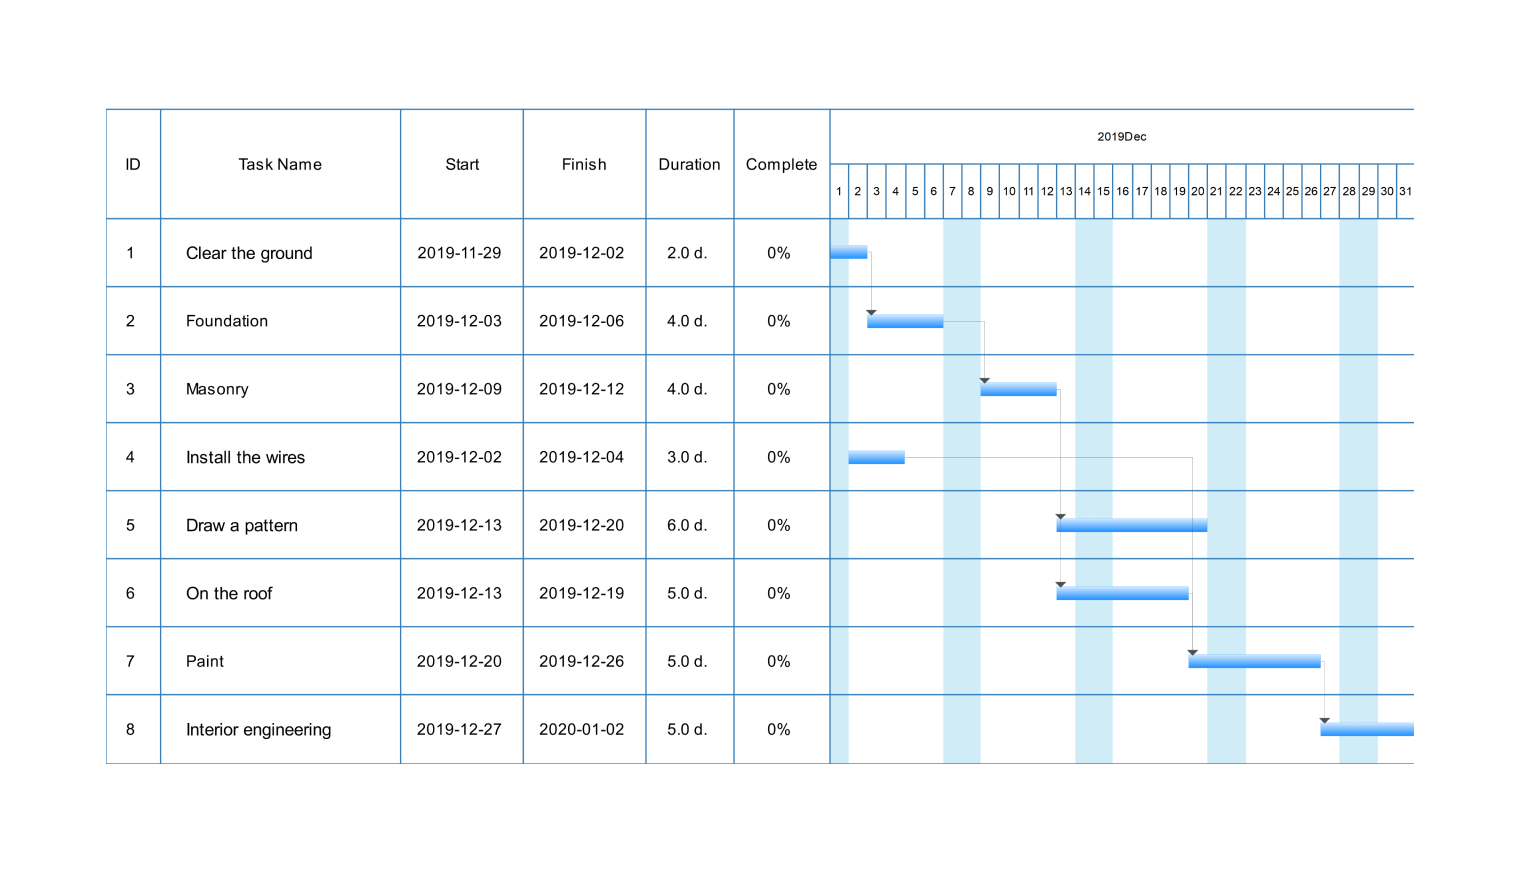
A construction Gantt chart uses horizontal bars to show project tasks. The left side of each bar marks the planned start date, and the bar’s length shows how long the task takes. This lets you see immediately when each part of the project is expected to begin and finish.
Tasks can be linked if one must be completed first. For instance, backfilling cannot be done until the foundation is laid. Though not shown here, these connections would be marked by arrows or indenting connected bars.
The chart can also show when tasks can happen at the same time. This is the case for tasks like HVAC installation, electrical work, and plumbing since they don’t depend on each other being finished first.
How to use this template
Click Use this template.
Edit the tasks in the table by clicking on them and typing in the new information.
Select a row in the construction Gantt chart and use the floating toolbar to Add Task, Add Subtask, insert Task Dependencies, and change the project schedule dates.
You can also use the AI Gantt chart analysis feature for Risk identification, which will help you better see redundant tasks, late schedules, and more.
Download and export the construction Gantt chart in various file formats, including PowerPoint, PDF, Excel, Word, etc.
Benefits of the construction Gantt chart template
The construction Gantt chart template breaks down the project into smaller, more manageable tasks. Breaking down the project into specific tasks with start and end dates helps identify potential delays. The Gantt chart also visually shows how tasks depend on each other, ensuring a logical workflow.
This clear view of the schedule improves communication between team members. Everyone involved can see what needs to be done and when, reducing confusion and missed deadlines. Then, a construction Gantt chart helps streamline your construction project‘s planning, scheduling, and communication, leading to a smoother and more successful build.
Visualizing costs alongside the schedule helps identify potential budget overruns early. If a task’s estimated cost seems high compared to the allocated schedule, you can explore cost-saving measures or adjust the schedule for better resource utilization.
Frequently asked questions
-
Is there a free Gantt chart template in Excel?There are free Gantt chart templates available for Excel. You can find them by searching for “Gantt chart template” on the Microsoft Office website or by searching the web for free downloadable templates. These templates will give you a basic framework to build your project schedule on.
-
Is there a Gantt chart template in Word?Microsoft Word doesn’t have built-in Gantt chart templates. But you can create a basic Gantt chart using a stacked bar chart and then format it. There are also free downloadable Gantt chart templates in EdrawMax that you can find online and open in a Word document.
-
What is the timeline of a construction project?Construction project timelines map out all the steps involved in building something, from the initial design to the final handover. These timelines are broken down into phases. Each phase acts as a stepping stone to the next, with clear milestones achieved along the way.
Related templates
Get started with EdrawMax today
Create 210 types of diagrams online for free.
Free Download Free Download Draw a diagram free Draw a diagram free Draw a diagram free