House building Gantt chart template
Keep house constructions on track with a Gantt chart template.
- Templates
- Gantt chart templates
- House building Gantt chart template
About this template
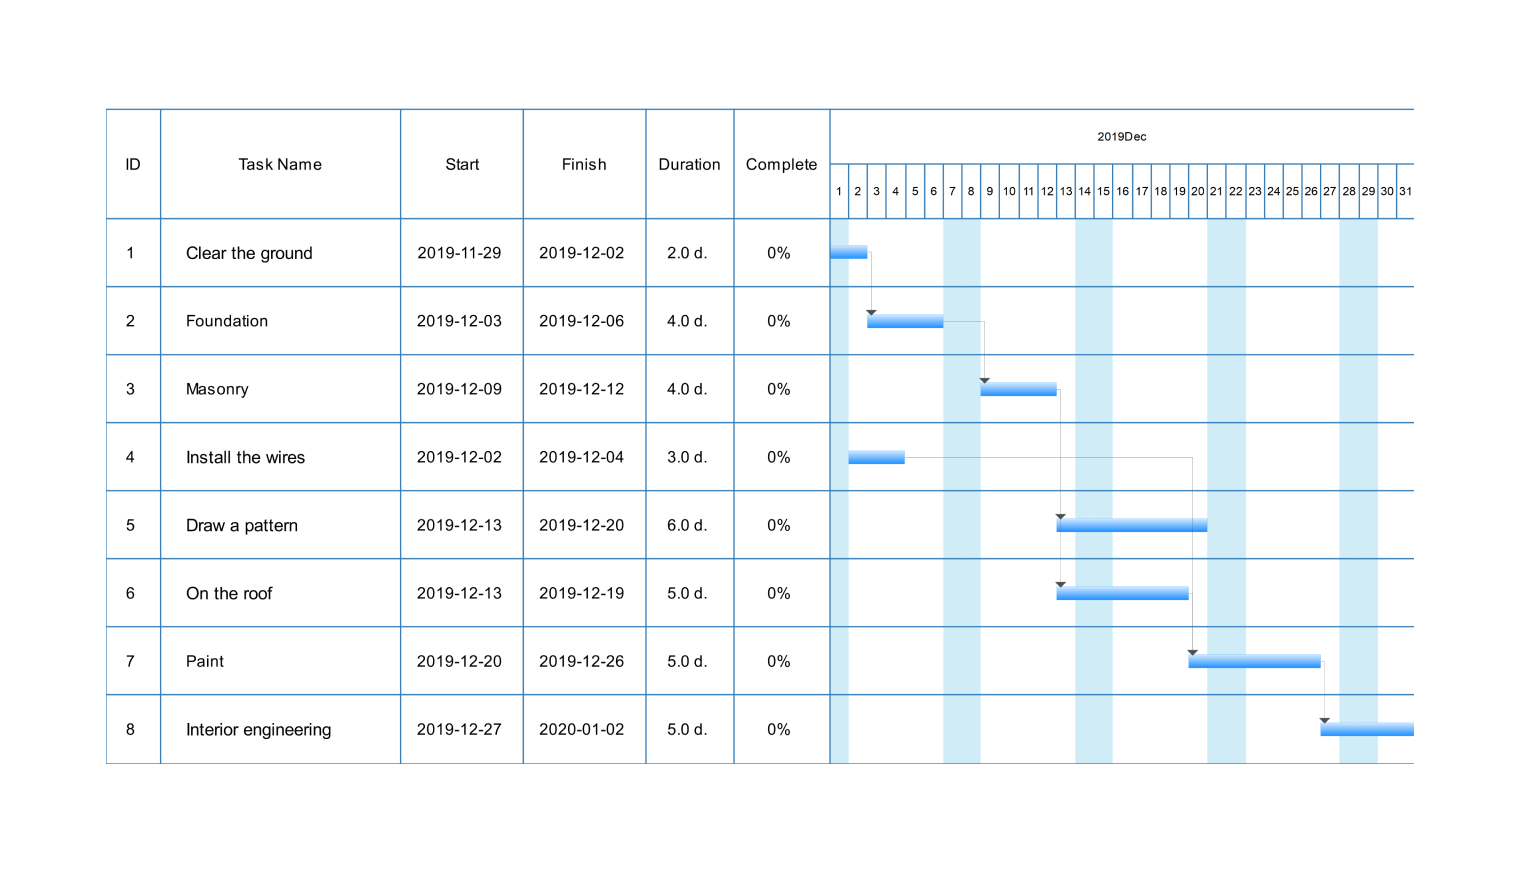
This template shows the tasks involved in building a house and the start and finish dates for each task. It also includes a column for the duration of each task, but it is not filled out in this Gantt chart.
The tasks are listed in the left column, including clearing the ground, laying the foundation, and painting. The timeline runs at the top of the chart and is divided into days.
Shading on the bars indicates the amount of time a task takes. None of the tasks have begun in this house building Gantt chart example.
How to use this template
Click Use this template.
Edit these directly or add new ones specific to the housing project by clicking on a task and modifying the text.
Click on a task bar and adjust its length on the timeline to reflect your estimated time for that task.
Select a row in the Gantt chart, then choose Task Dependencies on the floating toolbar to show which tasks must be completed before others can start.
Once you've customized the template to your project, click Export to download the chart as an image, HTML, or MS Office file (Excel, Word, PPT).
Benefits of the construction Gantt chart template
Creating a Gantt chart when planning to build a house results in improved communication. A visual timeline makes it clear to everyone involved in the project what needs to be done and when. This fosters better collaboration between homeowners, contractors, and subcontractors.
Next, this house-building Gantt chart template helps you spot potential delays in construction projects. It shows you which tasks depend on others being finished first. This way, you can see if there's a chance of getting stuck waiting on something before you can move forward.
Seeing the entire project from start to finish also helps. By laying everything out, you can anticipate problems before they happen. This allows you to take steps to avoid them altogether. Also, knowing the list of tasks helps you prioritize which ones to do first and how to use your workers and equipment best.
Frequently asked questions
-
How do I create a Gantt chart in Google Sheets?Building a Gantt chart in Google Sheets is easy. First, list your tasks and their start dates. Then, calculate the duration for each task. You can use a stacked bar chart to visualize the data. Finally, customize the chart to make the start and end dates clear.
-
What are the 7 important elements of a Gantt chart?A Gantt chart breaks down the project into tasks, showing their priority level, and start and end dates. Lines link tasks to show dependencies, ensuring the right order. Each task has a duration estimate, and milestones mark important progress points. A Gantt chart may also include the ongoing progress, timelines, and critical path.
Related templates
Get started with EdrawMax today
Create 210 types of diagrams online for free.
Free Download Free Download Draw a diagram free Draw a diagram free Draw a diagram free