Project Gantt chart template
Plan, schedule, and track projects with a free Gantt chart.
- Templates
- Gantt chart templates
- Project Gantt chart template
About this template
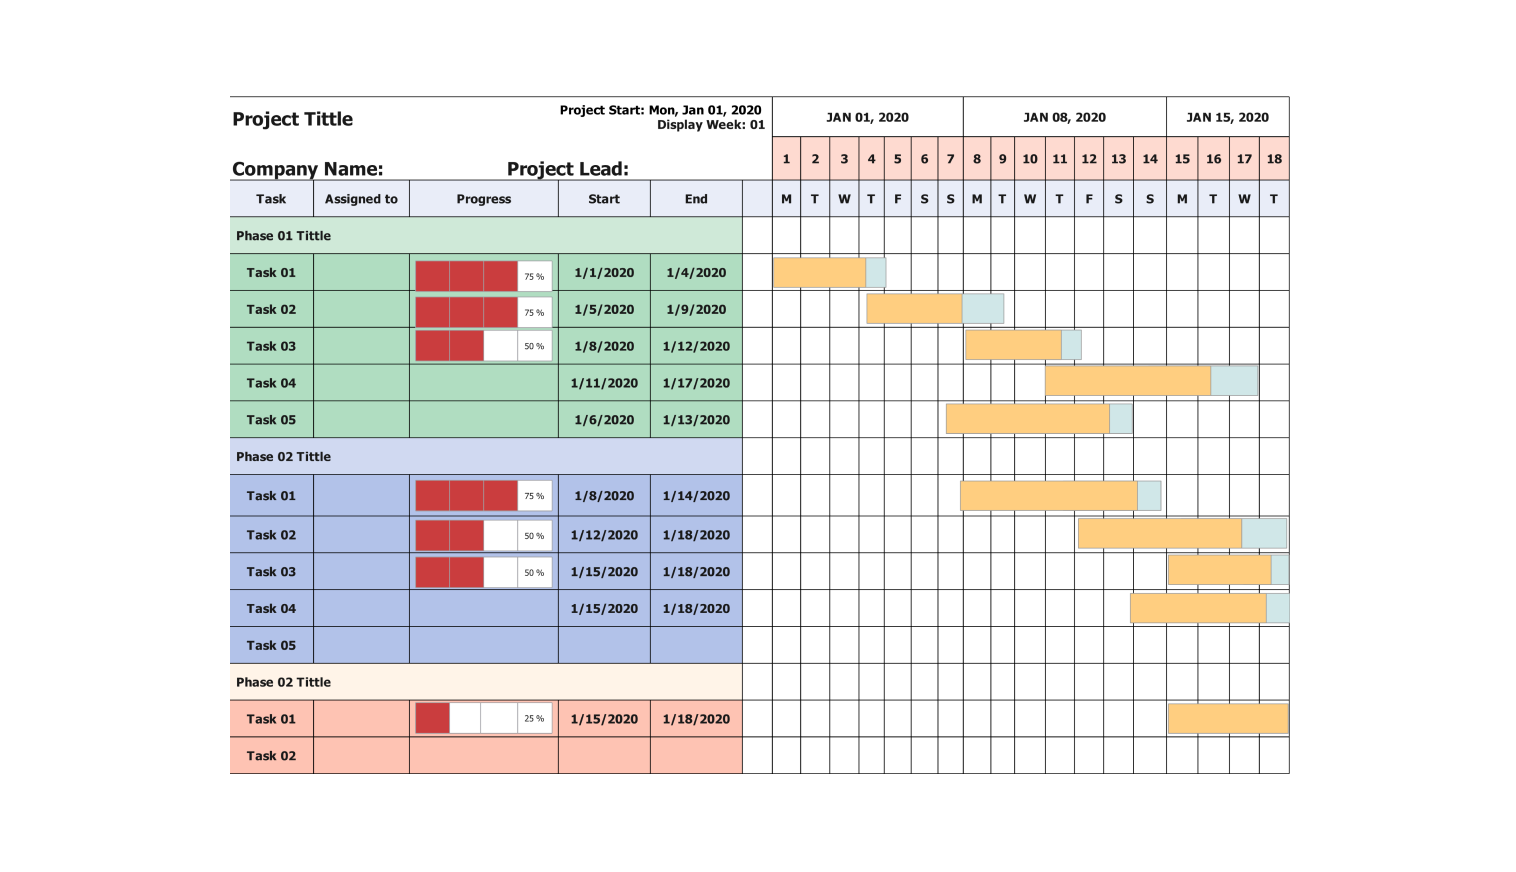
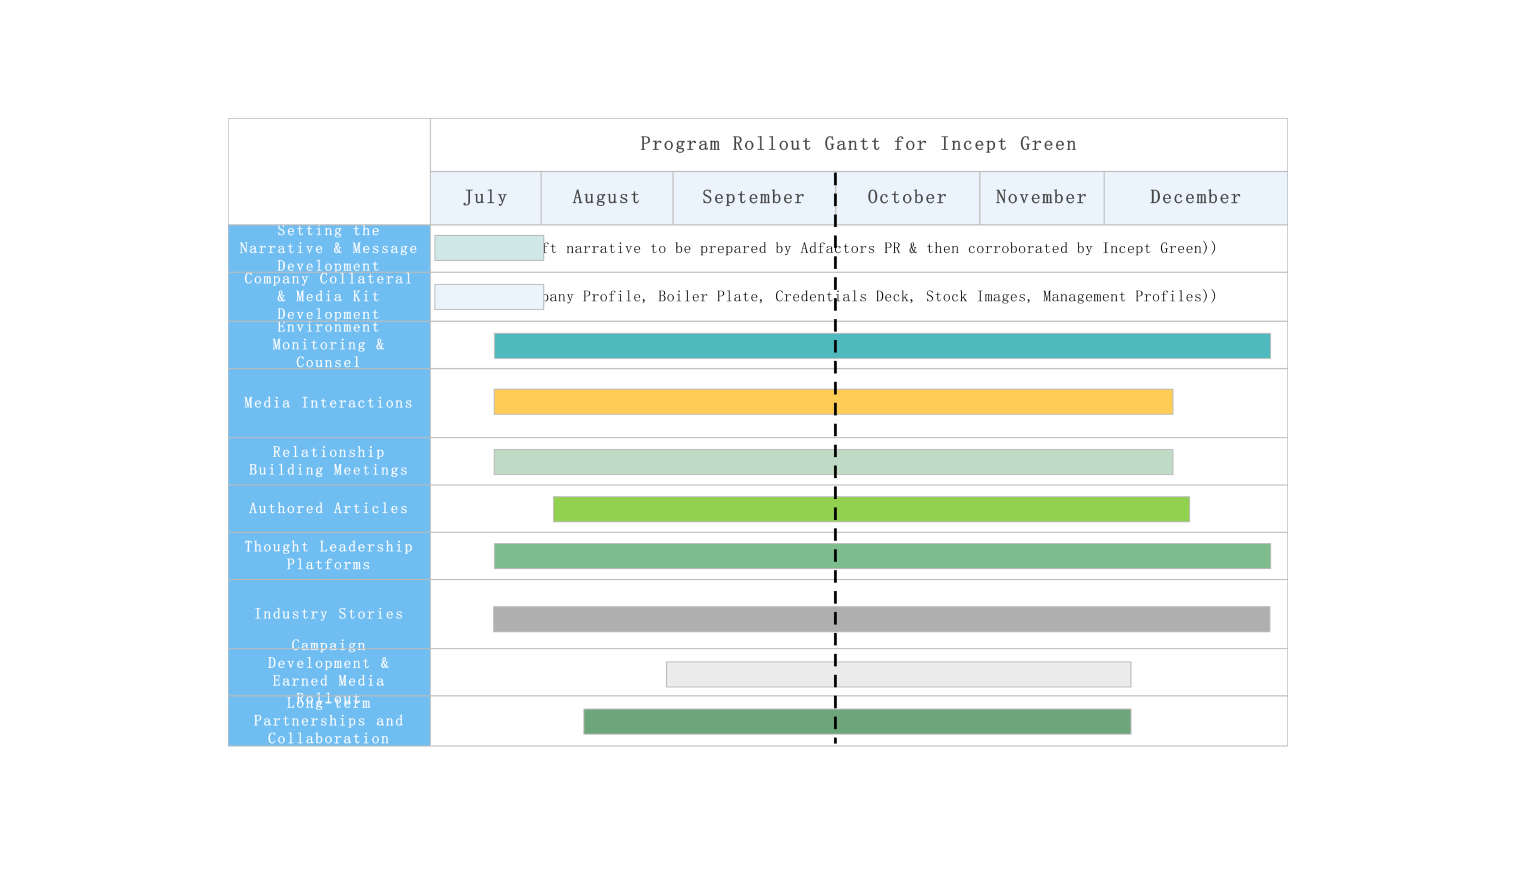
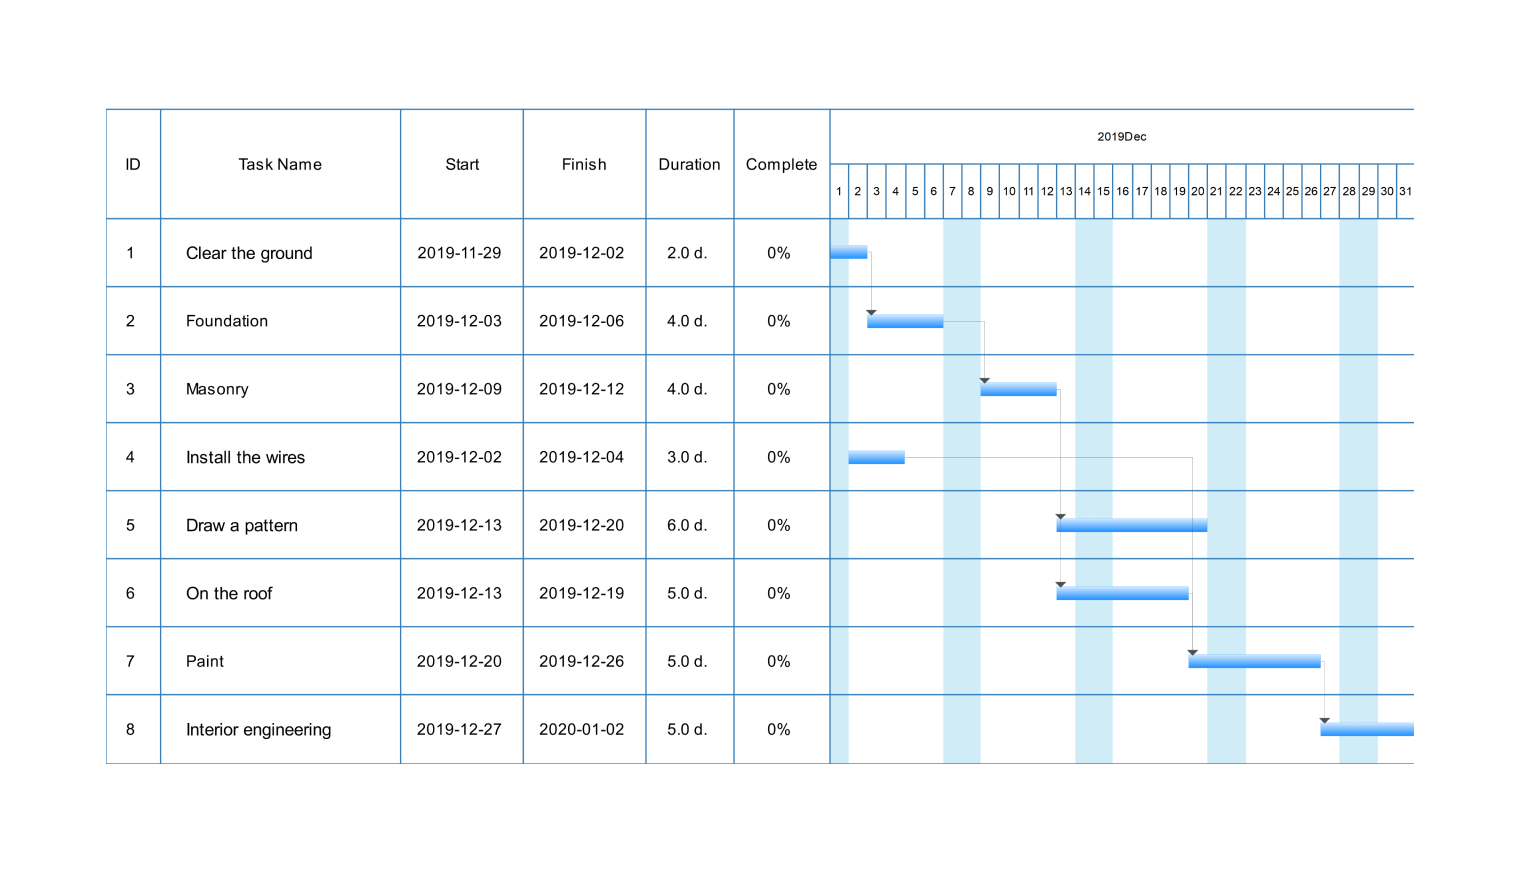
The project Gantt chart example has two main sections: the task list and the timeline. The task list on the left side of the chart shows the phases of the project and the tasks within each phase.
Each task is indented under its corresponding phase. The timeline, along the top of the chart, shows the project schedule in weeks or days. The bars in the chart represent the tasks. The left side of the bar indicates the task’s start date, and the right side indicates the task’s end date.
The length of the bar indicates how long the task takes. Shading within the bars can represent the progress of the task. For example, if a task is 75% complete, the bar might be shaded 75% across.
How to use this template
Click Use This Template.
In the left-hand column of the Gantt chart, enter the tasks that need to be completed for your project.
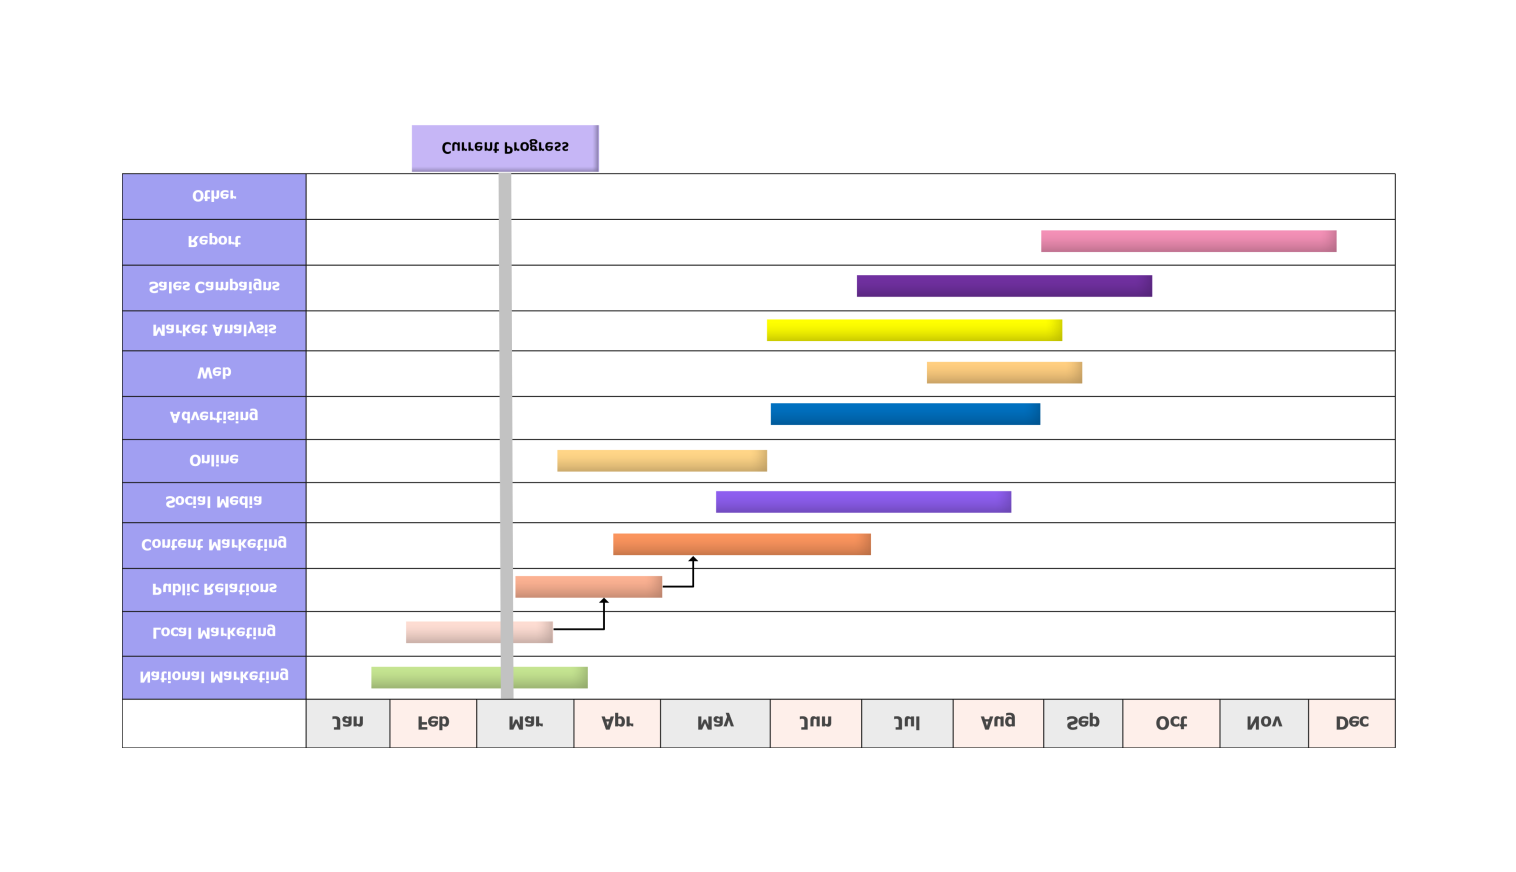
For each task, enter the start date and end date in the corresponding columns of the Gantt chart. If there are any dependencies between tasks, use the arrows in the Gantt chart to show these dependencies.
Customize the appearance of your Gantt chart by changing the colors, fonts, and formatting. You can also add labels and comments to your chart.
Once you have finished creating your Gantt chart, you can download it in different file formats, including PDF, Word, or JPG files. You can also share your chart with others by publishing it online.
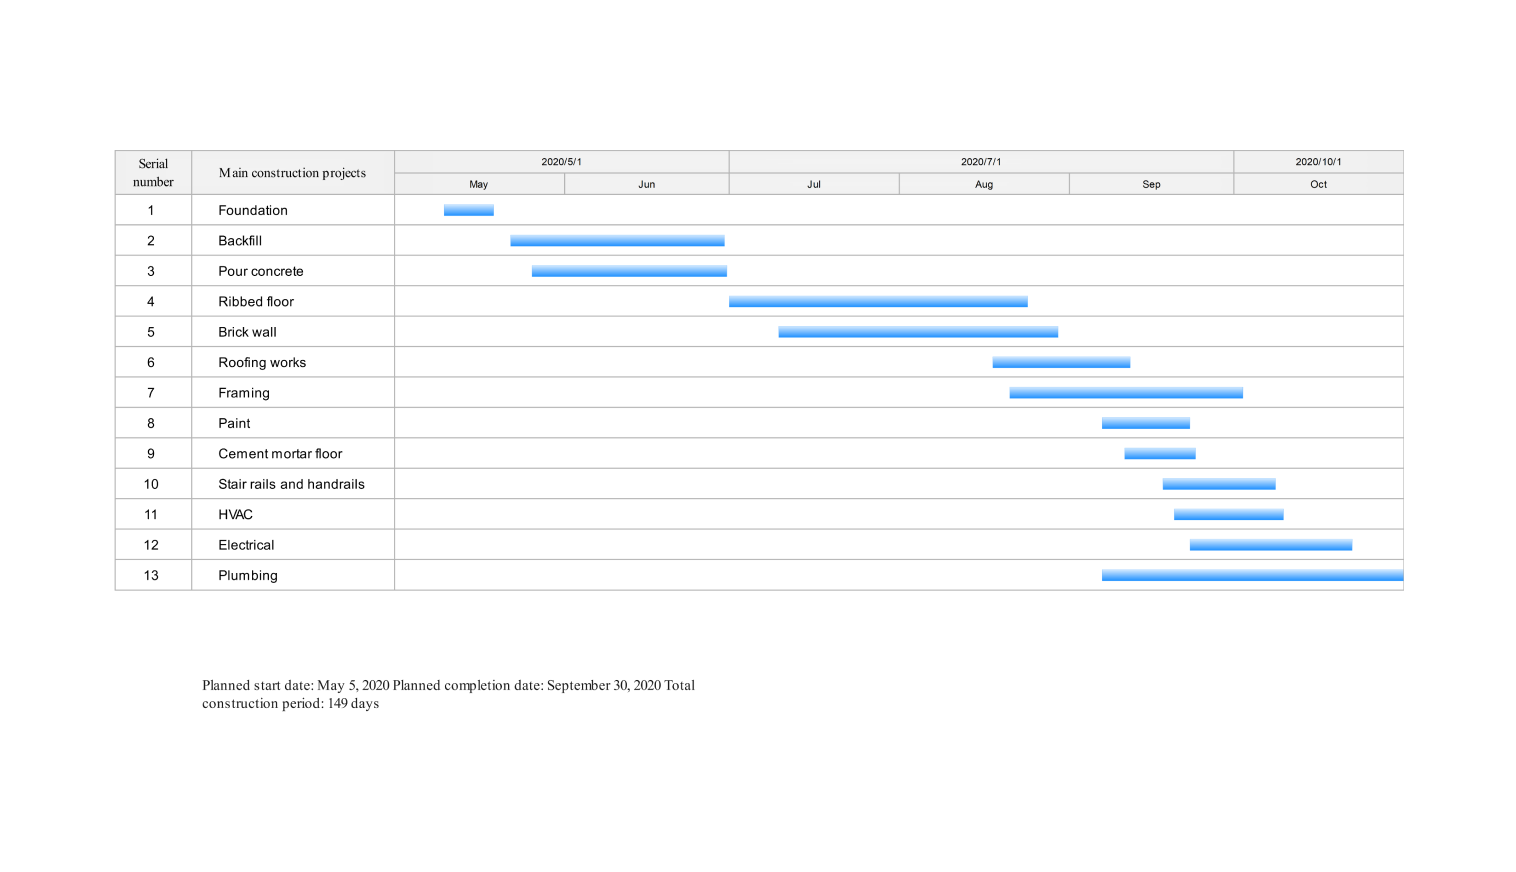
Benefits of the construction Gantt chart template
A project Gantt Chart can help to identify potential problems with the project schedule. For example, if it shows that two tasks are scheduled to start simultaneously, then this could be a problem if the same resources are needed for both functions.
Second, using the Gantt Chart for projects can help to communicate the schedule to stakeholders. This can help to ensure that everyone is on the same page and that there are no misunderstandings about the project schedule.
Third, the Gantt Chart example above can help track a project’s progress. This can help identify any project schedule delays and take corrective action. Overall, a Project Gantt Chart is a valuable tool that can be used to improve project management.
Frequently asked questions
-
Is there a Gantt chart template in PowerPoint?Microsoft PowerPoint (PPT) offers built-in Gantt chart templates. You can find them by going to File, then New, and searching for Gantt chart in the search bar. There are five customizable PPT Gantt chart template options to choose from.
-
How do you insert a Gantt chart in docs?Google Docs itself doesn’t have a built-in Gantt chart function. But you can make a chart in Google Sheets and import it into your Docs document. Then, go to File > Chart > From Sheets in the upper navigation pane to insert a chart in Google Docs.
-
How should a Gantt chart look?A Gantt chart is a bar chart with two axes: a vertical and a horizontal axis. The first is used to set start and finish dates, while the second is used to show tasks.
Related templates
Get started with EdrawMax today
Create 210 types of diagrams online for free.
Free Download Free Download Draw a diagram free Draw a diagram free Draw a diagram free