I made diagrams by dragging and dropping tools together. They seemed okay, but they never stayed in sync with the code. Each update in the code forced me to fix the visuals. Then it hit me—the root problem was that my diagrams didn't belong within the codebase. I couldn't version-control them or have them update automatically.
I began searching to find a better method. That search introduced me to the best tools to generate diagrams from code. These tools work like writing code. They stay well-organized, easy to track, and simple to reuse. I could save them in Git, refresh them through CI/CD pipelines, and share them without clicking everywhere.
Old-school diagramming programs like Visio or Lucidchart felt clunky and outdated. They don't grow well with projects and hardly reflect how the system works.
After trying out the top tools for code-based diagramming, I picked five that stood out. My choices focused on how simple their syntax is, the integration features they offer, and how engaged their user communities are. To create diagrams easily with code, you should check these tools out.
In this article
Top 5 Tools
PlantUML
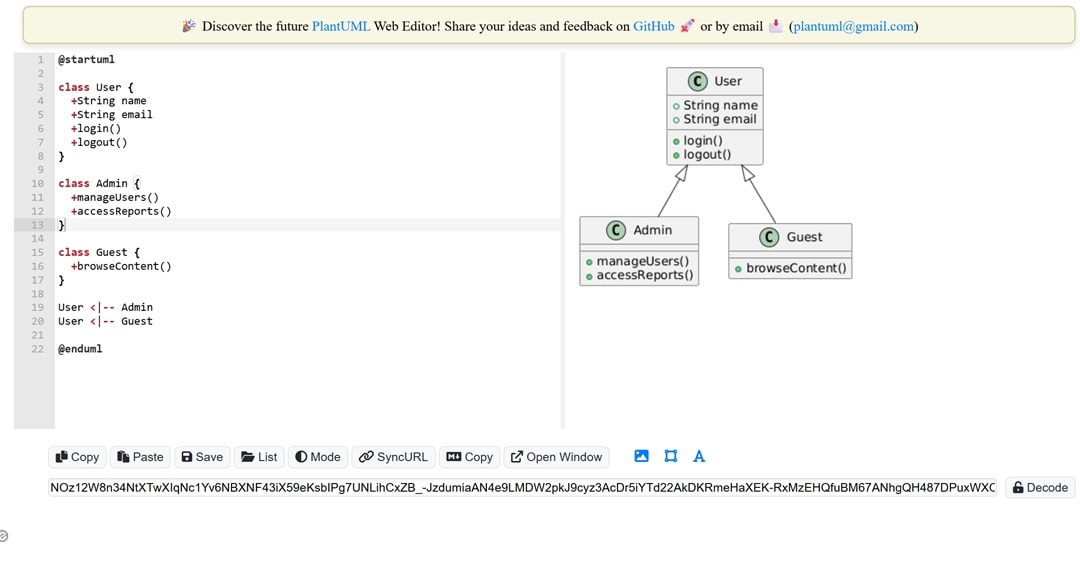
PlantUML is a simple, open-source tool that creates diagrams from a basic scripting language. It doesn't rely on GUI tools and works in browsers, IDEs, and pipelines. You can edit, view, and save diagrams without needing to install software. Its strong Git compatibility and ability to handle various diagram types inside your code editor make it unique.
Example
@startuml

class User {
  +String name
  +String email
  +login()
  +logout()
}

class Admin {
  +manageUsers()
  +accessReports()
}

class Guest {
  +browseContent()
}

User <|-- Admin
User <|-- Guest

@enduml
Mermaidchart.com
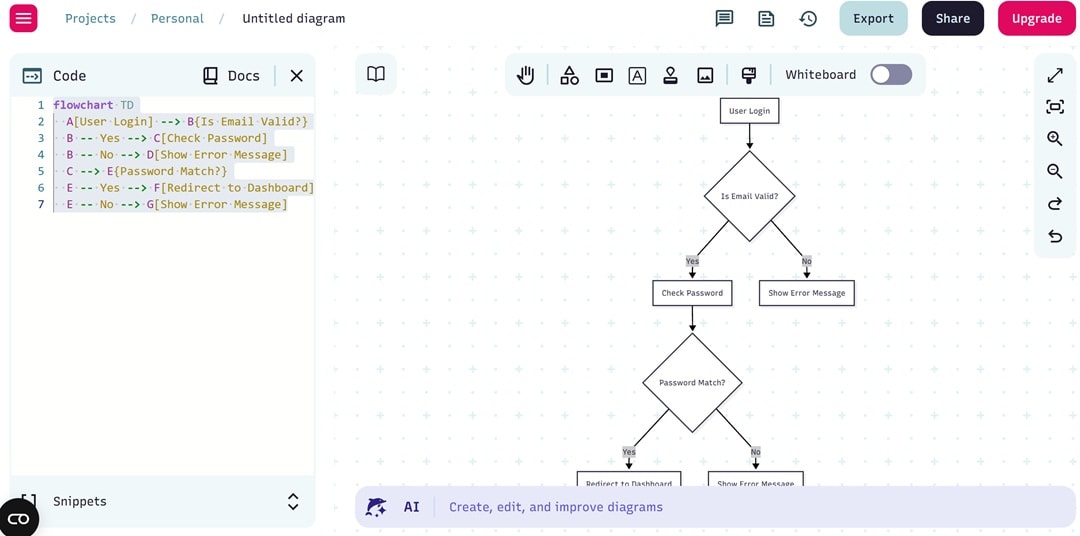
Mermaidchart.com works great to create tidy and organized diagrams from a Markdown-like syntax. It lets users make flowcharts, Gantt charts, and sequence diagrams while previewing them online. You can tweak the diagrams live, group them into projects, and save them as PNG, SVG, or PDF files. Everything happens right in your browser.
Example
flowchart TD
  A[User Login] --> B{Is Email Valid?}
  B -- Yes --> C[Check Password]
  B -- No --> D[Show Error Message]
  C --> E{Password Match?}
  E -- Yes --> F[Redirect to Dashboard]
  E -- No --> G[Show Error Message]
Graphviz
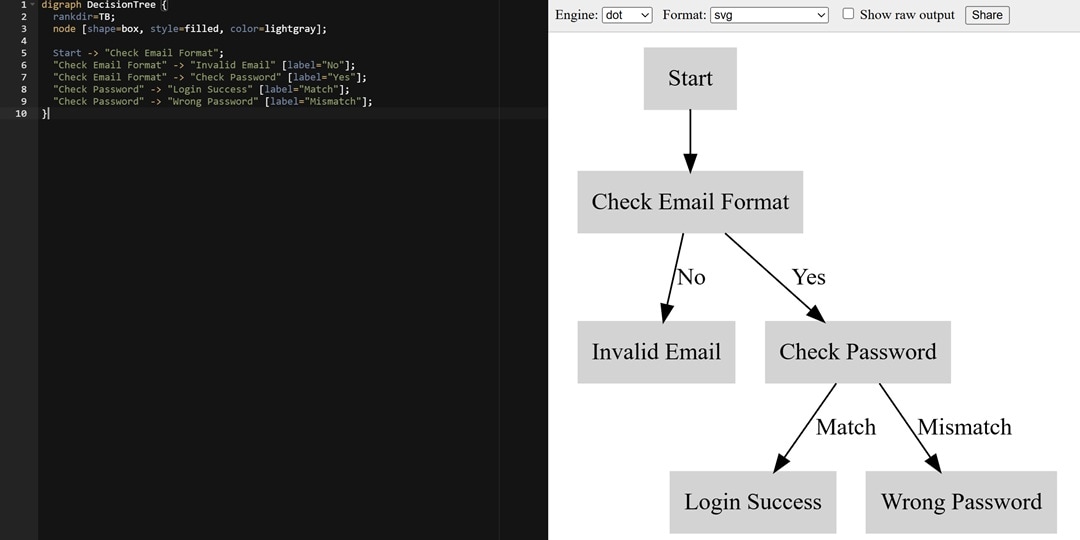
Graphviz works well to create algorithmic and hierarchical graphs with the DOT language. It relies on precise layout engines to place nodes in things like trees, flowcharts, or decision maps. Developers can use it to get clear and precise visuals. These can be used for research papers, simulations, or when showing data structures.
Example
digraph DecisionTree {
  rankdir=TB;
  node [shape=box, style=filled, color=lightgray];

  Start -> "Check Email Format";
  "Check Email Format" -> "Invalid Email" [label="No"];
  "Check Email Format" -> "Check Password" [label="Yes"];
  "Check Password" -> "Login Success" [label="Match"];
  "Check Password" -> "Wrong Password" [label="Mismatch"];
}
Diagrams
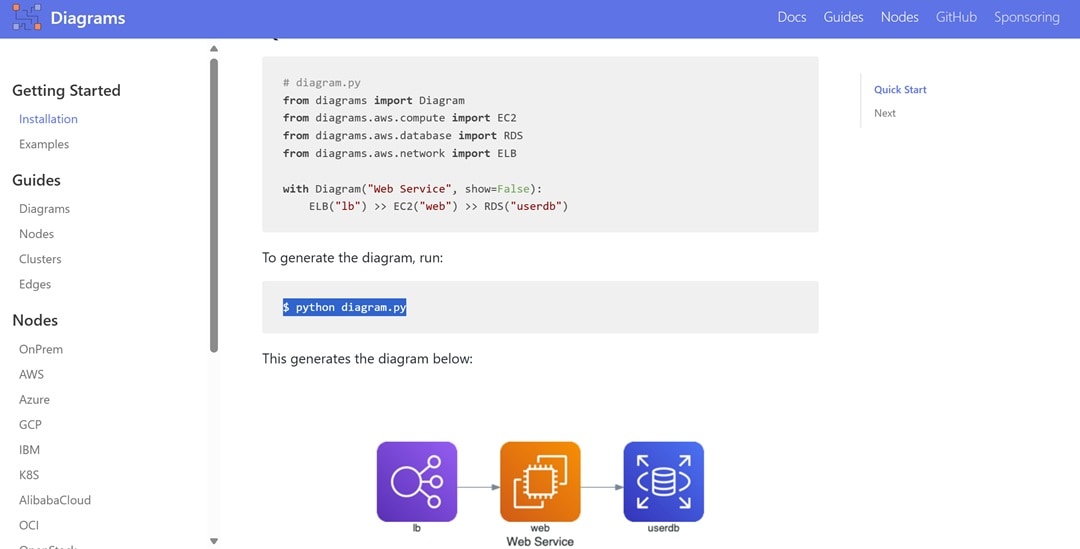
Diagrams work best to create cloud architecture visuals through Python scripting. It lets you use icons from AWS, GCP, Azure, and Kubernetes. This helps describe your infrastructure with code. The tool generates clear and detailed system diagrams. This makes it useful to plan cloud setups and support DevOps tasks.
Example
# diagram.py
from diagrams import Diagram
from diagrams.aws.compute import EC2
from diagrams.aws.database import RDS
from diagrams.aws.network import ELB

with Diagram("Web Service", show=False):
    ELB("lb") >> EC2("web") >> RDS("userdb")
$ python diagram.py
Structurizr
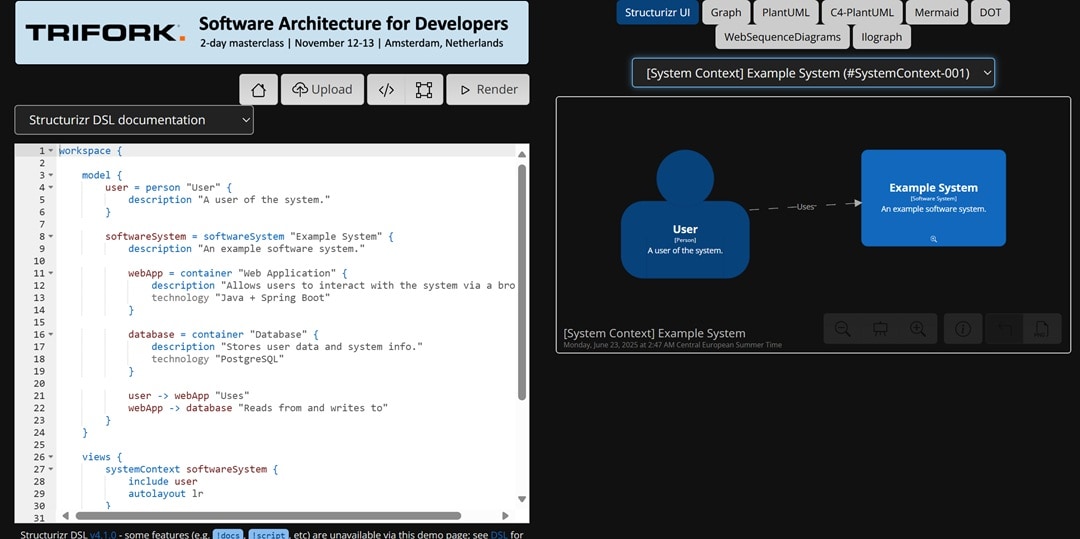
Structurizr works well to create C4 architecture diagrams at an enterprise level by using its DSL. It uses a single model to provide multiple views. This includes System Context, Container, Component, and Deployment. Teams can use the browser-based editor that supports versioning and organizes workspaces. This makes it easier to manage for larger groups.
Example
workspace {

    model {
        user = person "User" {
            description "A user of the system."
        }

        softwareSystem = softwareSystem "Example System" {
            description "An example software system."

            webApp = container "Web Application" {
                description "Allows users to interact with the system via a browser."
                technology "Java + Spring Boot"
            }

            database = container "Database" {
                description "Stores user data and system info."
                technology "PostgreSQL"
            }

            user -> webApp "Uses"
            webApp -> database "Reads from and writes to"
        }
    }

    views {
        systemContext softwareSystem {
            include user
            autolayout lr
        }

        container softwareSystem {
            include user
            autolayout lr
        }

        theme default
    }

}
Comparison Table
| Tool | Strengths | Learning Curve | Output Quality |
| PlantUML | Versatility | Moderate | 4/5 |
| Mermaid | Docs integration | Easy | 3/5 |
| Graphviz | Algorithmic layouts | Hard | 5/5 |
| Diagrams | Cloud diagrams | Moderate | 4/5 |
| Structurizr | Enterprise scalability | Moderate-Hard | 5/5 |
Recommendations:
I tried all five tools in real workflows and began to see where each one fit best. When I work alone, I like using Mermaid to make quick documentation and PlantUML to create detailed diagrams. It helps me stay efficient and flexible.
For cloud-based projects, Diagrams has been a huge time-saver. Writing infrastructure in Python feels natural with Diagrams. In large team projects, Structurizr stands out. It has C4 modeling and shared workspaces that work well for planning enterprise-level system designs.
Pro Tips
Here's what I've picked up while learning how to create UML from code. These tips can help you streamline your work, sidestep usual frustrations, and make the most out of any tool you use.
- Use Automation for Diagrams: Avoid spending time updating diagrams on your own. Set up PlantUML with GitHub Actions to create diagrams whenever you push updates to your code. It keeps everything up-to-date while saving time.
- Experiment with Custom Styles: Standard visuals might seem dull. Try modifying Mermaid using custom CSS or changing Graphviz options like fonts, spacing, or node shapes. Small tweaks can make a big difference in making diagrams look polished.
- Try a Mixed Approach: I begin with Mermaid to sketch basic ideas fast. When diagrams become more detailed, I switch to Graphviz to gain better control over the layout. You can try this method to organize your work faster and improve clarity.
- Save Versions of Your Diagrams: I manage my diagrams as if they were code. Storing them in Git allows me to track progress and work better with others. This habit will make things simpler later on.
Limitations of Diagramming as Code and Why Consider GUI Options?
Diagramming as code is good but far from perfect. Here are some drawbacks of diagramming as code:
- Steep Learning Curve: You can't just start making diagrams right away. Tools like PlantUML or DOT require you to learn their specific syntax. Even a tiny error in your code can mess up the whole diagram.
- Little Control Over Design: Want to nudge a box to the left or tweak the arrow's look? That's tough to do. The tool gives you what it wants, and adjusting layouts or styles can be extra work, or sometimes you just can't.
- Narrow Use Cases: These tools work best when creating organized and planned diagrams. However, they fall short when you need to quickly sketch ideas or think during a brainstorming session. They require more effort writing than focusing on your thoughts.
Strengths of GUI Tools
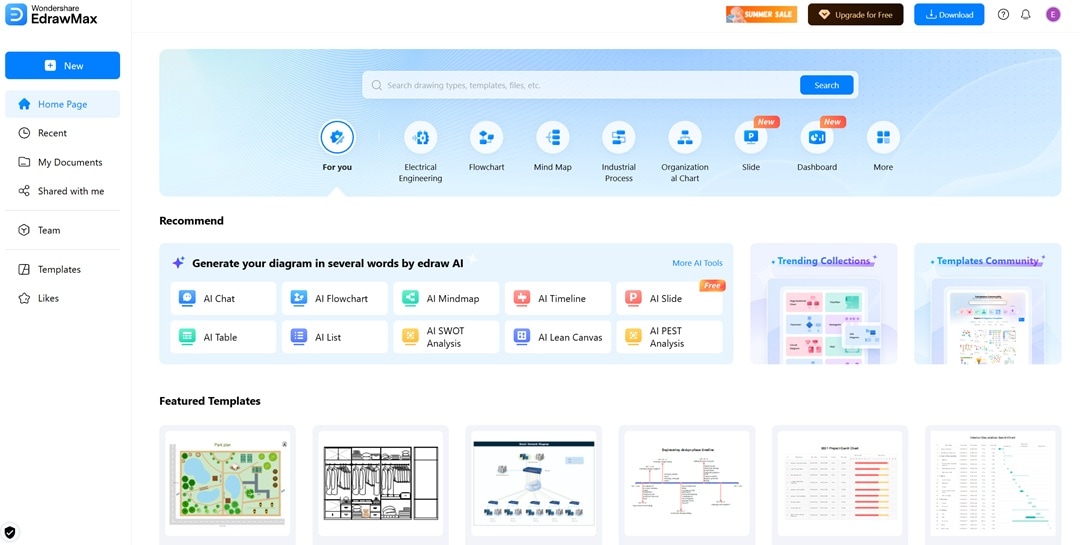
Creating diagrams with code might seem like a smart method at first, but it becomes frustrating when fast tweaks are required. Coding line by line isn't always the best choice for every idea. There are times when dragging and dropping feels quicker. Tools with graphical user interfaces, such as EdrawMax, help in those moments.
EdrawMax is an all-in-one diagram maker built for speed and simplicity. It doesn't require coding skills, yet it offers powerful features that match structured diagram tools. You can build flowcharts, org charts, ER diagrams, and more. The interface is clean, and the options are flexible enough for both beginners and advanced users.
Why You Will Love It
- No-Code Editing: You can make and organize diagrams by dragging and dropping elements.
- AI-Powered Design: The system offers smart layout ideas, lines things up, and formats with just one click.
- Multi-Format Exporting: You can save your diagrams as PNG, SVG, PDF, HTML, and editable files to share them.
How to Choose?
When I create technical docs, I kick things off with a diagram as code. This keeps everything in version control and consistent. Down the line, I switch to a GUI tool to make the visual layout better.
But for work I do for clients or creative presentations, I don't bother with code. Instead, I go straight for a GUI tool like EdrawMax. It's faster, produces cleaner results, and makes it easier to act on feedback.
My Closing Take
Most software tools excel at one specific task—they either help you write diagrams as if you're coding or allow you to drag shapes into position. But real-world projects often require both capabilities. After putting numerous options to the test, these five top code-driven diagram tools stood out. They present reliability, effectiveness, and usefulness in actual projects.
The best tools to create diagrams from code do more than just save time. They keep things consistent, easy to share, and simple to update. Tools like PlantUML, Mermaid, and Graphviz add structure and control. Diagrams make cloud visuals easier for Python users. Structurizr tackles big enterprise systems in depth.
Yet, you don't always need to begin with programming. For quick changes or polished visuals for clients, EdrawMax stands out as a smart option when you want fast outcomes without compromising on quality.
You've learned what's effective, in which situations, and for what reasons. It's your turn now—choose a tool and begin creating more intelligent diagrams. Pick one and see how it goes!