In Google Docs, a Gantt chart can help you visualize disorganized project schedules clearly and orderly. Google Docs does not, however, include a built-in Gantt chart function. Now, the question is, how do you make one?
Google Sheets lets you create a decent Gantt chart in Google Docs with a few basic steps. However, formatting is complicated, customization is limited, and maintaining complex projects is difficult.
This article will guide you through creating a Gantt chart in Google Docs and introduce an alternative that makes the process even easier. Follow along and take control of your workflow with ease.
In this article
What is a Gantt Chart?
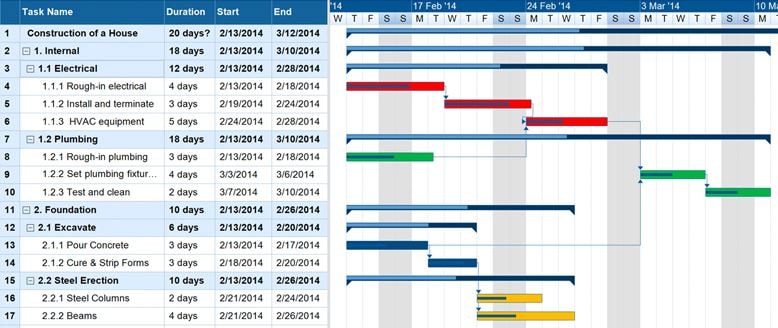
A Gantt chart shows the relative timing of several project tasks on a timeline. It helps monitor growth, manage due dates, and properly allocate resources. Every Activity is demonstrated by a bar whose length and location mark the start, duration, and end dates.
Uses
Gantt charts are essential tools in project management for several reasons:
- Task Organization: They help in listing all tasks involved in a project, ensuring nothing is overlooked.
- Timeline Visualization: Displaying tasks over time clearly shows the project's progress.
- Dependency Management: They illustrate relationships between tasks, highlighting which tasks depend on others.
- Resource Allocation: Gantt charts assist in assigning resources effectively by showing who is responsible for each task.

Benefits
- Google Docs automatically saves Gantt charts in the cloud, simplifying document management. Unlike Word files, you don't need to download, store, or email documents. Team members can use them on any device.
- Teams can collaborate on online files simultaneously. Real-time updates prevent version conflicts.
- Google Docs Gantt chart templates are simple for project management novices, making them ideal for beginners and experts.
How to Create a Gantt Chart in Google Docs
Google Docs' Gantt chart lets you see tasks, deadlines, and progress. Two quick ways to make one are to utilize a stacked bar chart or copy an existing Google Sheets chart.
Method 1: Load a Google Sheets Existing Gantt Chart
If you already have a Gantt chart in Google Sheets, you can easily insert it into your Google Docs document.
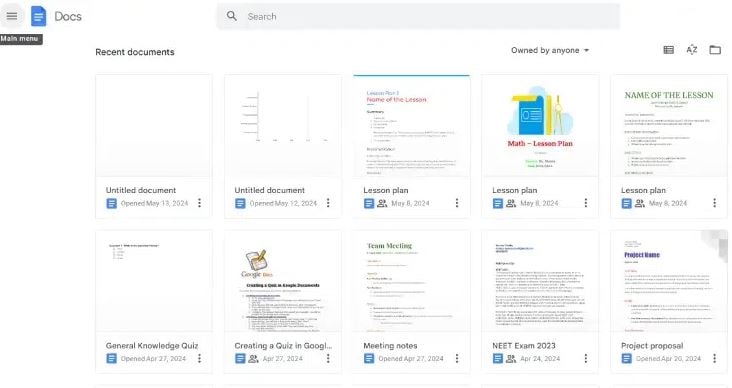
Step 1 Access a new Google Document
Establish an entirely new document in Google Docs by visiting Google Drive.
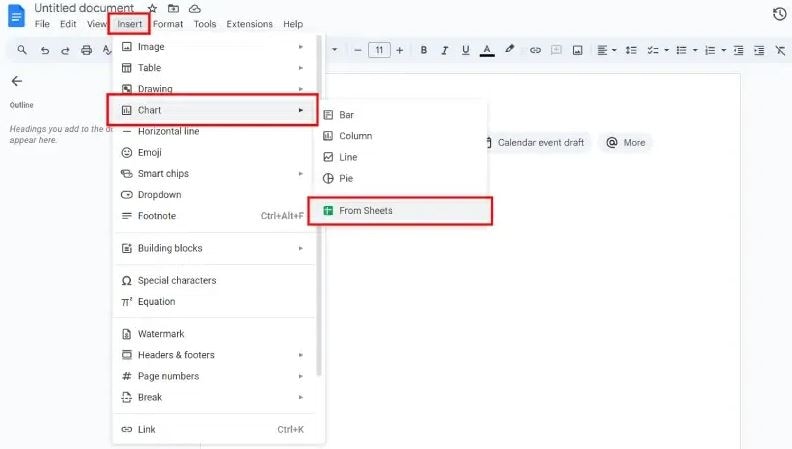
Step 2 Insert a Chart from Google Sheets
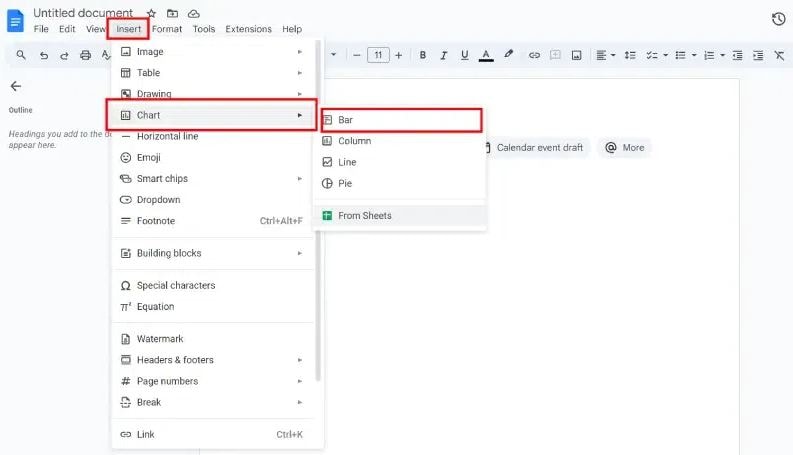
Click on the Insert tab at the top of the menu. Select Chart and then choose From Sheets. A pop-up window will appear. Pick the Google Sheets file that contains your Gantt chart.
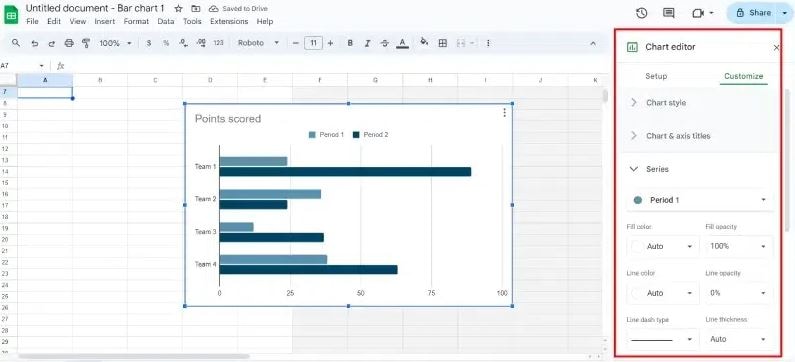
Step 3Preview and Customize the Chart
You can resize the chart to fit your document layout, adjust formatting, text wrapping, and positioning, and modify colors, transparency, and brightness to improve visibility.
Step 4Keep Your Chart Updated
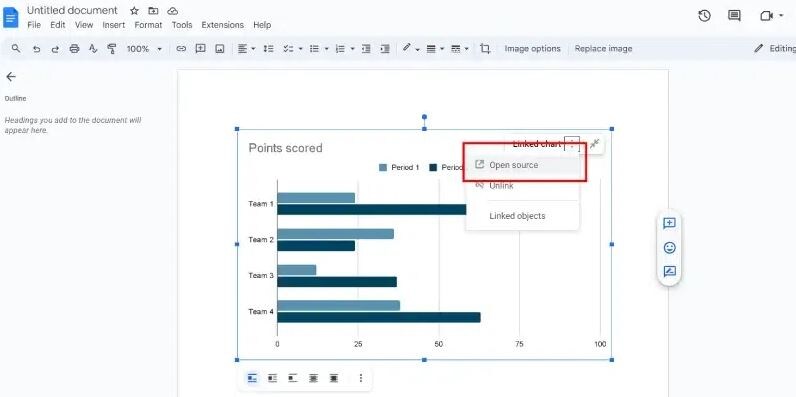
If changes are made in Google Sheets, click the chart in Google Docs. Then, select the Update option to apply the latest edits to the spreadsheet.
Method 2: Create a Gantt Chart Using the Stacked Bar Chart
A stacked bar chart in Google Sheets can generate a Google Docs Gantt chart from scratch.
Step 1 Launch a Fresh Google Document
Create a new document in Google Docs.
Step 2Insert a Bar Chart
Click on the Insert tab in the top menu. Select Chart and choose Bar Chart. A default bar chart will appear in your document.
Step 3Set Up Data in Google Sheets
Click on the chart and select Edit in Sheets. In Google Sheets, enter your project details into separate columns:
- Task Name
- Start Date
- End Date
- Duration (calculated as End Date minus Start Date)
- Task Dependencies
Step 4Convert the Bar Chart into a Gantt Chart
In the Chart Editor, change the chart type to a stacked bar chart. Make the "Start Date" bars transparent to display only the duration bars. Adjust the axes to fit the project timeline.
Step 5Insert the Chart into Google Docs
Return to your Google Docs file. Click on Insert, then Chart, and select From Sheets. Choose your updated chart from Google Sheets and insert it into the document.
Step 6Keep Your Chart Updated
If any modifications are made in Google Sheets, return to Google Docs. Click on the chart and select Update to sync the latest changes.
How to Make a Gantt Chart Easier
EdrawMax is a great substitute for Google Sheets, even though it offers simple tools for creating Gantt charts. It contains more sophisticated features and customization facilities. Due to its drag-and-drop user interface and competent features, EdrawMax is an all-in-one diagramming instrument that helps create Gantt charts.
Top Features:
- Pre-made Templates: To start your project planning, search a large selection of professionally created Gantt chart templates.
- Simple drag-and-drop interface: It allows users to quickly add, remove, or reorganize activities without starting from scratch.
- Customization Tools: Tailor every element of your Gantt chart, including task dependencies and evaluation of progress, as well as colors and fonts. For example, AI Gantt Chart Analysis helps you spot potential bottlenecks and delays, allowing you to make proactive adjustments.
How to create Gantt charts with EdrawMax
Step 1Open a Blank Template
Log in to EdrawMax using your account. On the left panel, find Project Management and click on it. In the template gallery, select the plus icon to open a blank Gantt chart template.
Step 2Import Project Data
Prepare your project data in an XLSX or CSV format. Click on the Import button in the Gantt Chart panel. Select the file you saved on your computer and click OK. EdrawMax will automatically generate a Gantt chart based on the imported data.
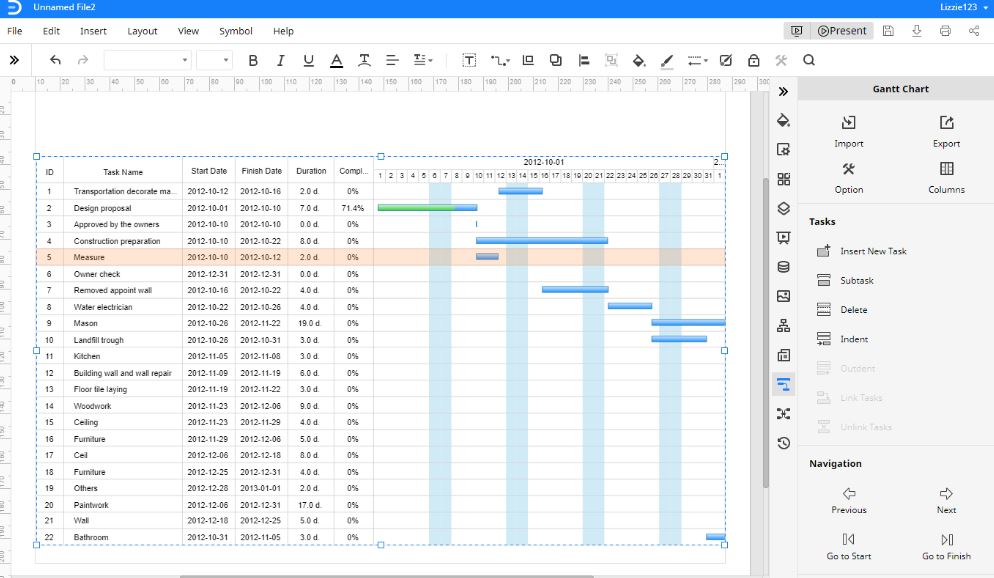
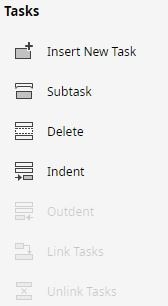
Step 3Add Subtasks
To break a large task into smaller steps, select the main task. Click on Subtask in the Gantt chart panel A new subtask will appear under the selected task. The main task's completion will now depend on its subtasks.
Step 4Link Tasks (Task Dependency)
Tasks often have dependencies, meaning one task must be finished before another begins. Click on the blue taskbar of the first task (predecessor). Drag the cursor to the task that follows (successor). Once linked, the second task will depend on the first task’s completion.
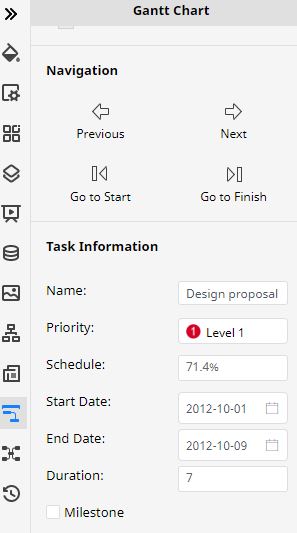
Step 5Modify Task Information
Scroll down in the Gantt Chart panel to find task details. Select a task and edit its information, including:
If a task is a key milestone, tick the Milestone box to highlight it.
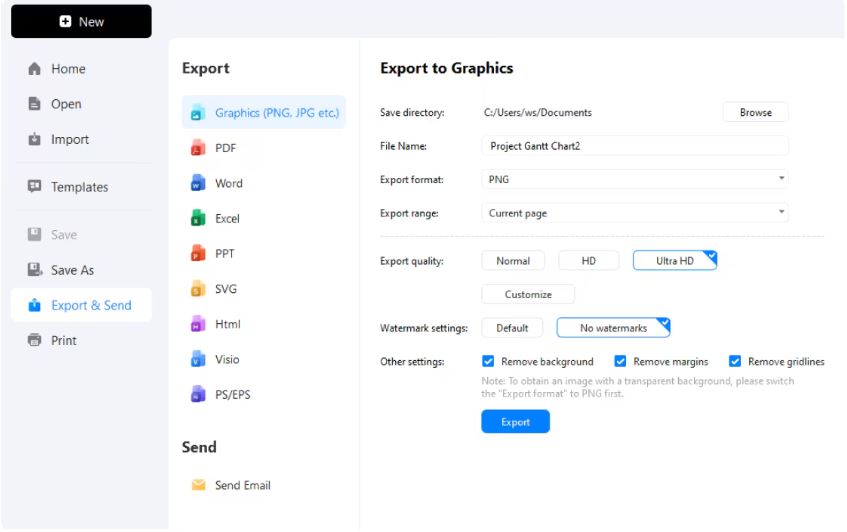
Step 6save and share the document
When your Gantt chart is finished, you may export it in a variety of formats, including PDF for distribution, PPTX for presentations, and VSDX for modifications. As an alternative, send your Gantt chart via email or link.
Additional Tips and Tricks
Creating a Gantt chart in Google Docs is just the beginning. Following professional advice will help you improve your chart's visual attractiveness and efficiency.
1. Use Conditional Formatting in Google Sheets
If you build a Gantt chart from Google Sheets, apply conditional formatting to underline important chores, past-due dates, or accomplished milestones. This makes reading easier and facilitates teams' prioritizing efforts.
2. Keep the Chart Updated Regularly
Projects evolve. Ensure to update task progress, adjust deadlines, and modify dependencies. If your Gantt chart is linked to Google Sheets, use the Update button in Google Docs to reflect the latest changes.
3. Color-Code Different Task Categories
Assigning different colors to tasks based on priority, team responsibility, or completion status helps stakeholders quickly identify key project areas.
4. Use Collaboration Features
Since Google Docs allows real-time collaboration, use the commenting and suggestion tools to communicate with your team directly on the Gantt chart.
5. Choose the Right Method for Your Needs
If your project is simple, inserting a Google Docs Gantt chart template from Google Sheets may be enough.
EdrawMax provides better customization, dependencies, and milestone tracking for complex projects requiring advanced tracking.
Conclusion:
A Gantt chart in Google Docs clarifies project timelines, helping teams track tasks and deadlines. While Google Sheets provides a way to create one, it comes with limitations in customization and complex project handling.
For those needing greater flexibility, advanced task dependencies, and a visually refined chart, exploring a tool like EdrawMax can make project management smoother.
Whether you're streamlining a business project or organizing personal tasks, the right approach ensures efficiency. Take control of your workflow with the right tools, and let your Gantt chart work for you—not the other way around.