- Templates
- Bar chart templates
- ELEOT results bar chart
About this template
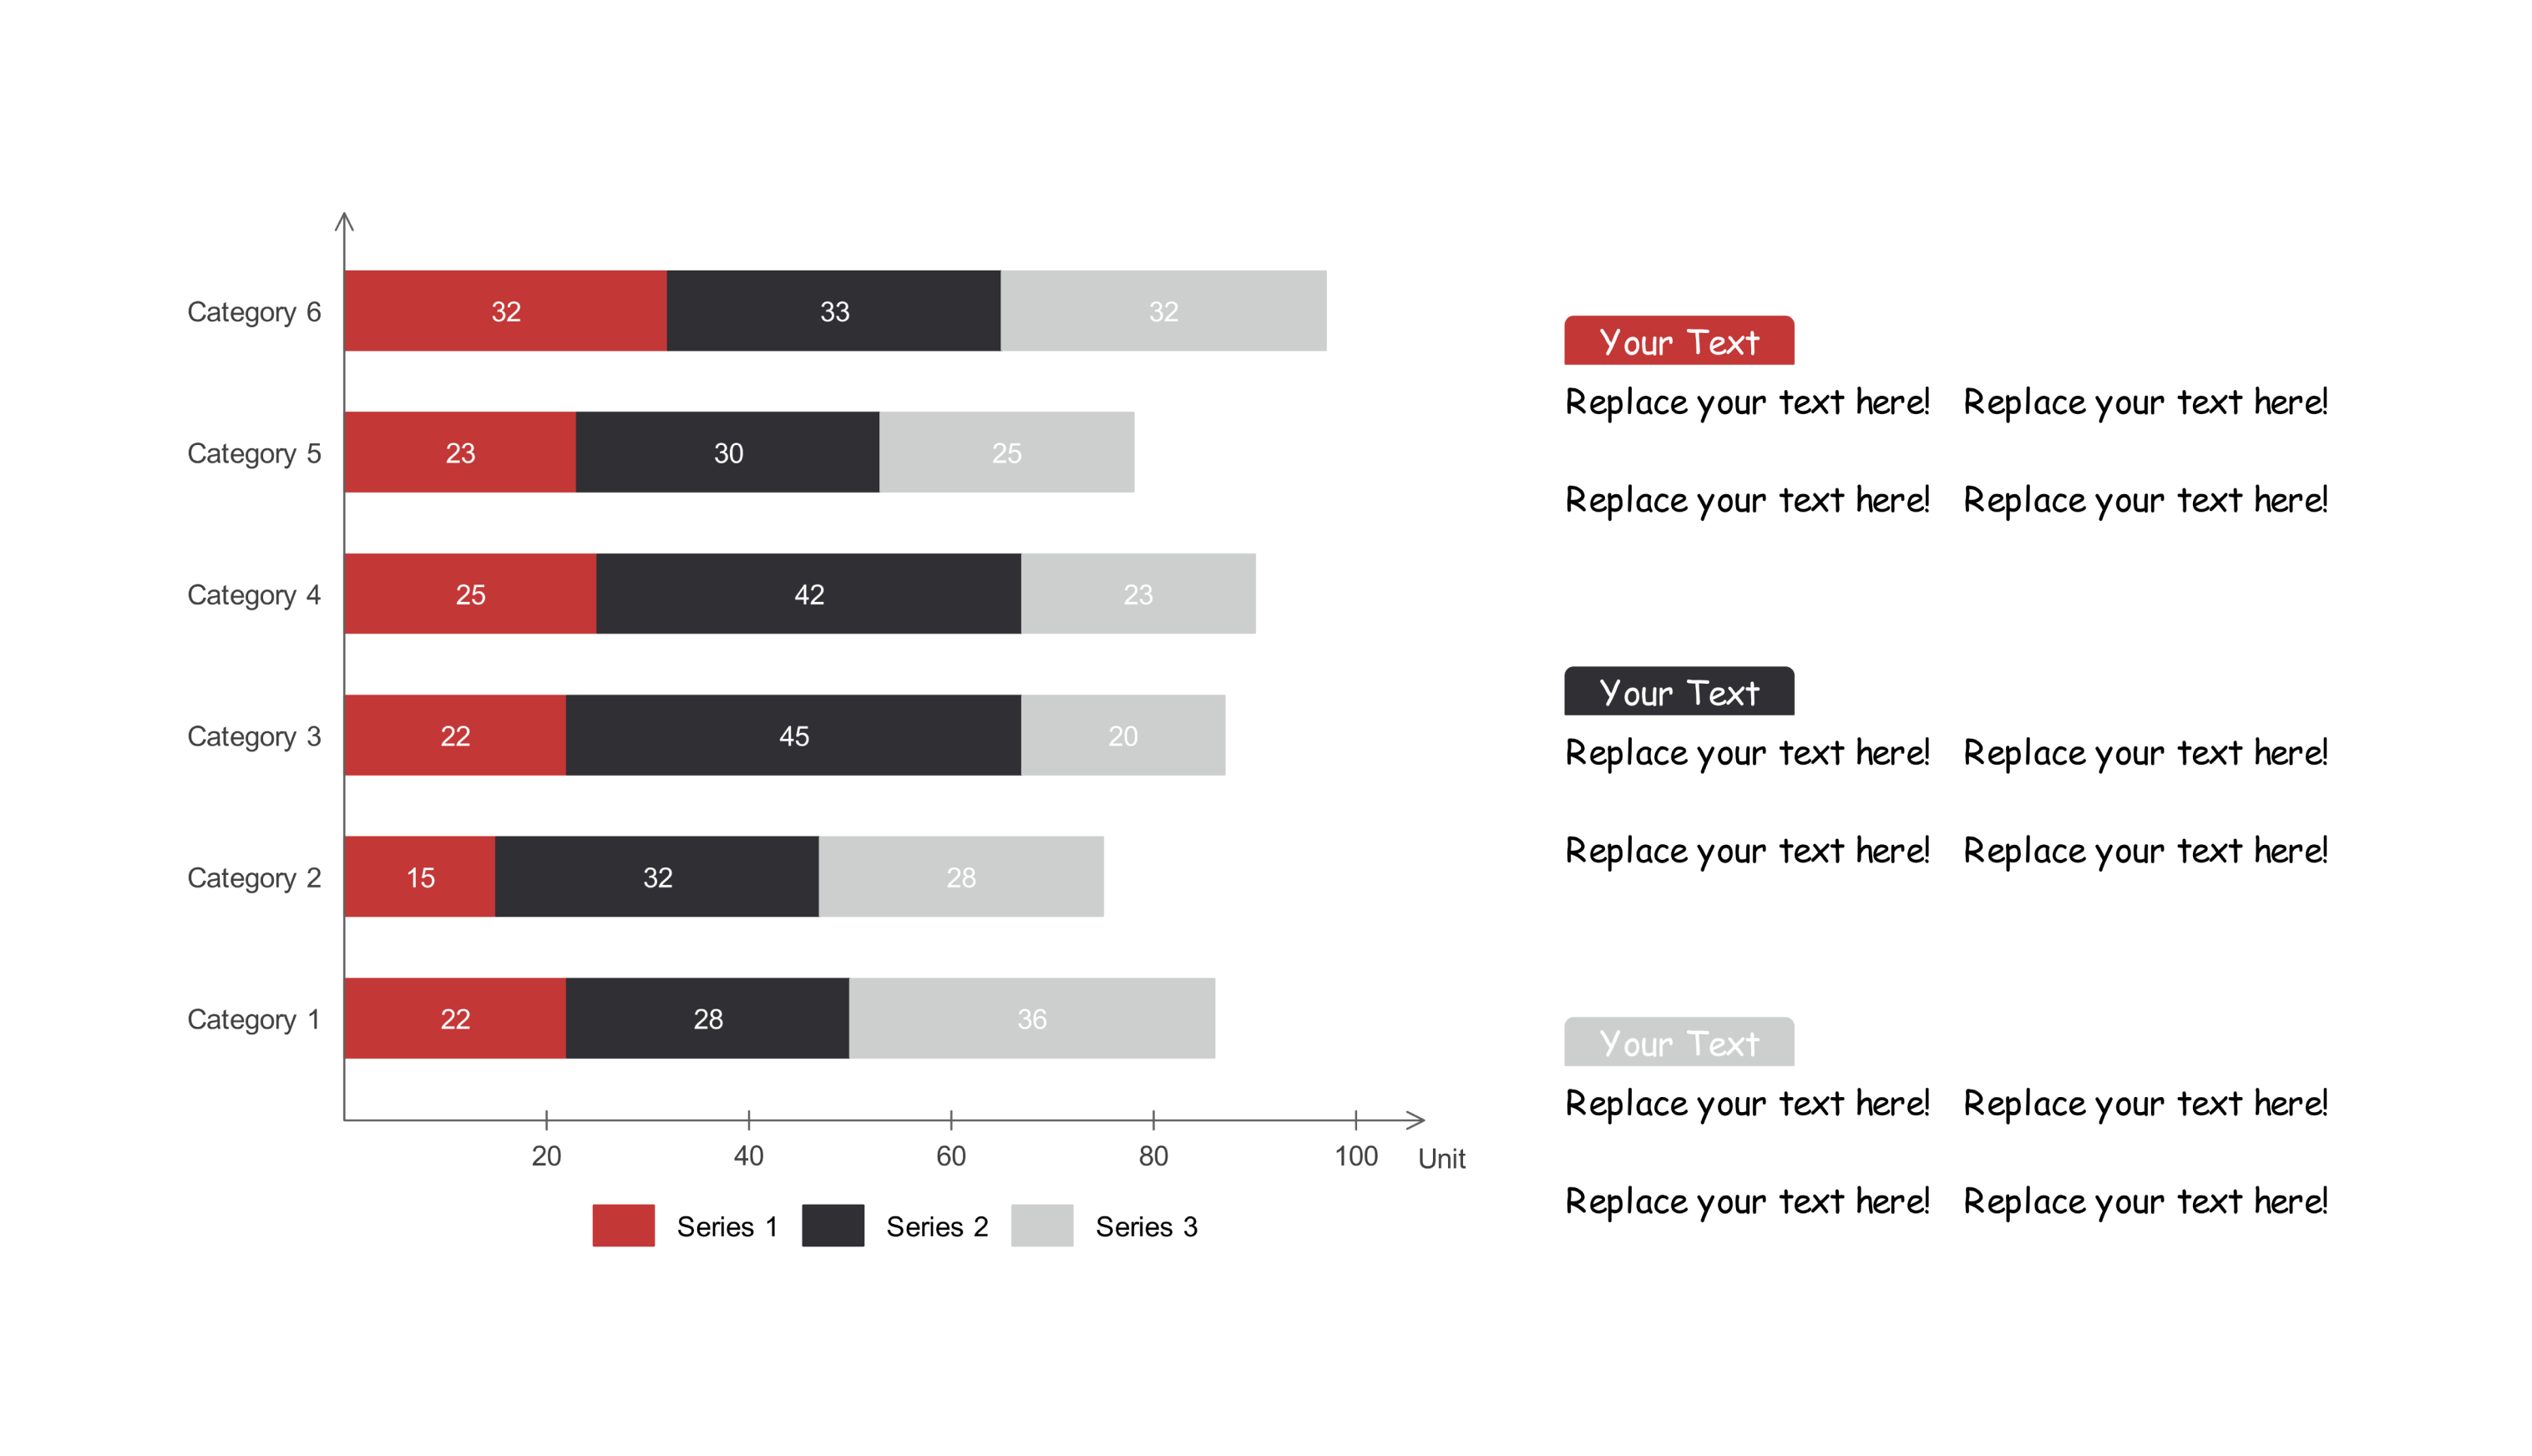
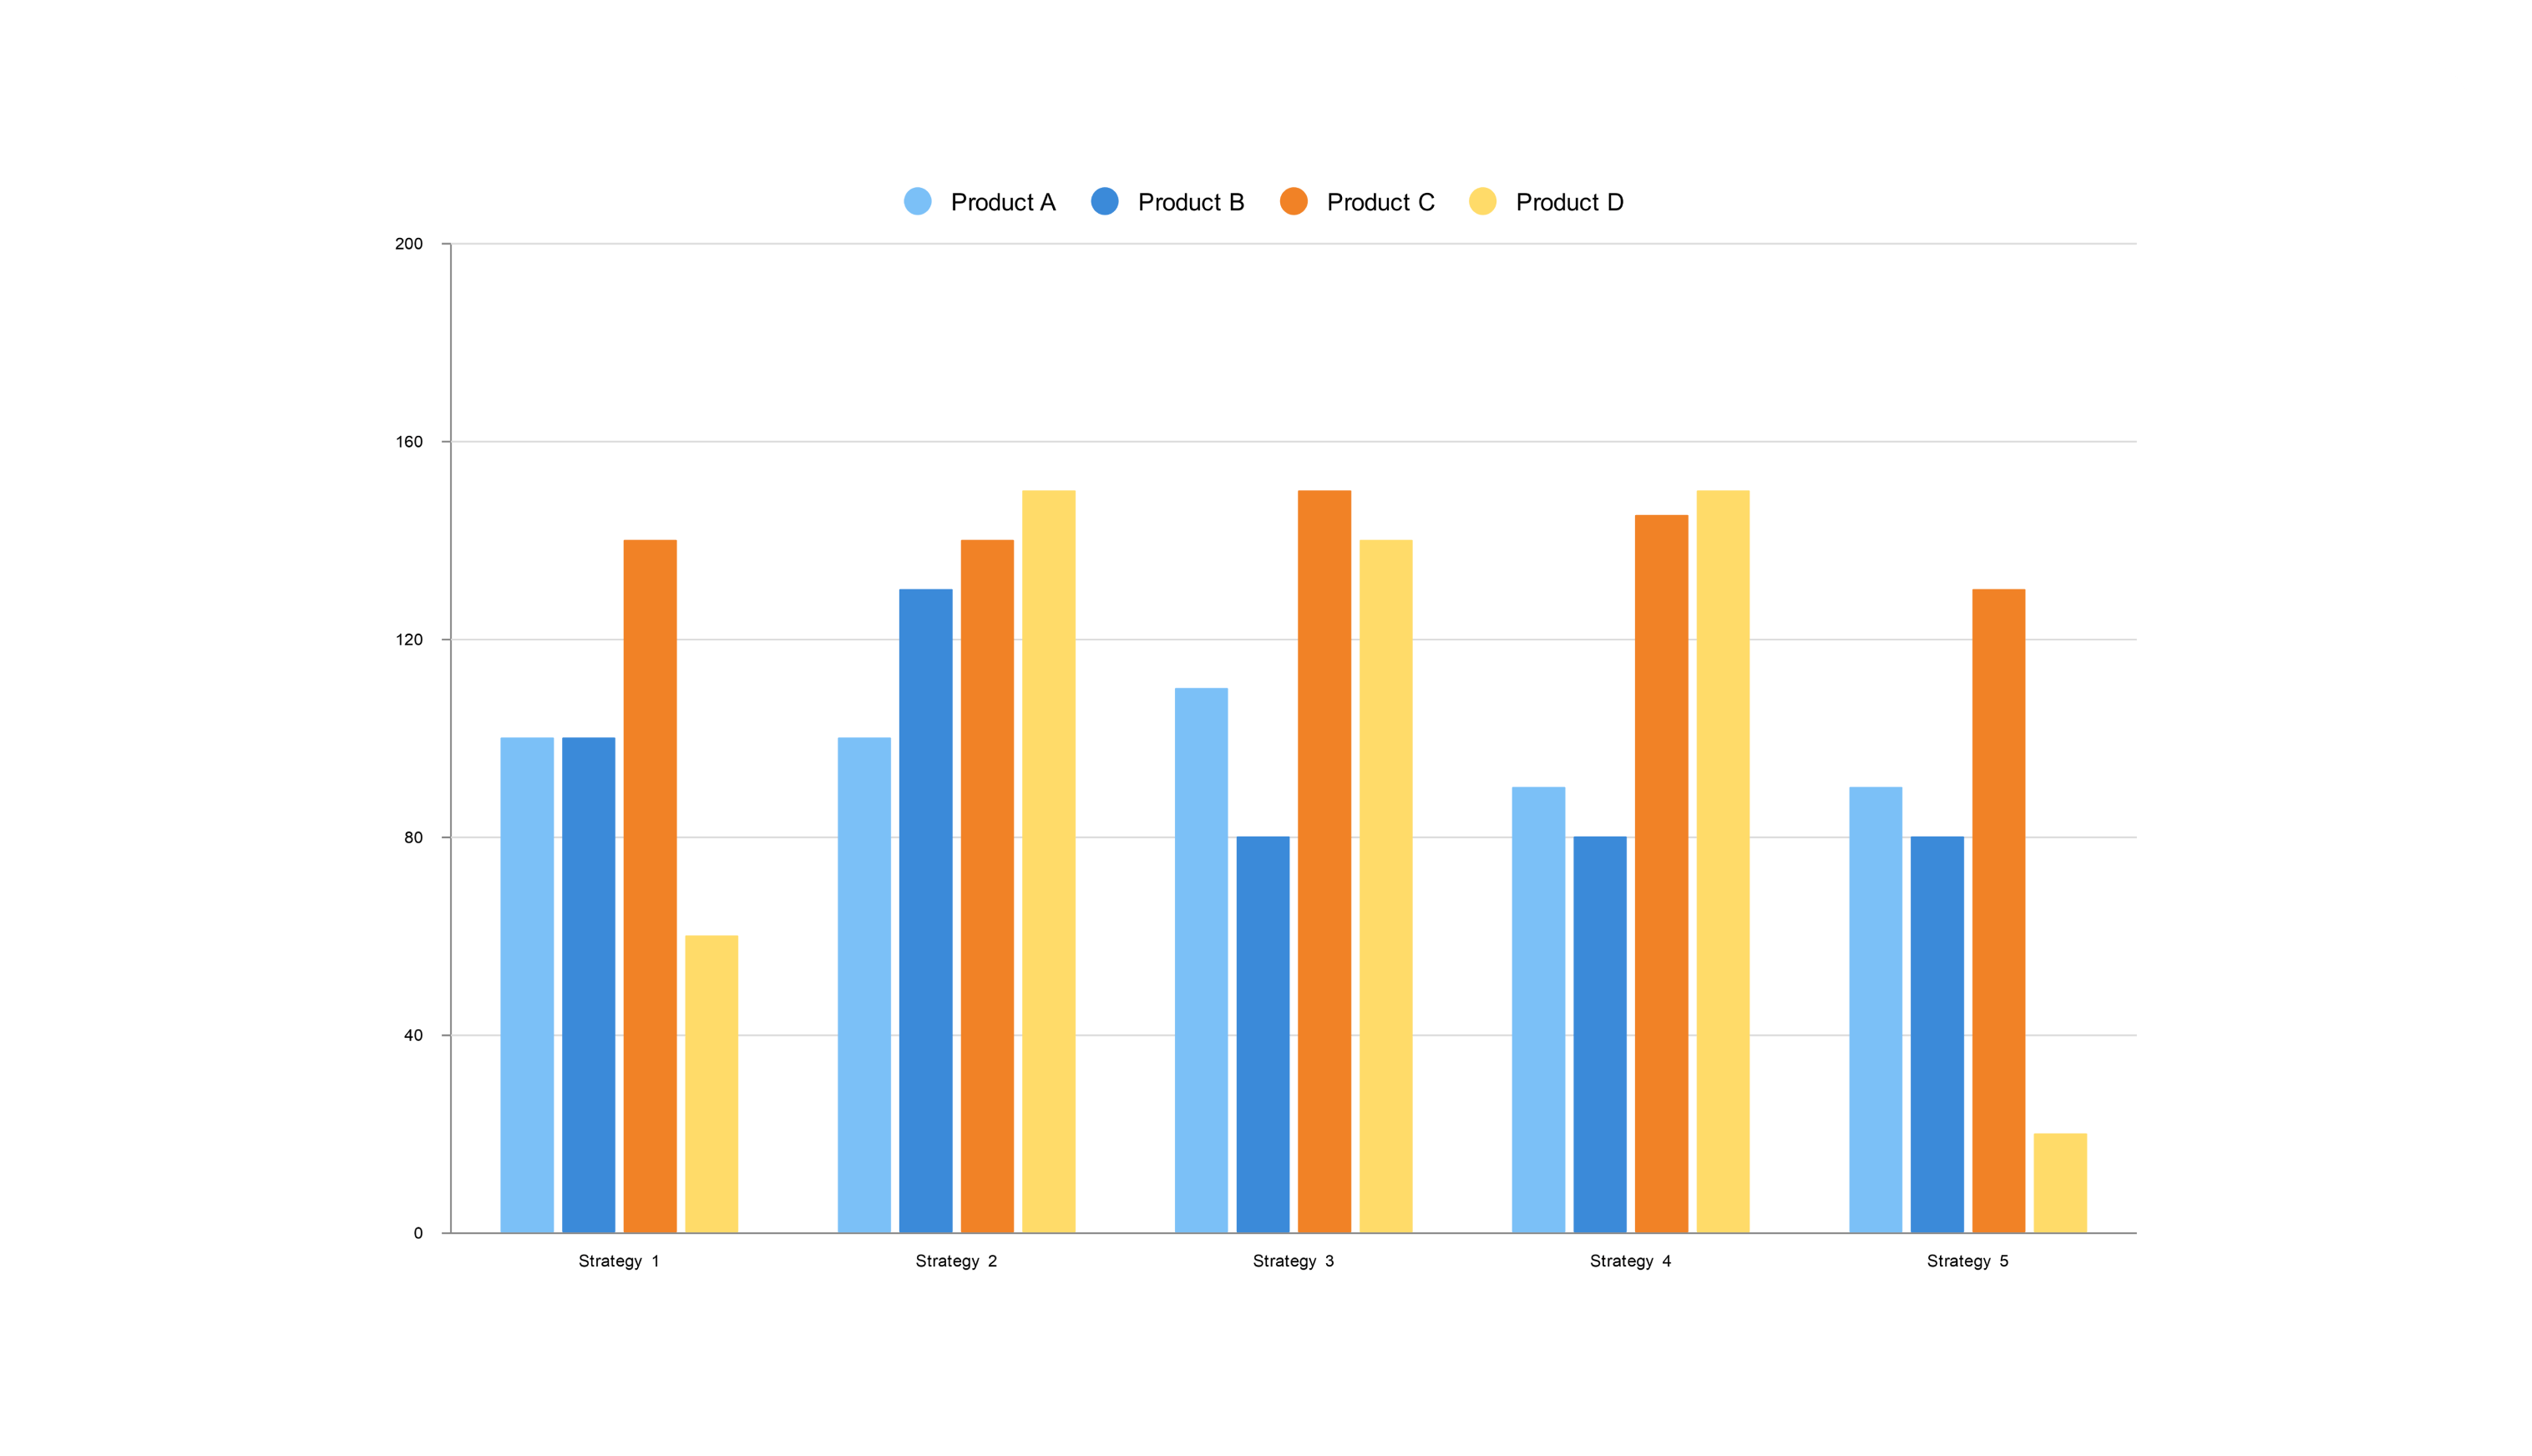
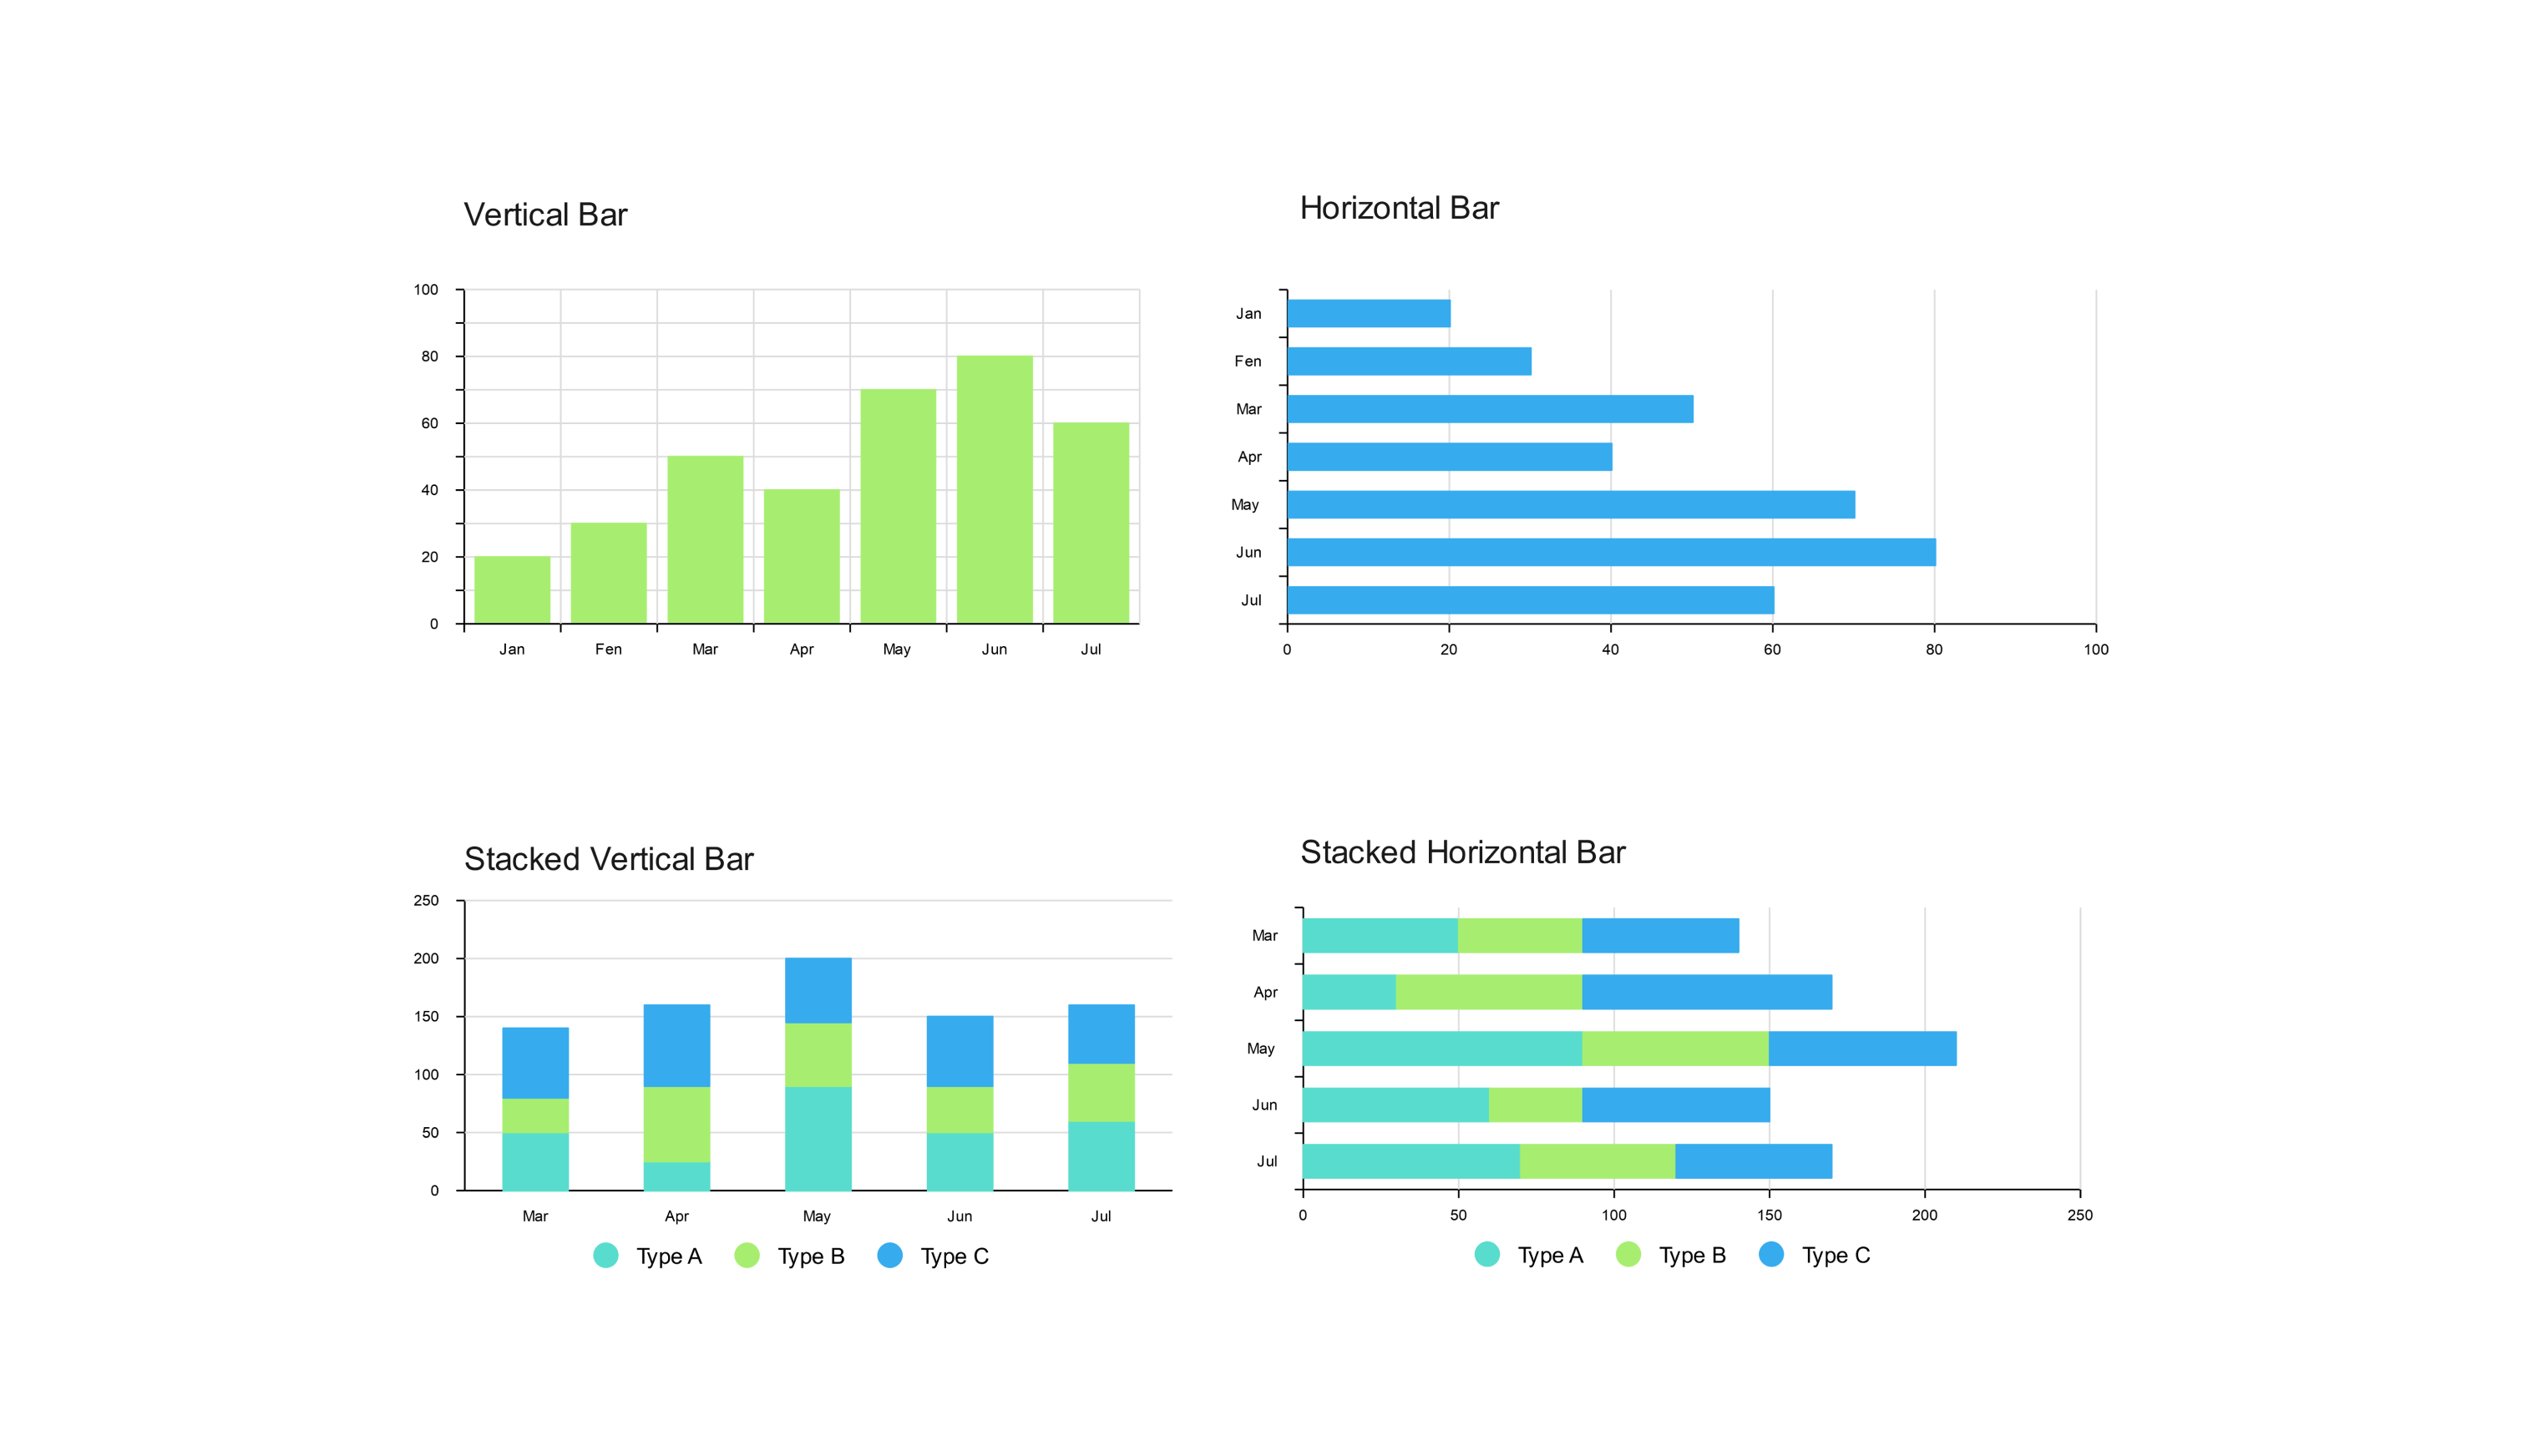
This bar chart template can help you understand literacy scores. It shows you how different grade levels are doing in key literacy areas like phonics and comprehension. Each grade gets its color, making it easy to see who's excelling and who might need extra support.
Designed to be super clear, it lets you quickly grasp the information and take action. Also, you can easily tweak it in EdrawMax to fit your specific needs. Teachers, principals, and anyone who wants to track and improve literacy instruction can use it.
Spot trends and pinpoint areas for growth to tailor your teaching strategies. It's all about empowering you to make an enormous impact on your students' literacy journey.
Related templates
Get started with EdrawMax today
Create 210 types of diagrams online for free.
Draw a diagram free Draw a diagram free Draw a diagram free Draw a diagram free Draw a diagram free


