- Templates
- Bar chart templates
- Grouped bar chart
About this template
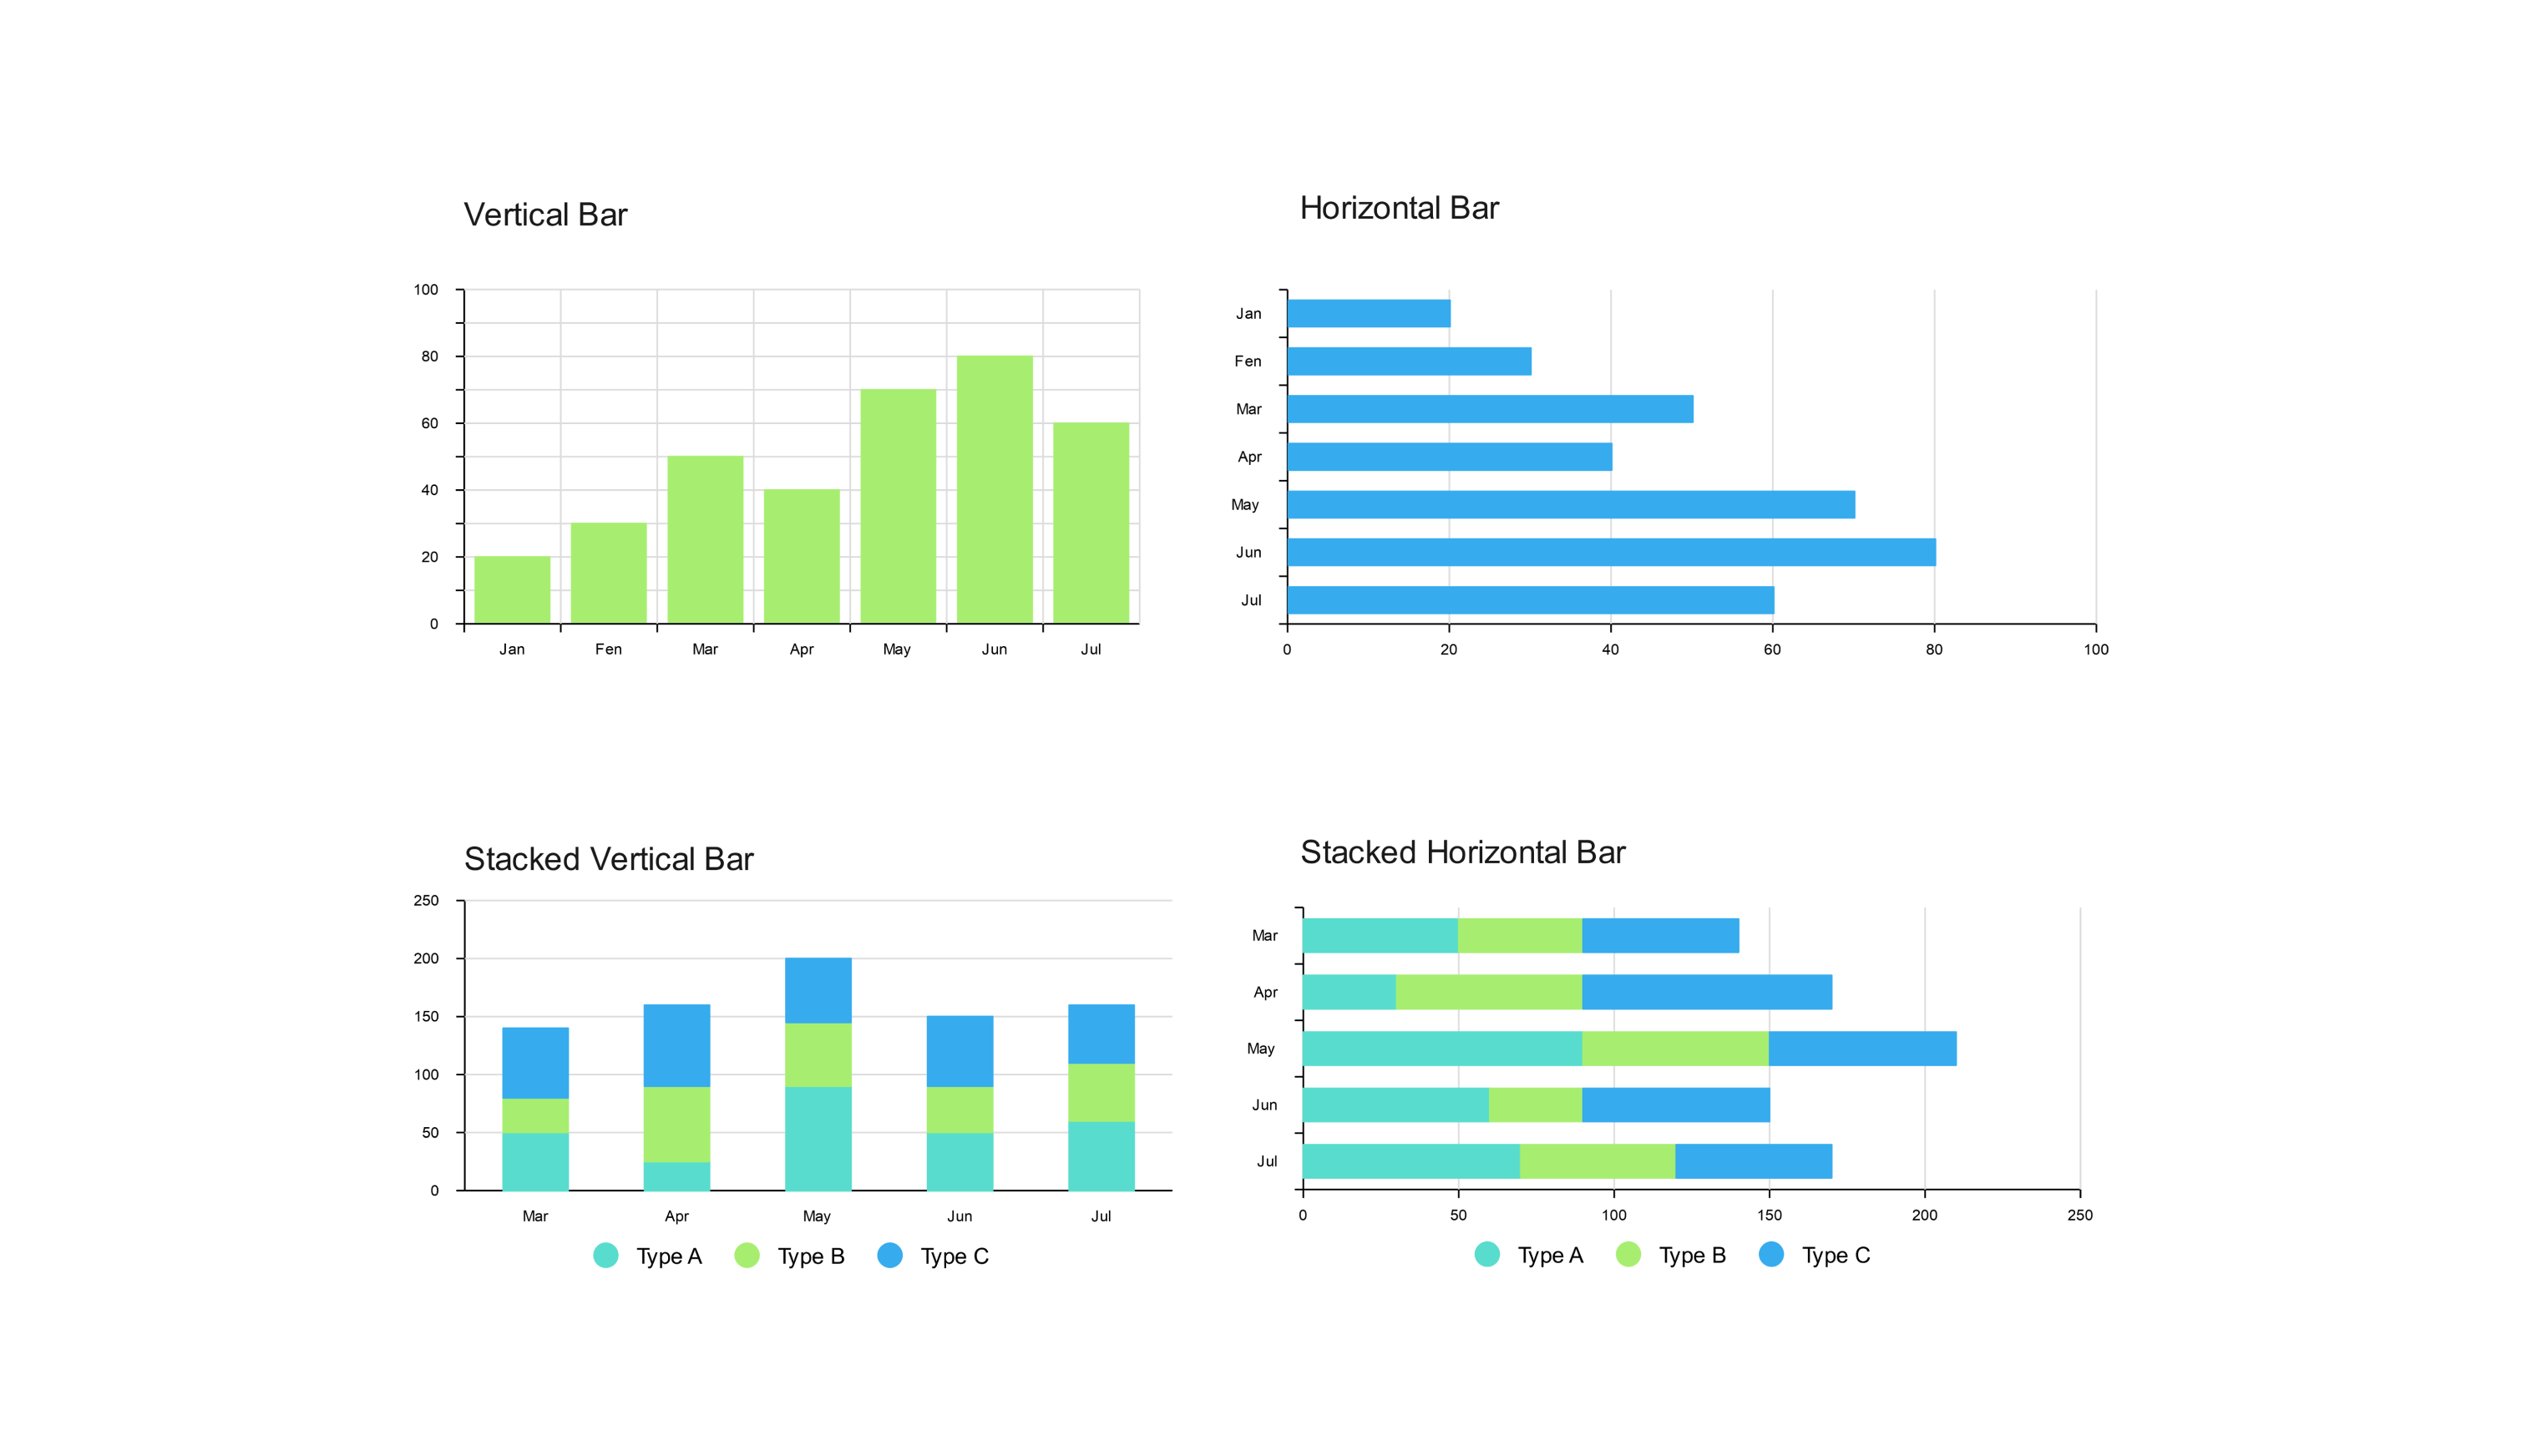
This comprehensive but simple template has grouped four bar charts: vertical, horizontal, stacked vertical, and stacked horizontal. Each bar chart shows three data types (A, B, C) across four months (Jan, Mar, Jun, Jul).
Use the vertical or horizontal charts to easily compare each type and see how things change over time. The stacked charts are perfect if you're more interested in how things add up. They show each type's contribution to the total.
You can even personalize the colors, fonts, and data to fit your needs. It saves you valuable time and helps you make anything like a business presentation or a school report.
Related templates
Get started with EdrawMax today
Create 210 types of diagrams online for free.
Draw a diagram free Draw a diagram free Draw a diagram free Draw a diagram free Draw a diagram free


