- All templates
- Bar Chart templates
- Segmented bar chart
About this template
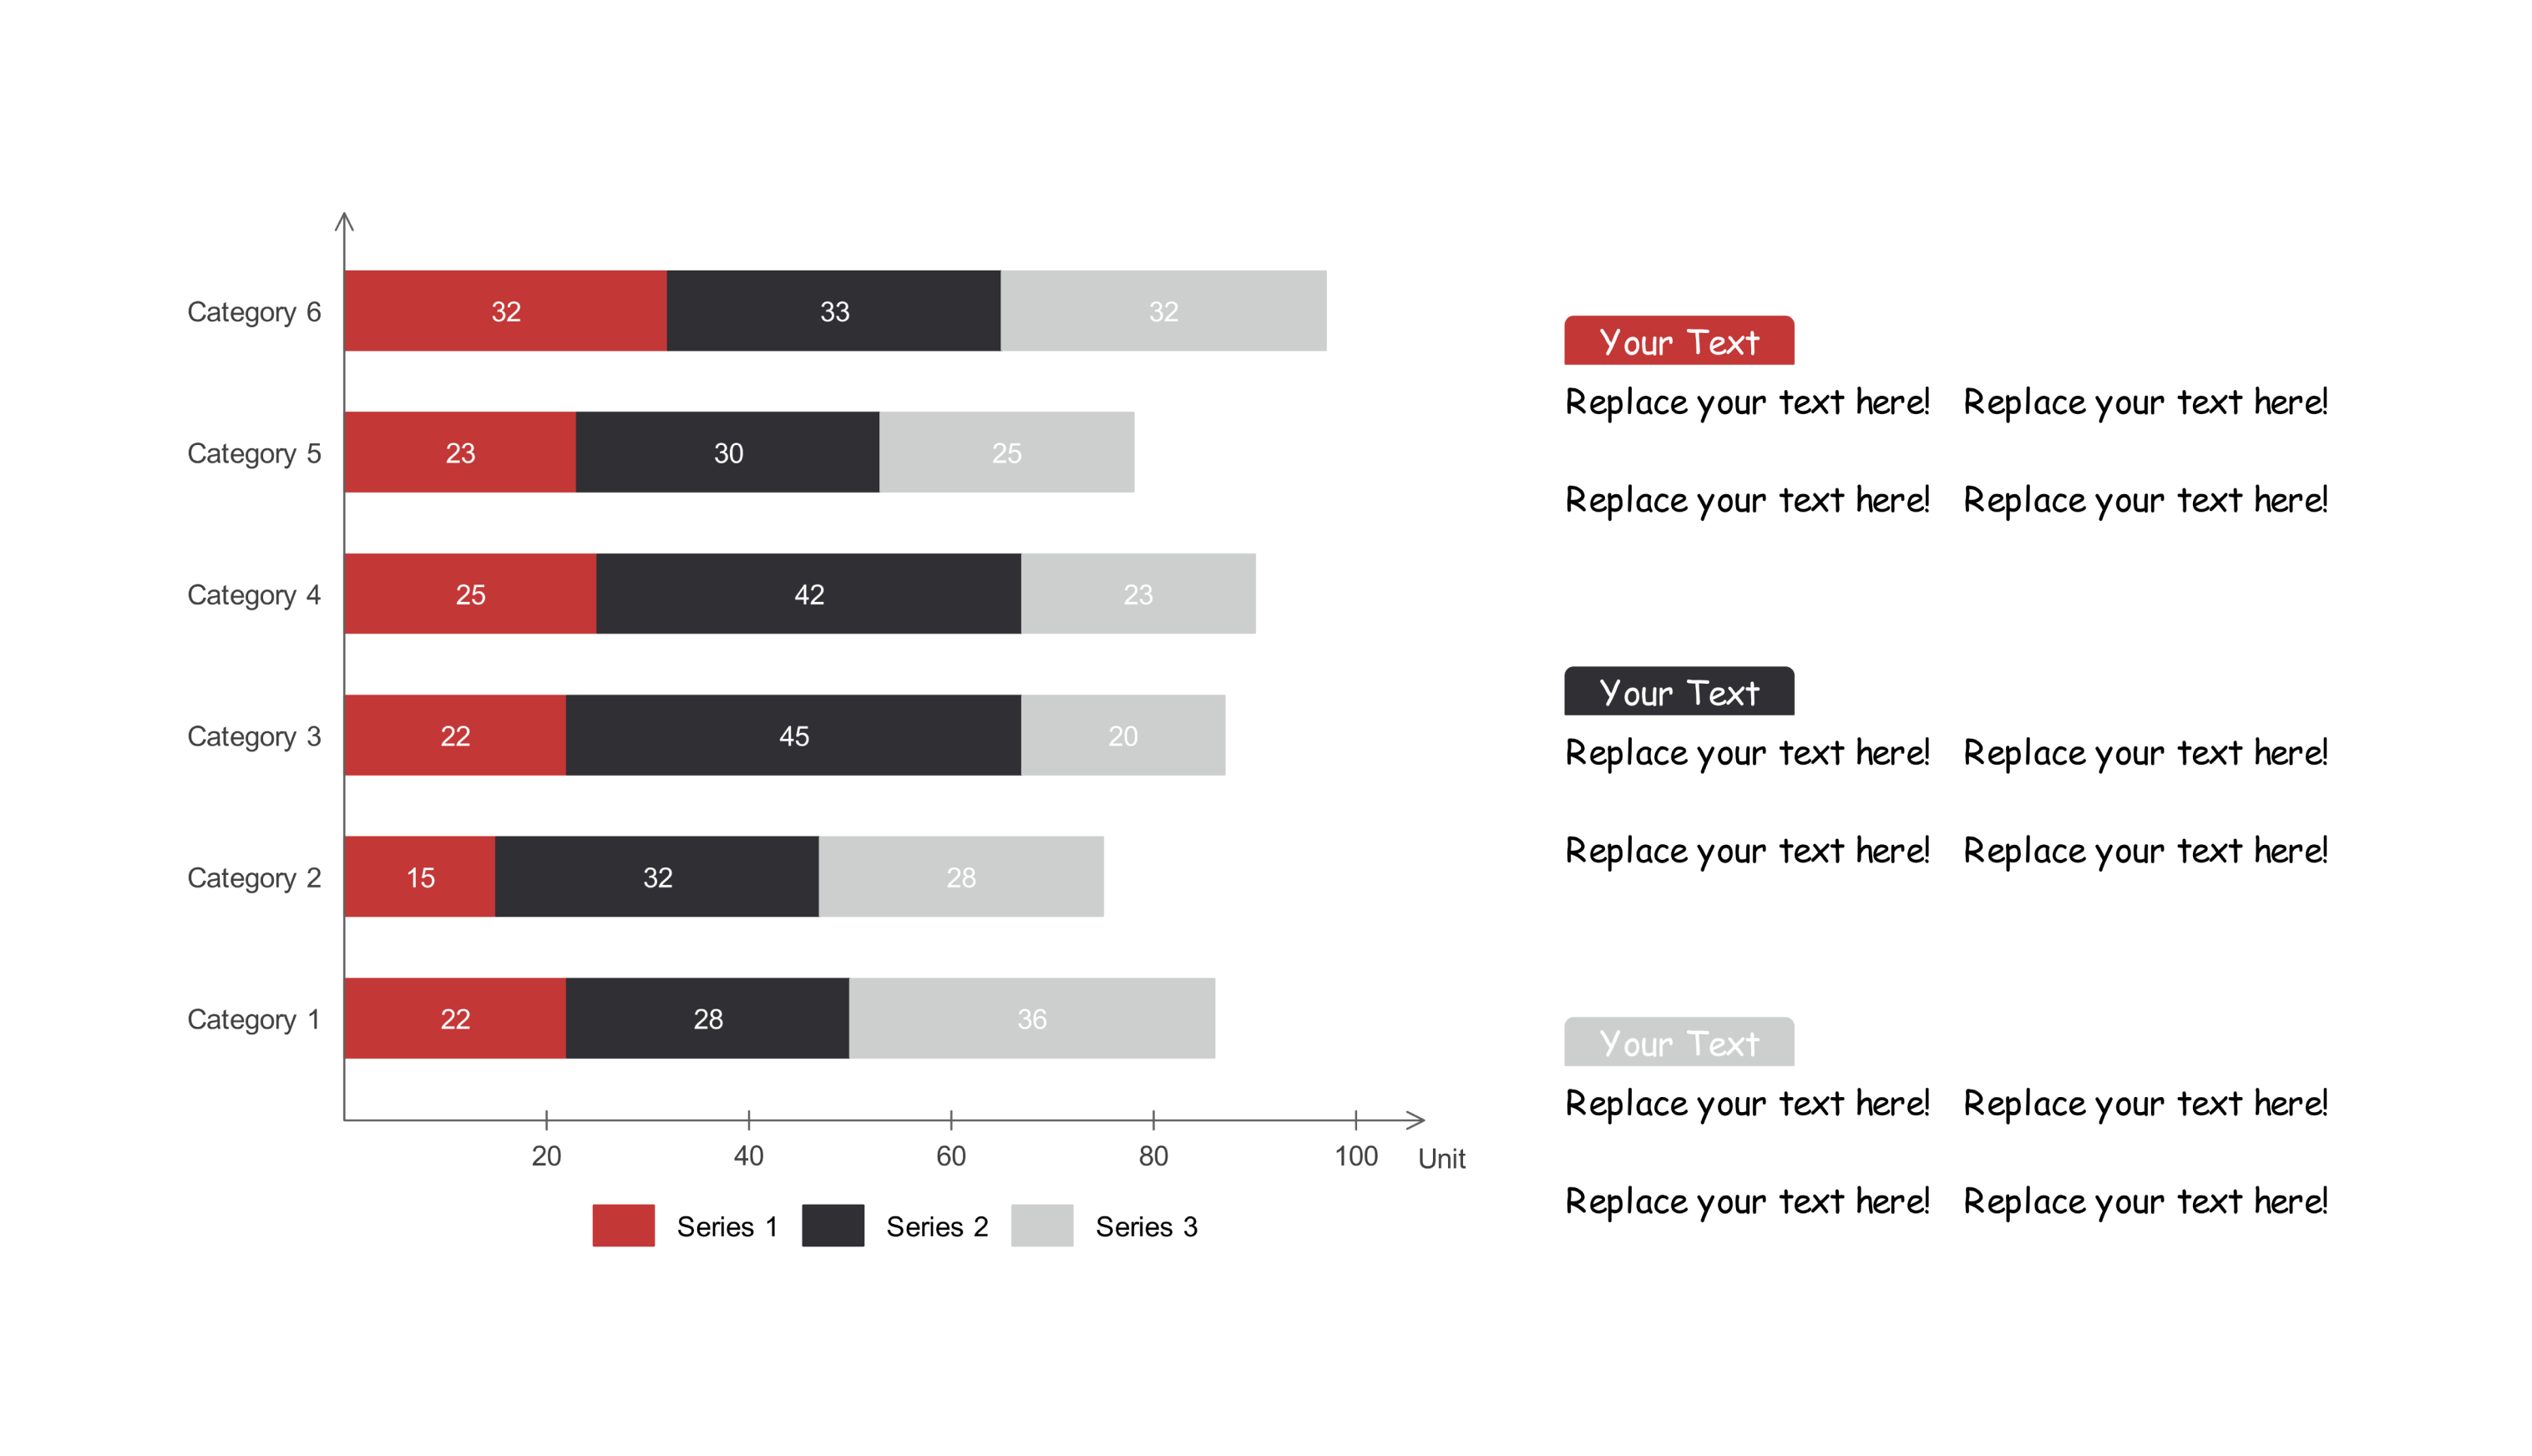
This segmented bar chart represents how different things fit together in a group. See how the categories compare within each group and how things change across different values. You can quickly spot patterns and trends, making it great for understanding your data.
The two groups (Group X and Group Y) are stacked up across different shapes and frequencies. Each bar is split into colorful sections, each section within a bar showing a specific category. The longer the section, the more important that category is.
It's really adjustable for showcasing your findings clearly and interestingly. Modify the colors, labels, and data to personalize it.
Related templates
Get started with EdrawMax today
Create 210 types of diagrams online for free.
Draw a diagram free Draw a diagram free Draw a diagram free Draw a diagram free Draw a diagram free


