- Templates
- Bar Chart templates
- Summer temperature comparison chart
About this summer temperature comparison chart
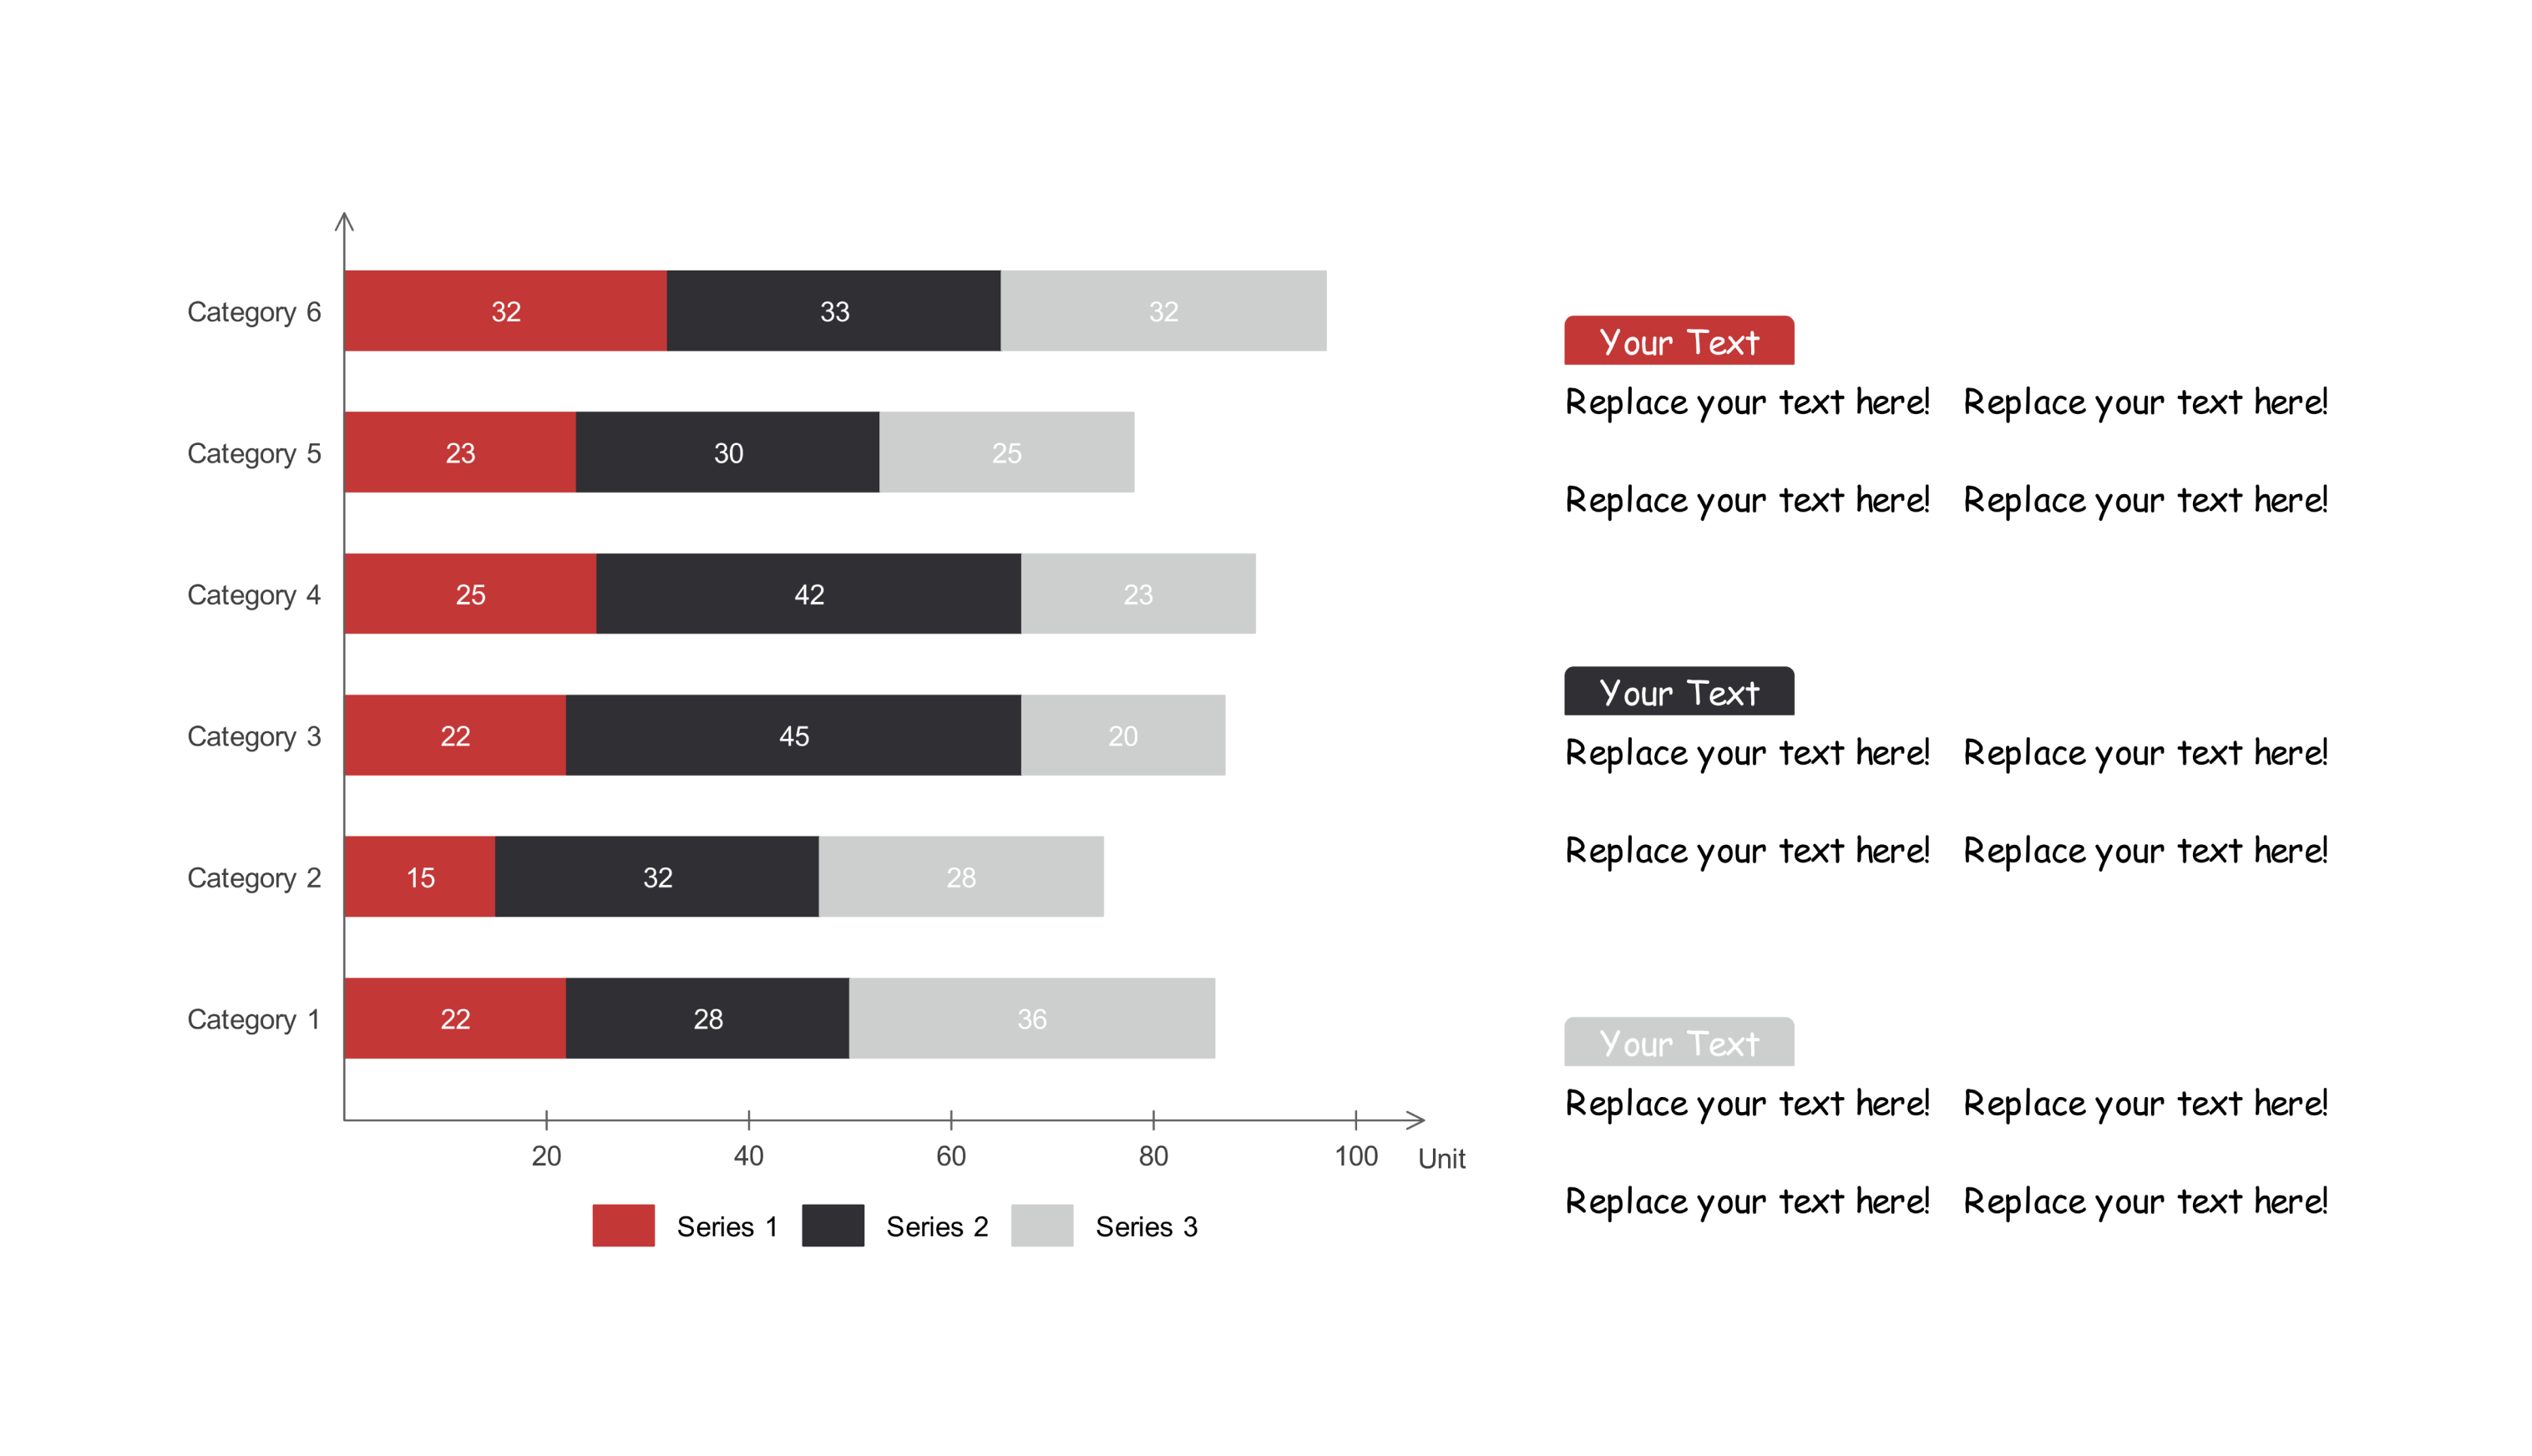
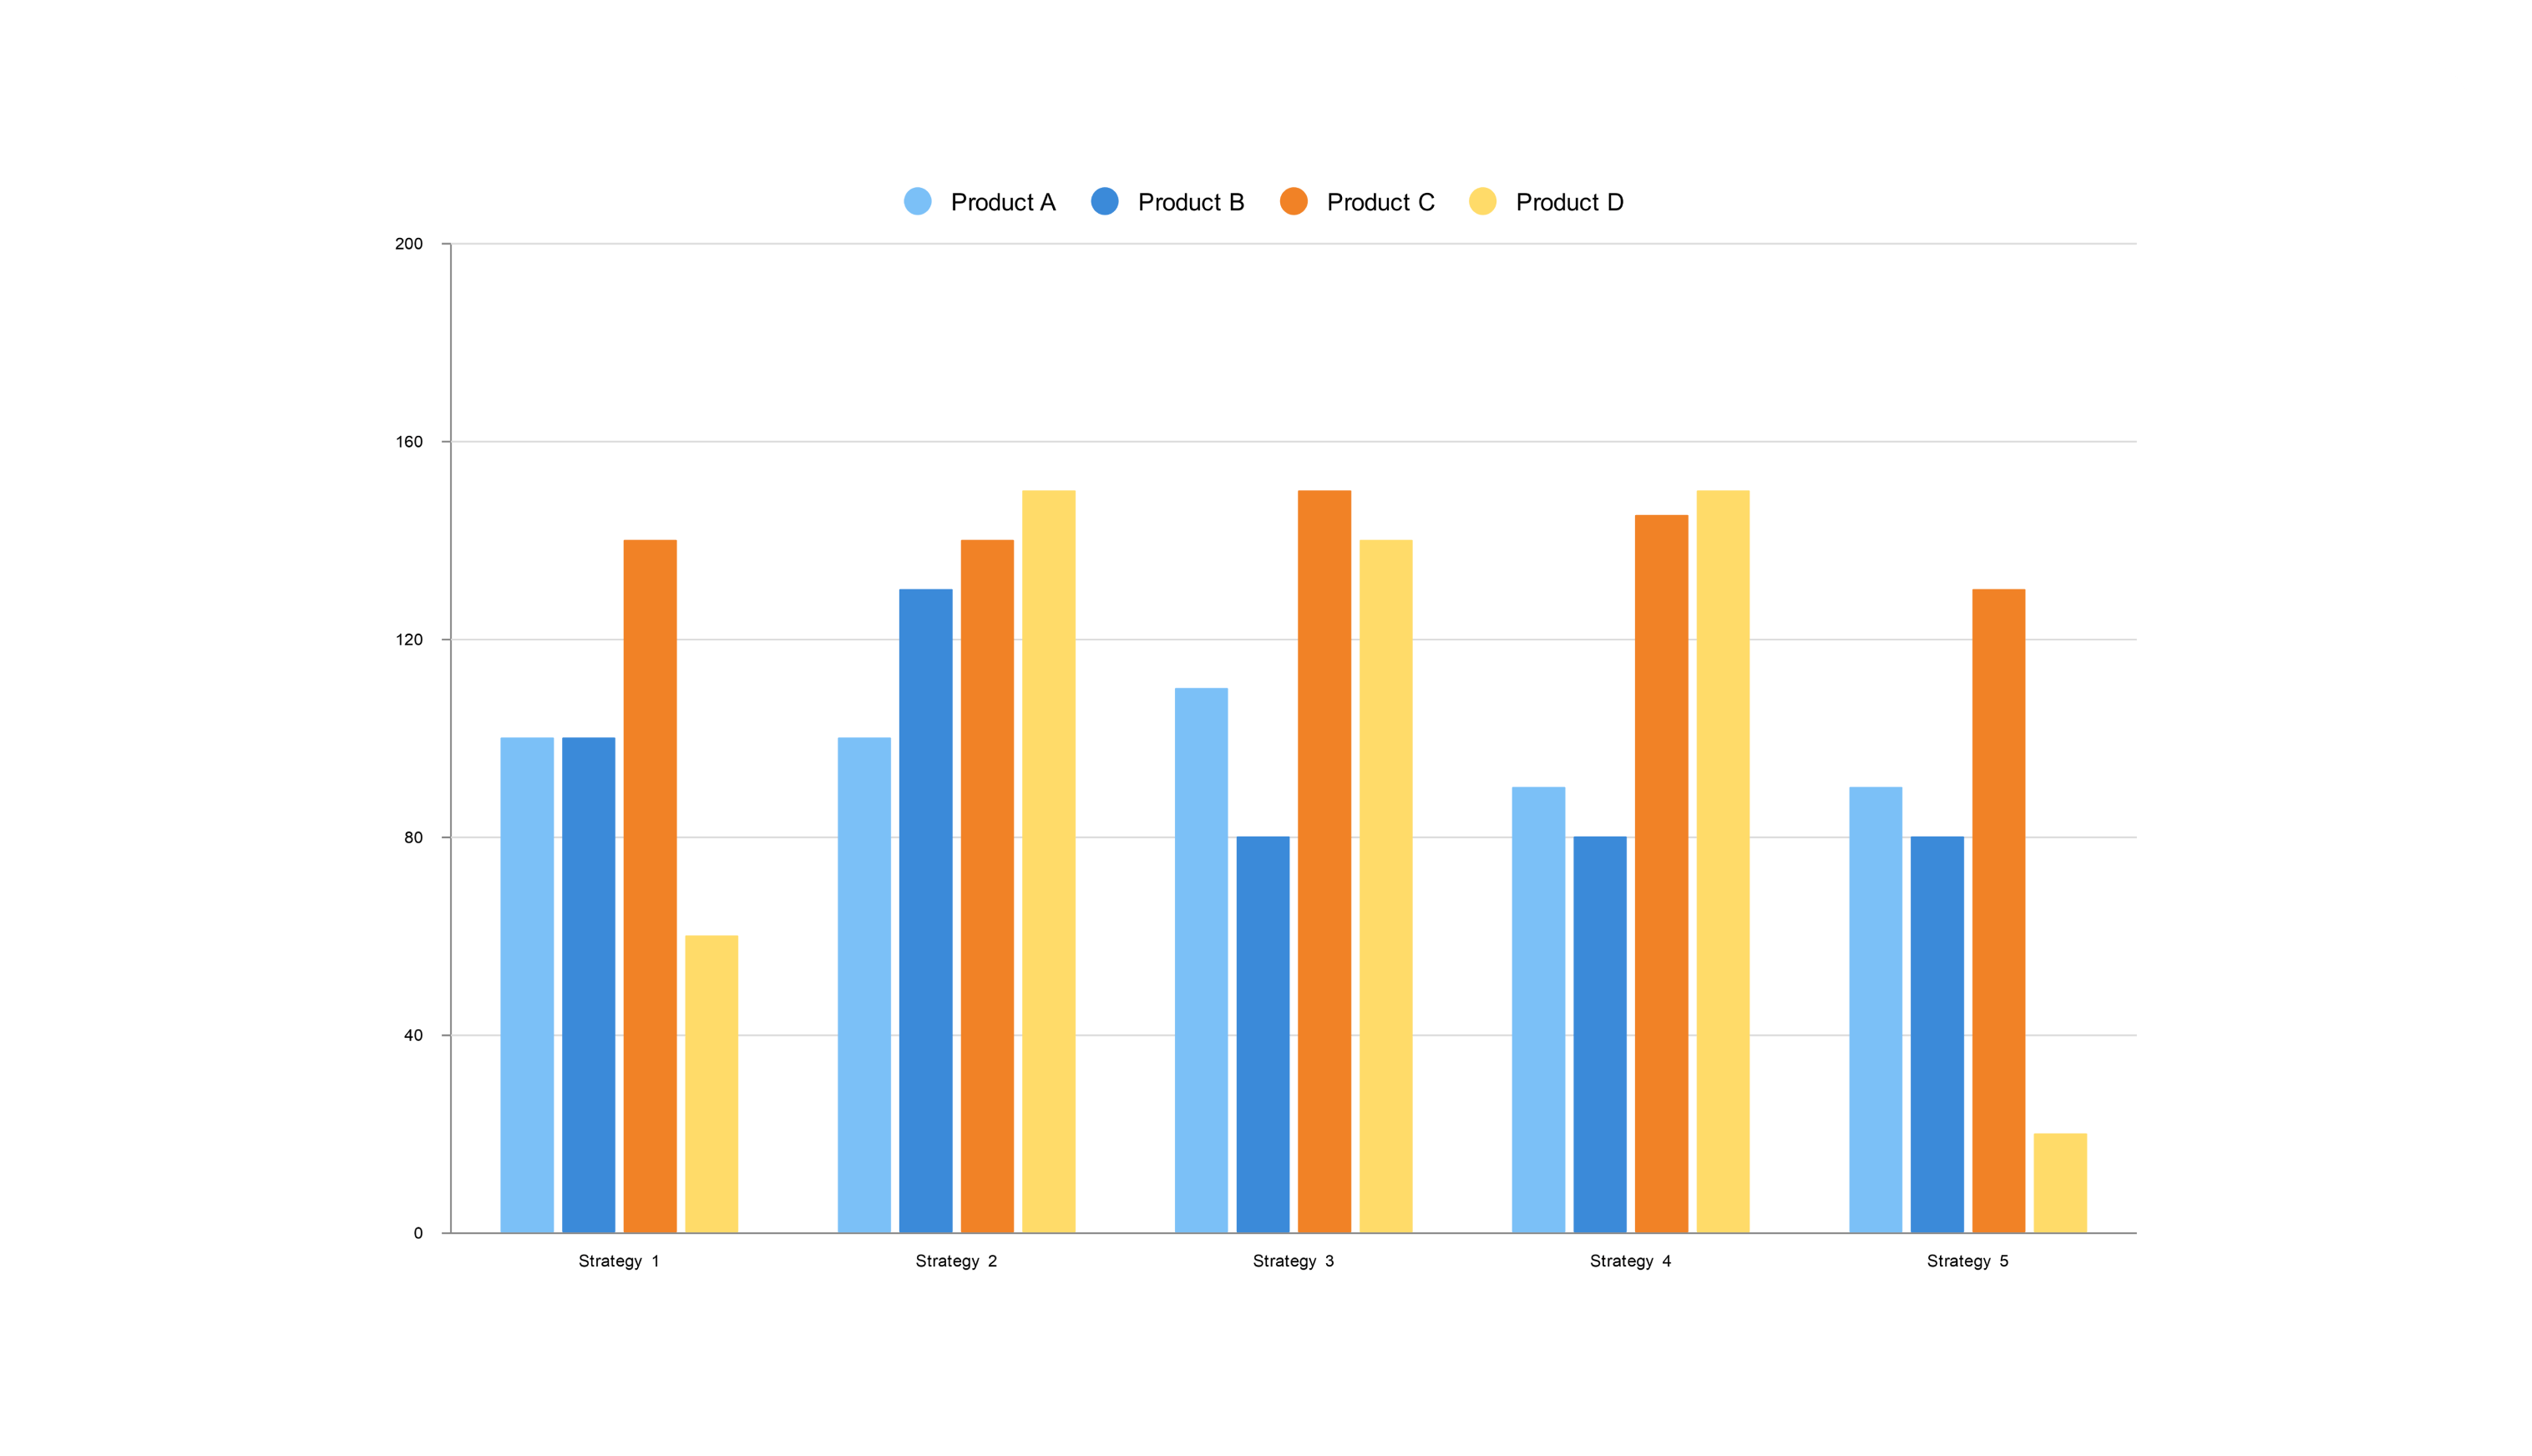
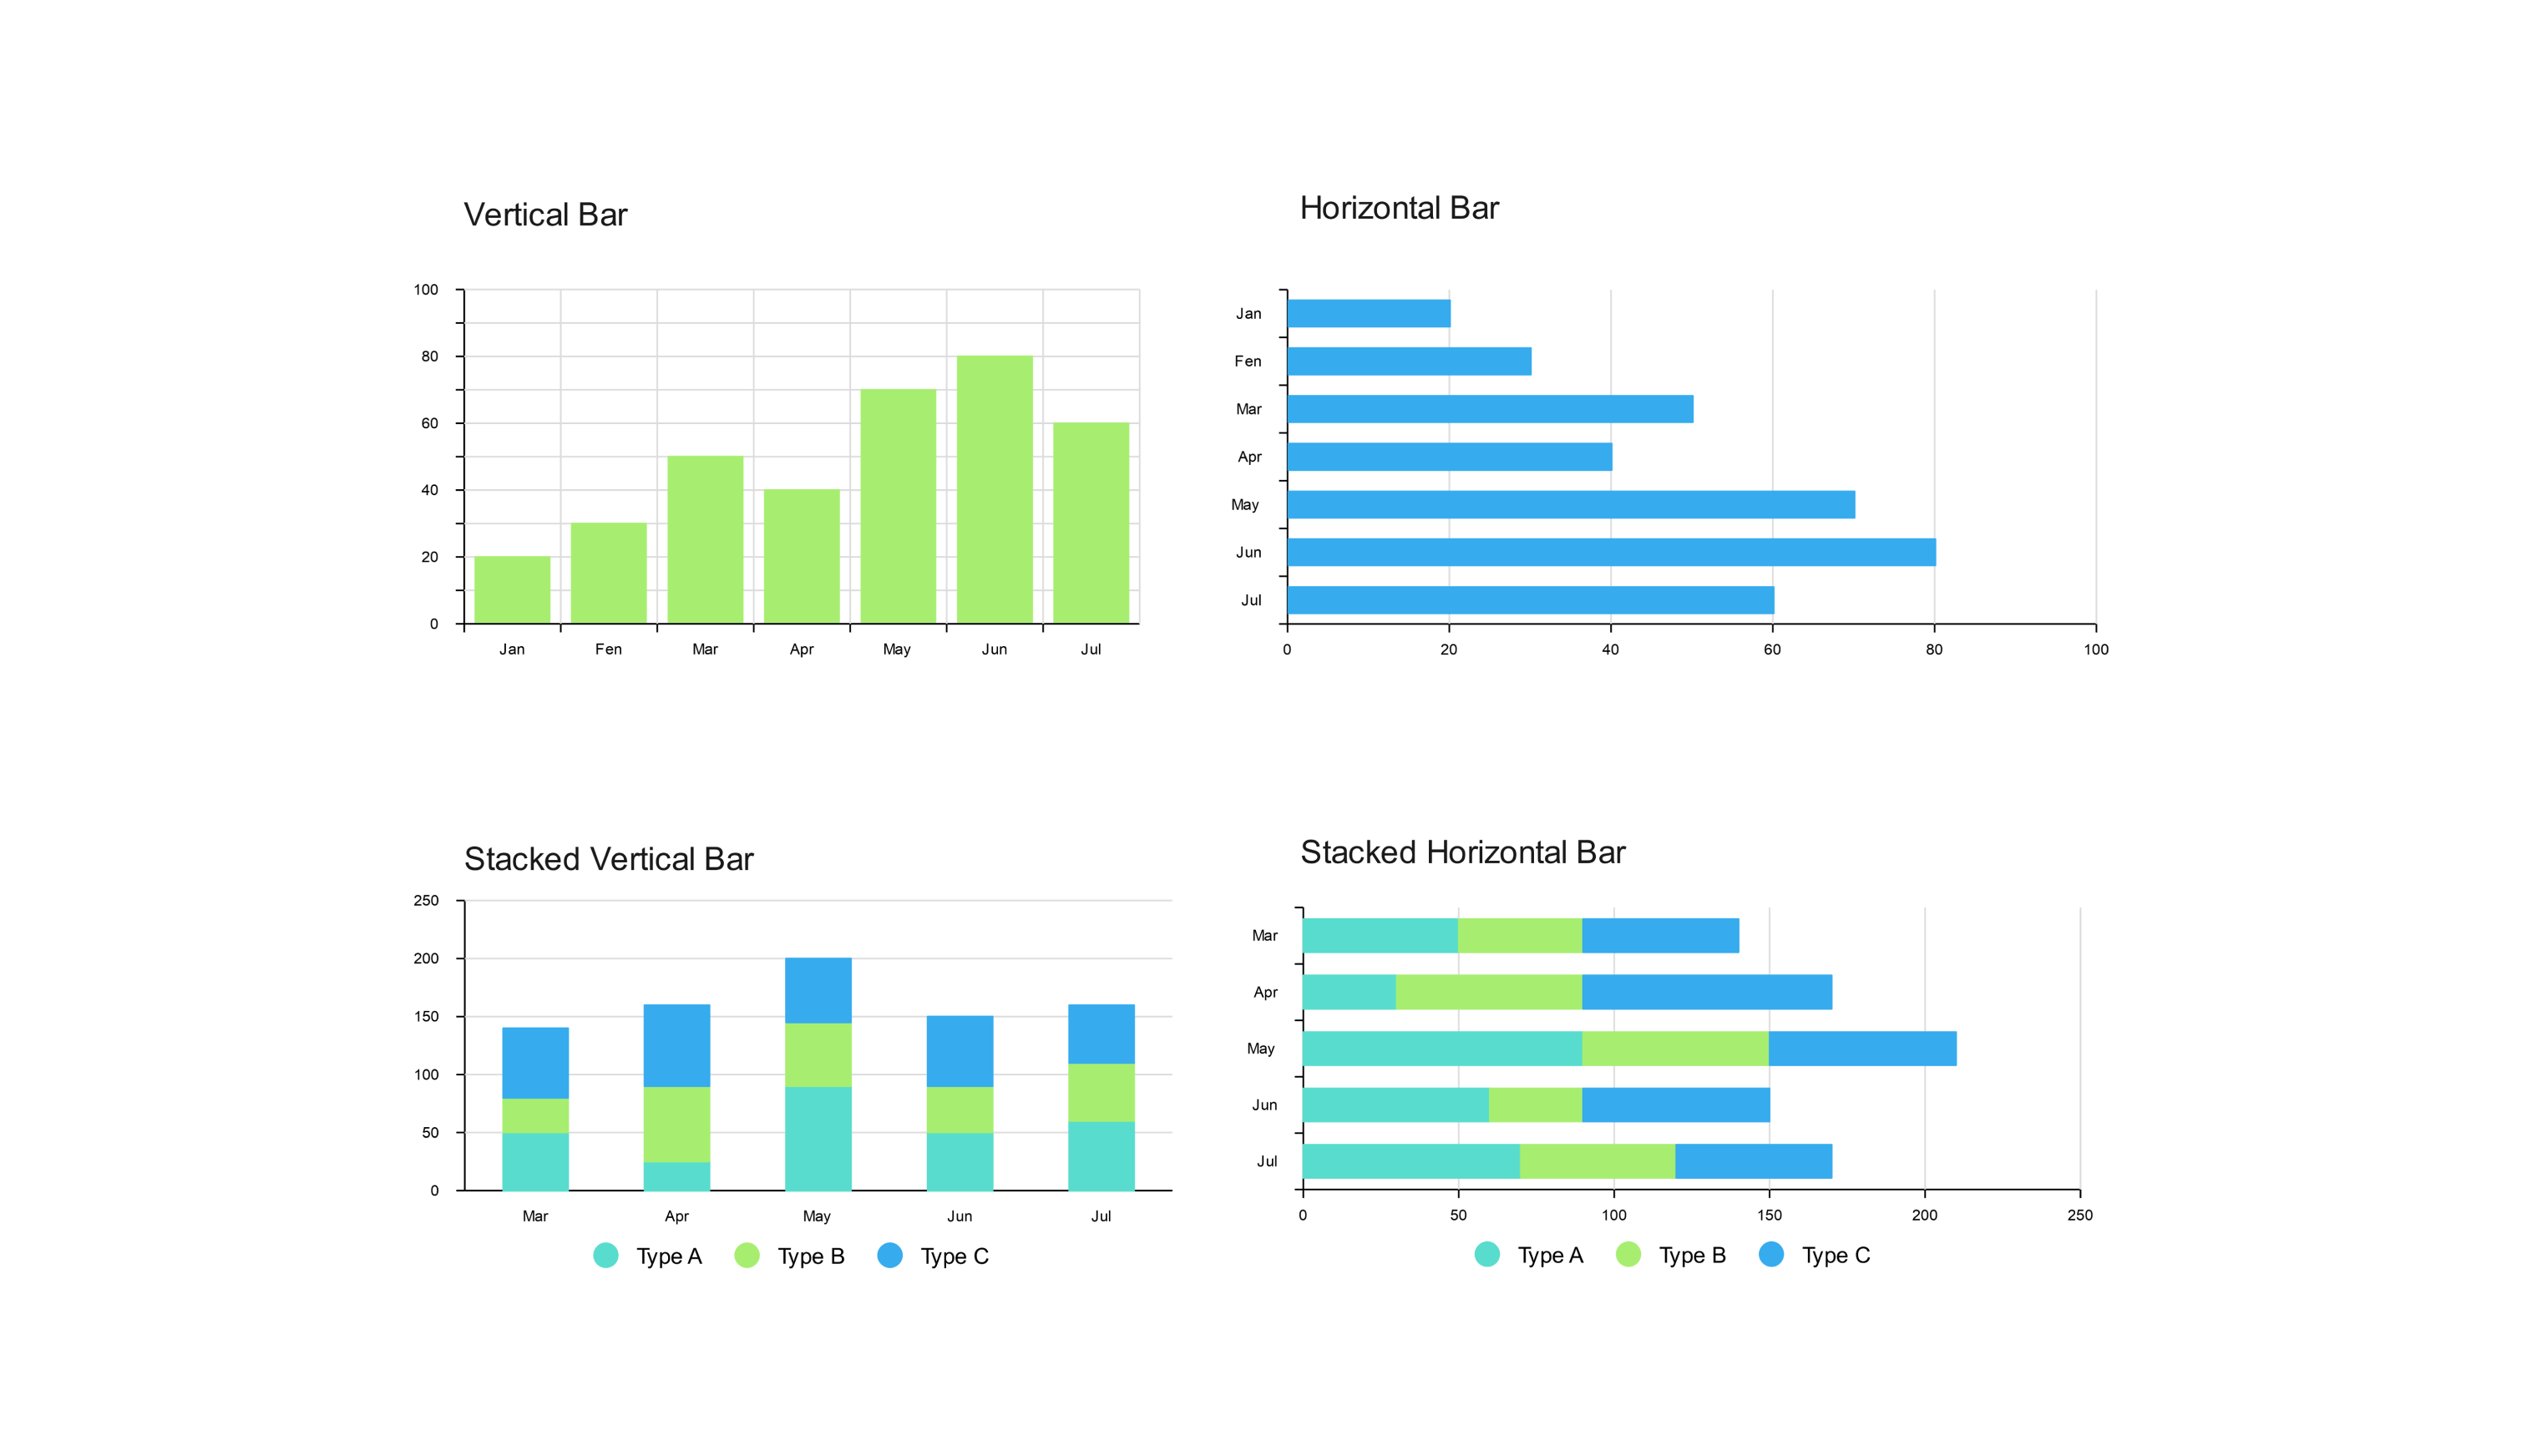
The Summer Temperature Comparison Chart shows how hot it gets in different cities during the summer. Every bar represents a city and its temperature.
You can plan your next summer getaway or satisfy your curiosity about weather patterns with it. See red-hot places and milder ones, identifying the hottest and freshest spots.
You can personalize it in EdrawMax by adding or removing cities and tweaking it to fit your needs. Whether you're a weather enthusiast, a traveler, or even someone interested in the know, it is a valuable tool.
Related templates
Get started with EdrawMax today
Create 210 types of diagrams online for free.
Draw a diagram free Draw a diagram free Draw a diagram free Draw a diagram free Draw a diagram free


