ER diagram for movie
Visualize the cinema architecture with the help of ER diagram.

- All templates
- ER diagrams templates
- ER diagram for cinema
About this ER diagram for movie
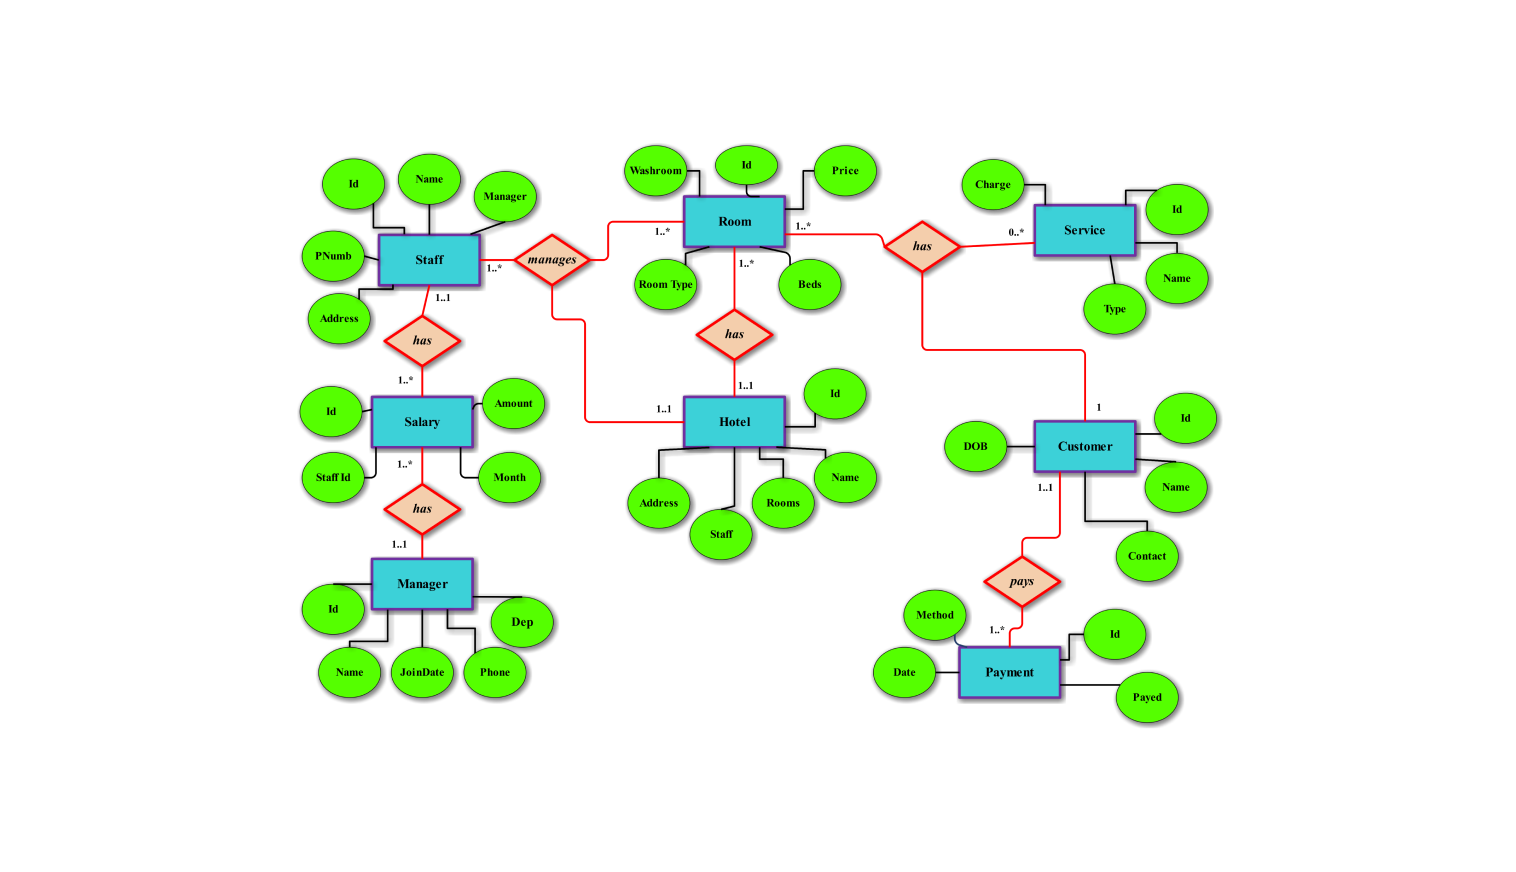
The cinema ER diagram system gives a high-level view of the internal working and processes of a typical cinema’s operations. The diagram visually represents how tickets are booked and how many movies are screened. It also highlights the relationships between different entities.
The main entity in this system is the "Customer", who are the people that go to the cinema to see movies. The customer can book 1 or many tickets to one show.
The “Ticket” entity represents the tickets in the cinema system. Ticket is related to a show and each ticket is unique to its show. In the system, a ticket is for a single show and the show entity is defined as a movie playing at a set time for the viewers.
The "Show” entity is the association of a specific “Movie” and is shown on a specific “Screen” in a theater. Each show is a single thing which customers can book tickets. Movie entity is the list of the movies that are provided to the customers, each movie could have multiple shows and on different times and screens.
The “Screen” is the entity for showing the different shows in the cinema system. Screens are within the “Theater” with the theaters running in a number of projections and in different rooms. This allows multiple shows to run of the cinema’s system and allowing customers to choose from the movie options when visiting the cinema.
The ER diagram also shows the relationships between the entities. Customers register and book tickets for a show, a show is set-up around a movie and each screen belongs to a theater.
How to use this template
To get started simply click on the Use this template option. Once the template opens up you can personalize the diagram by dragging and dropping shapes from the libraries located on the side. Customize the layout to suit your systems requirements.
Edit and enhance your diagram by interacting with the text boxes and entering your content. Adjust the appearance of lines, boxes and text by choosing elements and utilizing formatting features provided by the platform. Save frequently used components, in your libraries for access when creating diagrams in the future.
When you're ready to share or save your diagram select a format. Click on "Export". Pick a file format such as(.eddx,.pdf,.png). Save the file, for reference. Distribute it with others as necessary.
Benefits of the ER diagram
An ER diagram, for a cinema system has advantages in terms of clarity and organization. This visual representation helps stakeholders quickly understand how different parts work together ensuring a view of the system. It is particularly beneficial for developers and database designers who need to turn business requirements into a database model.
By outlining entities and their connections the ER diagram ensures data accuracy and decreases duplication resulting in an effective database design.
Moreover, the ER diagram eases communication among stakeholders like developers, database administrators and business analysts. It serves as a shared reference point that aids in conversations and assists, in spotting any issues on during the design phase.
FAQs about the ER diagram
-
How do I make an ER diagram for my project?
Following are the steps to make your ER diagram
- Identify the entities within the system.
- List out the attributes associated with each of the entities and connect them.
- Identify the relationship between the entities and connect the entities using a diamond-like shape.
When designing an ER diagram, it’s a lot simpler when you use an online designing tool. Edraw Max is a free-to-use online platform where you can easily design your ER diagram.
-
Are ER diagrams used in the industry?
ER diagrams are one of the most widely used design tools to help visualize the entities involved inside the system as well as the relationship among the entities involved.
The diagram can be used by various stakeholders to better understand the workings of a system. Whether you’re a student, a teacher, or even the management of a company, ER diagrams will help you in your understanding of the system.
-
What do ER diagrams explain?
ER diagrams are used to describe a system's structure and involve the entities, attributes, and the relationship between them. They give a visual illustration of how data is arranged and how the various data entities are related in a given system, which helps design the database structure.
Related templates


Get started with EdrawMax today
Create 210 types of diagrams online for free.
Free Download Free Download Draw a diagram free Draw a diagram free Draw a diagram free