ER diagram example for final year project
Simplify your final year project with our ER diagram.

- All templates
- ER diagram templates
- FYP ER diagram
About this FYP ER diagram example
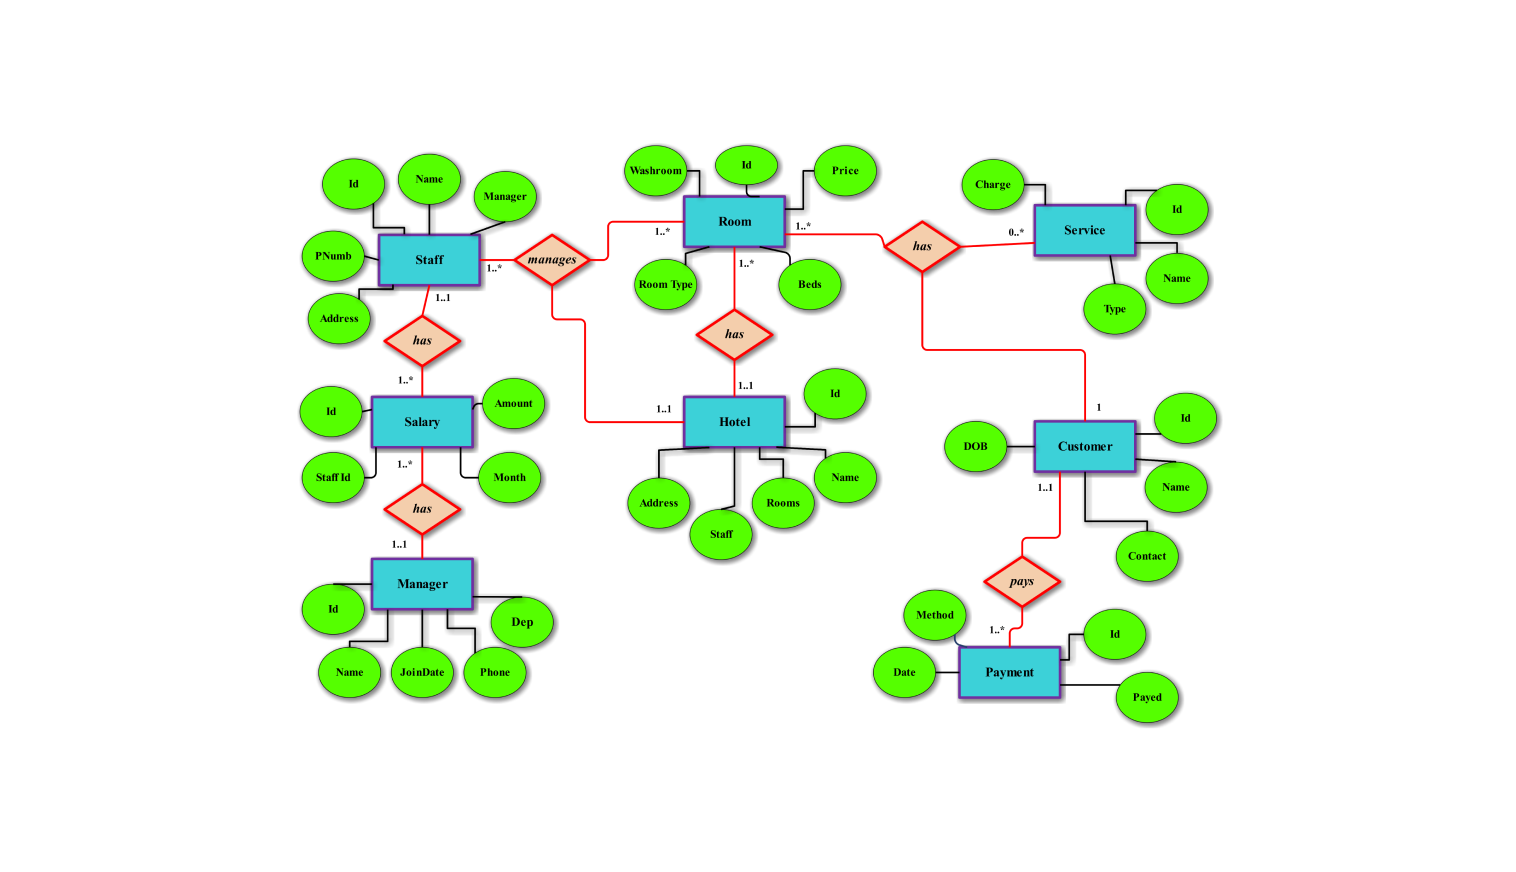
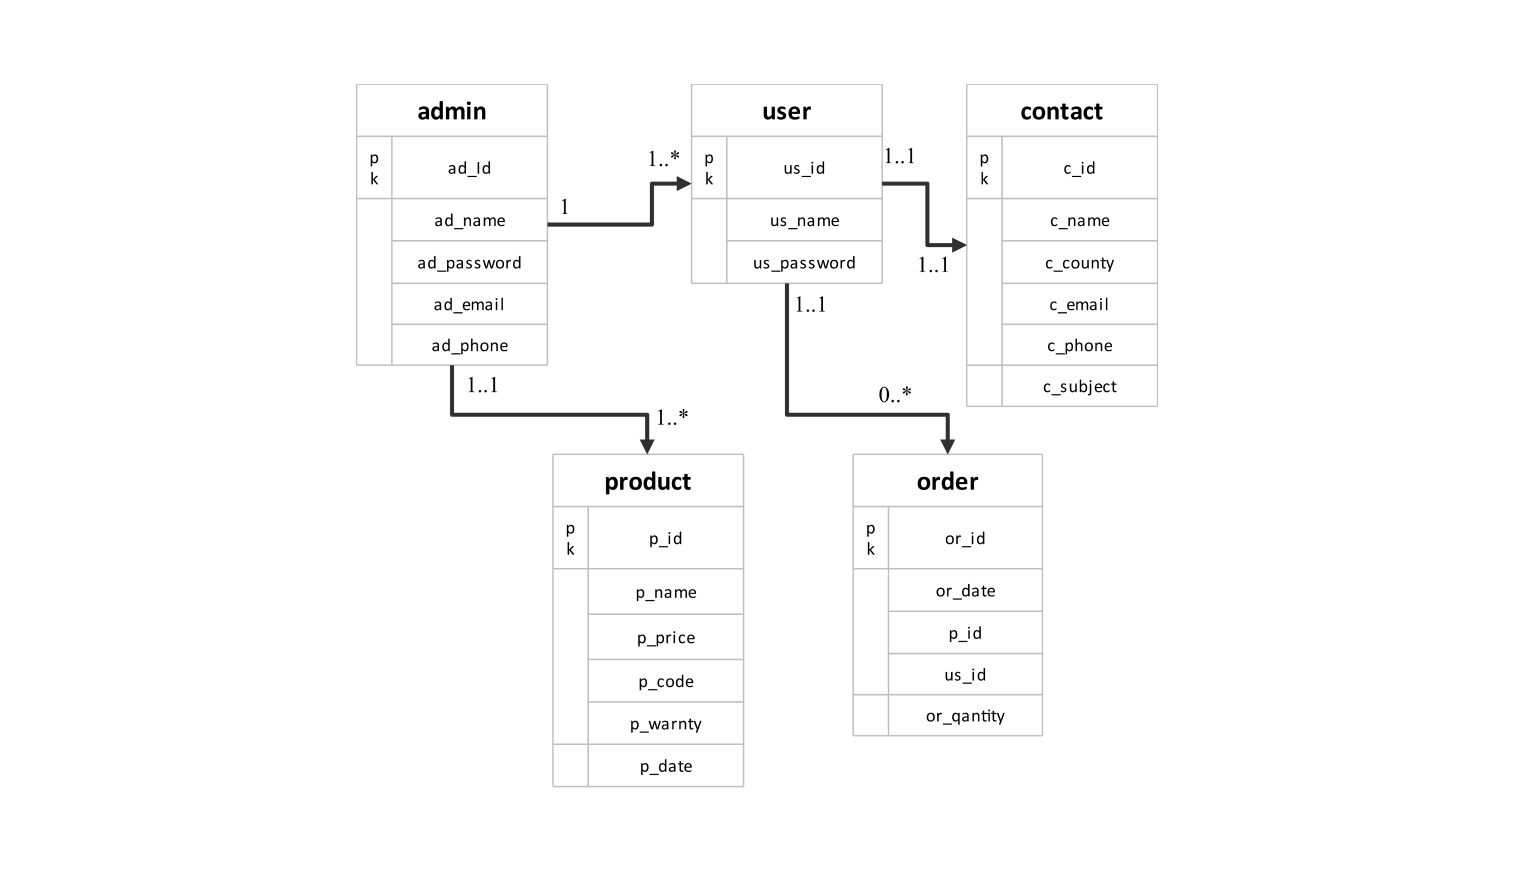
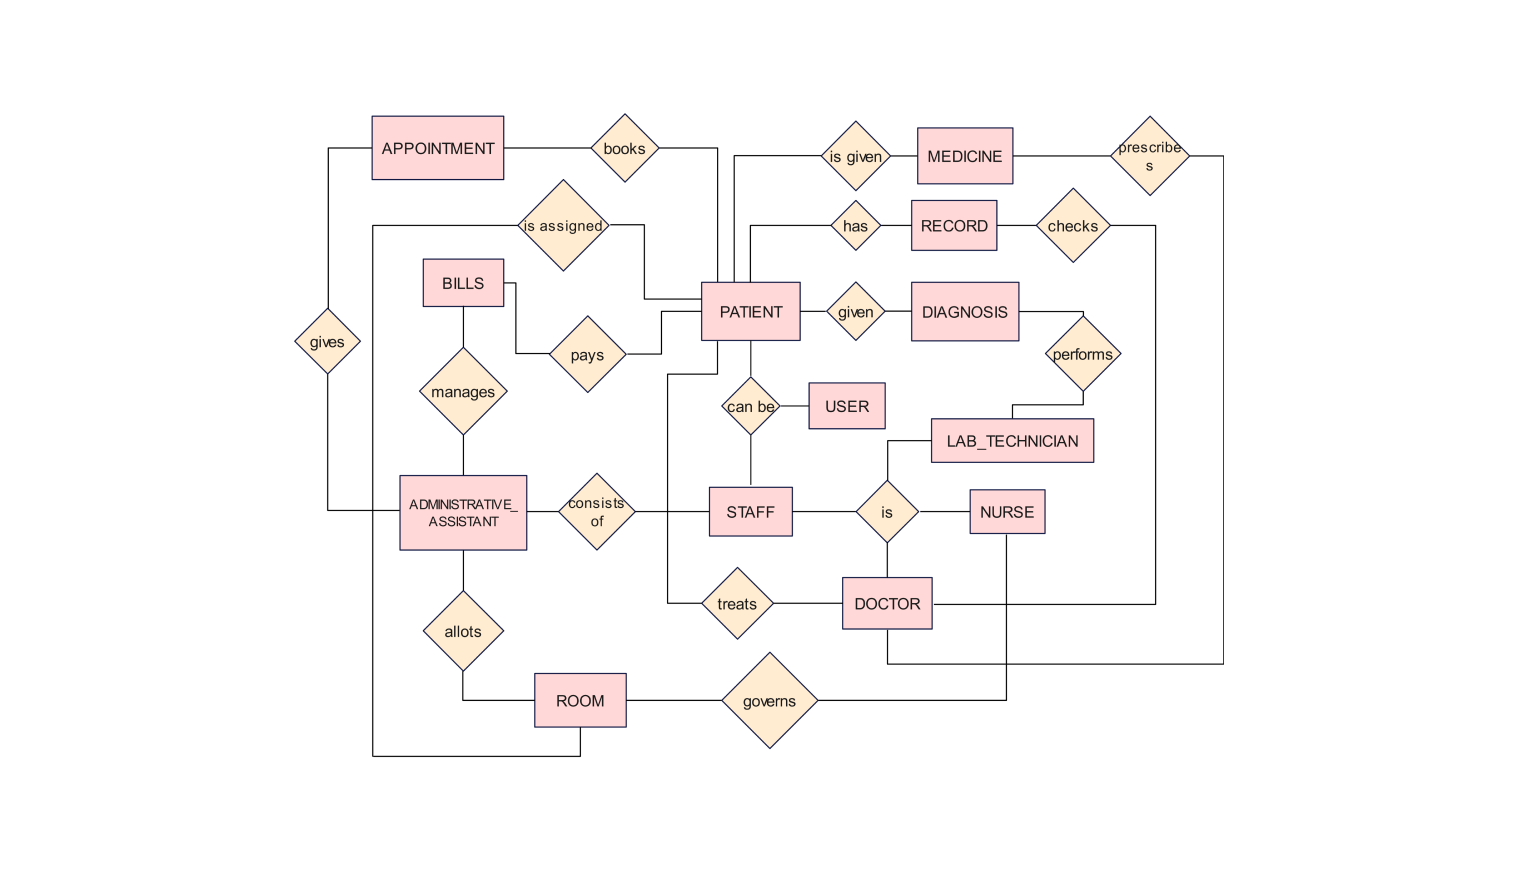
Following is an ER diagram for the final year project. The diagram illustrates the various stages of a computer science final-year project. The diagram also describes the characteristics of these stages.
Final Year Project for Computer Science involves creating a unique software or hardware project. It enables the learner to learn new material that could apply to the current degree program. Also, it allows the learner to apply what they have learned throughout their degree program.
FYPs might include fields like software engineering, artificial Intelligence, data analysis, IT security, IT networking, or human-computer interface. The project can be undertaken individually or in a group.
The first step involves designing a project proposal that gives an overview of the idea. It also lists out the duration as well as the stakeholders involved in the project. The second step is designing the scope document. The scope document defines the scope and the constraints of the project.
The third step is the creation of an SRS document. An SRS or Software requirement specification lists out the functionalities of the system. It serves as a blueprint for what the software must do. An SRS document may have various versions, depending upon the changes made in the requirements.
The fourth step is the creation of an SDD document. The document provides a detailed description of how the system is structured. It also describes how components will interact within the system. The last step is the implementation of the project. This involves developing the project as per the scope defined during the start of the project.
How to use this template
You can use the template by clicking the Use this template option. After the template opens, you can customize the diagram by dragging and dropping new shapes from the libraries present on the left side.
Edit the text. Style the lines, boxes, and text by clicking on the respective elements. You can also save some common aspects in your libraries for future use.
Choose a format to save it for later or share it with others. Click on Export to choose the format of your file (.eddx, .pdf, .png, .jpg) to export the file.
Benefits of the ER diagram
Through this ER diagram, one can get a clear visualization of the various stages involved during a FYP. They can also get a clear understanding of the characteristics of each stage.
Whether you’re a student or a teacher this ER diagram will help you in your understanding of the FYP process. The usage of an ER diagram is also important and comes in handy when trying to map out the steps or tasks to be performed during each stage of an FYP.
This diagram is extremely useful if you’re a final-year student and starting your final-year project. Through this, you will get an overview of the complete FYP process.
FAQs about the ER diagram
-
How do I make ERD for my project?
Following are the steps to make your ER diagram:
- Identify the entities within the system.
- List out the attributes associated with each of the entities and connect them.
- Identify the relationship between the entities and connect the entities using a diamond-like shape.
-
Which tool is used for ERD?
When designing an ER diagram, it’s a lot simpler when you use an online designing tool. Edraw Max is a free-to-use online platform where you can easily design your ER diagram.
-
How do I choose a project topic for computer science?
The best way to start a FYP is to choose a topic of your interest, the present trends, and the opportunities for innovation. Another thing is to seek those areas where your skills and knowledge can be useful. Also, make sure that the topic corresponds to your field of interest.
-
What are the Top 5 hot topics in computer science?
Following are the top 5 topics to consider for your computer science project:
- Big Data Analytics
- Artificial Intelligence
- Machine Learning
- Natural Language Processing
- Internet Of Things
Related templates


Get started with EdrawMax today
Create 210 types of diagrams online for free.
Free Download Free Download Draw a diagram free Draw a diagram free Draw a diagram free