


Flowcharts are the visualization of an algorithm, procedural operation, or sequential event, which outline the major highlights of the process. Multiple software is available in the market, either graphic or markup-based, providing flowchart creation services. The advantage of markup vector drawing applications is that they keep spacing, text, and shapes consistent with the rest of the document, unlike GUI tools, which damage the entire document formatting upon the rescaling or graphic import process.
Given this pursuit, this article explores latex flowchart software, a renowned typesetting document tool, its usage, benefits, and alternative GUI-based solutions for flowchart creation.
Insights into the Latex
Latex is a markup-based software for document preparation, used primarily for creating scientific-based texts. The tool is loaded with myriads of features, including typesetting mathematical formulas, scientific equations, cross-referencing, automatic numbering, glossaries generation, bibliography creation, vector drawings enabling, and more. Additionally, the application is open source, allowing you to transform its code according to your needs.
Latex Graphics Using Tikz
Latex offers different typing, formatting, and drawing-related packages. The drawing-specific packages enable the users to form their vector drawings from scratch using the markup language. Out of those vector drawing packages, Tikz is very popular, working as a general-use resource package. You can create excellent flowcharts using Tikz graphics, not worrying about alignment issues.
How To Create a Latex Flow Chart Using Tikz?
If you are using the Latex software to craft personal or professional-based flowcharts, you need to go through a series of steps performed in an accurate manner. We have provided a comprehensive Tikz flowchart example to illustrate the entire procedure of flowchart creation on Latex Tikz.
Loading the Tikz Package into the Latex Software
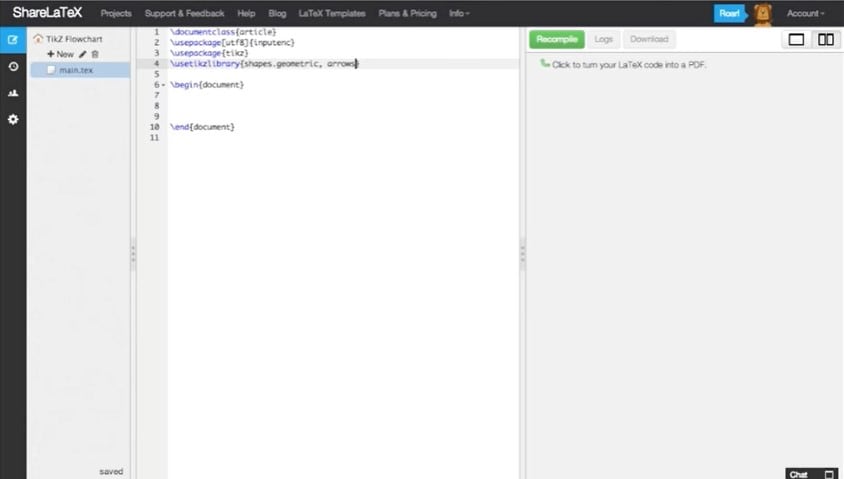
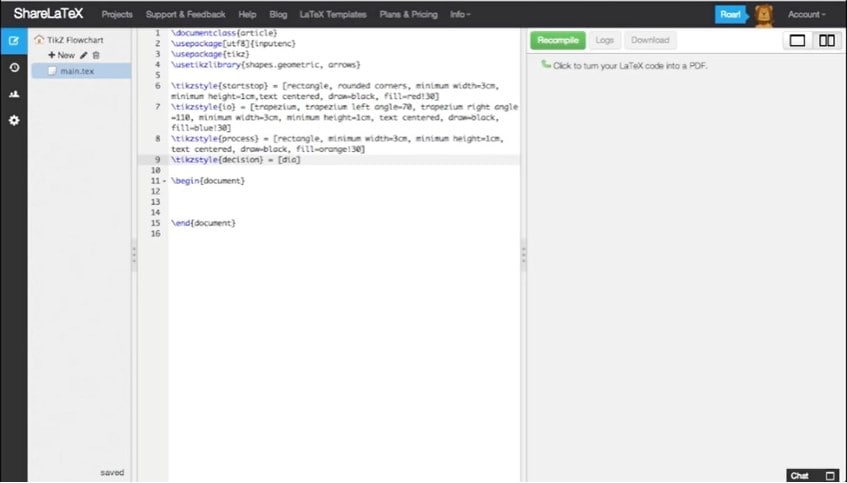
Formulating the flowchart in Latex involves importing the Tikz package into the software to use its shapes and other graphic elements. The foremost thing is to enter a series of tags to enable Tikz and set up the Tikz picture environment using the following code:
    \documentclass{article}
    \usepackage{tikz}
    \usetikzlibrary{shapes, arrows}
    \begin{document}
    \begin{tikzpicture}
    ...
    \end{tikzpicture}
    \end{document}
The Tikz compiler generates the PDF documents by default; however, if you want to generate standalone documents, you can set your preferable format by defining your document class.
Drawing Flowchart Shapes in Tikz Using Tags
Flowchart elements are basically geometrical shapes, which you can draw by entering specific tags; in addition to defining the flowchart figures, it is essential to allocate their variant properties, such as border color, fill color, height, width, corners texture, text alignment, and more. Here is the detailed process for drawing different flowchart shapes along with their markup codes:
How to Draw the Terminator Box?
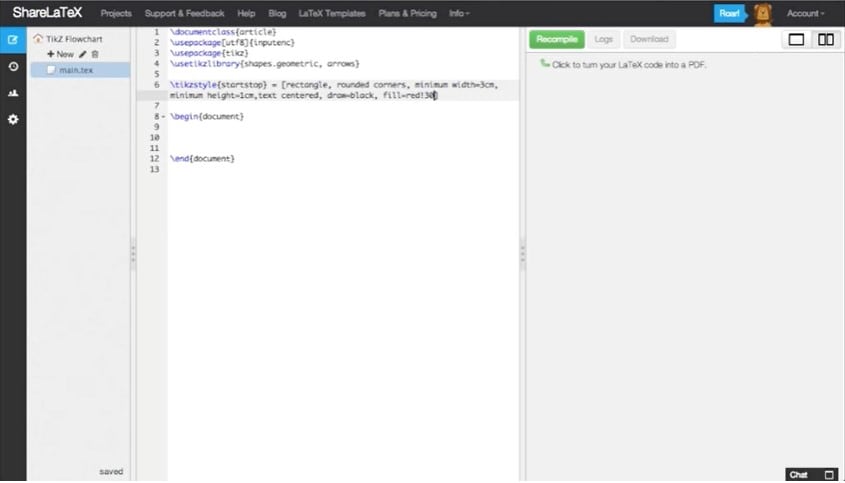
A terminator is used to start or stop the process in a flowchart; to draw the terminator box, input the rectangle box with rounded corners using the following definition command:
\tikzstyle{terminator} = [rectangle, draw, text centered, rounded corners,
    minimum height=2em, minimum width=2em, draw=black, fill=red]
How to Draw the Input Box?
Input box is demonstrated as trapezium in the flowchart, having slightly tilted corners. To draw the trapezium, you must define the trapezium angles as given below:
\tikzstyle{data}=[trapezium, draw, text centered,
    trapezium left angle=60, trapezium right angle=120, minimum height=2em,
    draw=black, fill=blue]
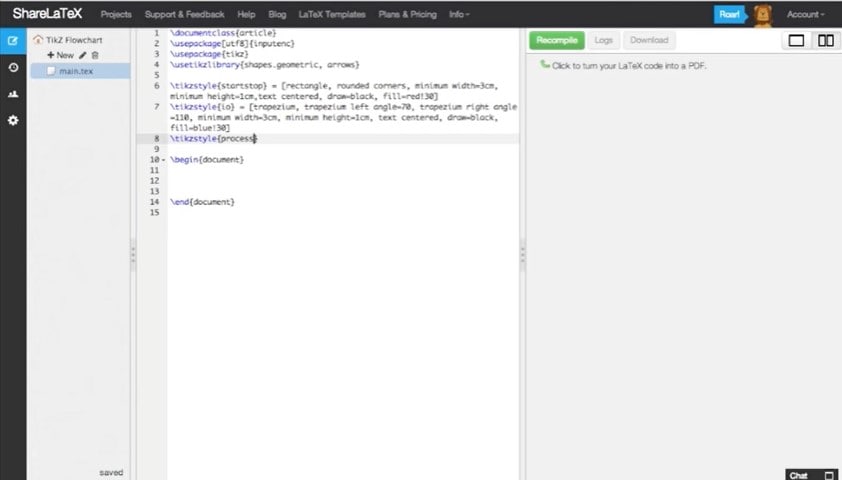
How to Draw the Process Box?
Any process is represented through a rectangle box in flowcharts; type the following code to draw the process box in your flowchart:
\tikzstyle{process} = [rectangle, draw, minimum height=1em,
    minimum width=3dem, text centered, draw=black, fill=orange]
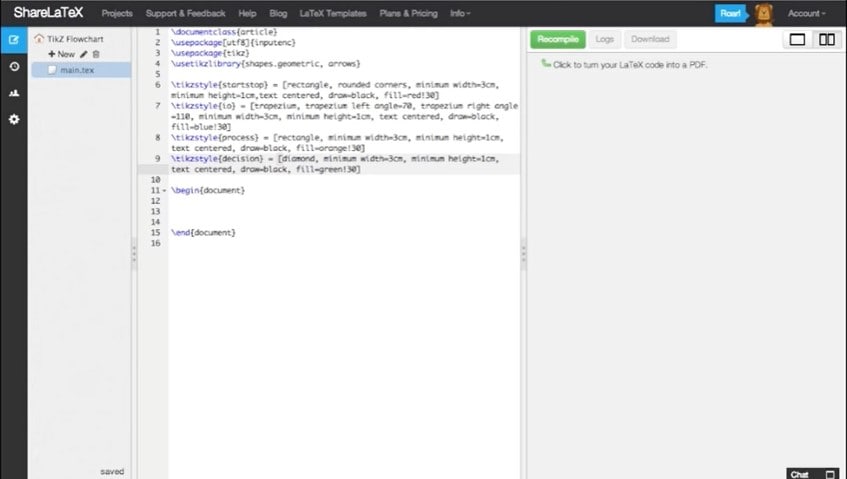
How to Draw the Decision Box?
The decision box represents two or more paths taken based on the proposed condition; the diamond shape is employed to exhibit the decision in a flowchart. Given is how you can draw a decision box in your Latex Tikz flowchart:
\tikzstyle{decision} = [diamond, draw, text centered, minimum height=1em,
    minimum width=3em, draw=black, fill=green]
How to Draw the Connectors?
After drawing all the necessary shapes, the next step is drawing the connectors to attach all the shapes to complete our flow diagram look.
- Step 1: To draw the arrow, use the
/draw
command and specify the geometrical shape as arrows using large brackets, as[arrow]
. - Step 2: When you specify the arrow shape, label the starting point of your arrow to indicate from where it emanates and to which box it projects. For this, you need to use parenthesis to define the arrow's start or end, followed by two consecutive dashes.
- Step 3: Add the box name in parentheses after the dashed, for example, (in1, 2, or more), (pro), (dec), and close the statement with the semicolon. The detailed code statement is presented below:
    \draw [arrow] (start) -- (in1);
    Or
    \draw [arrow] (in1) -- (pro1);
    Or
    \draw [arrow] (pro1) -- (dec1);
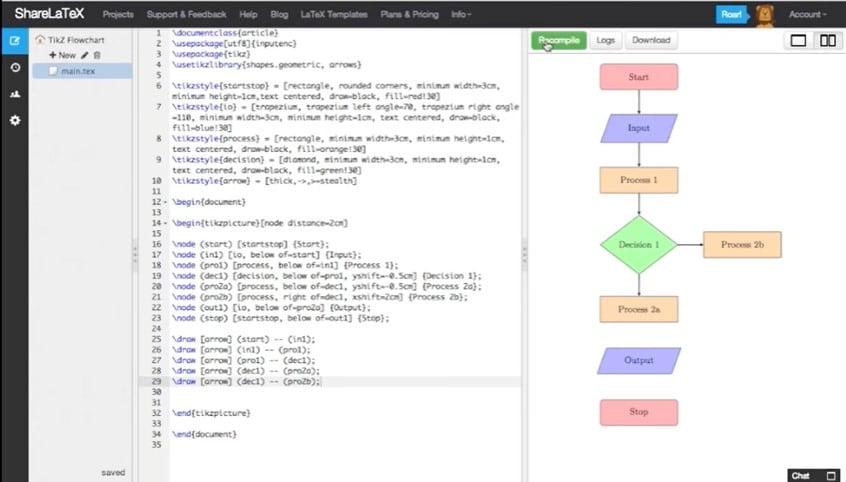
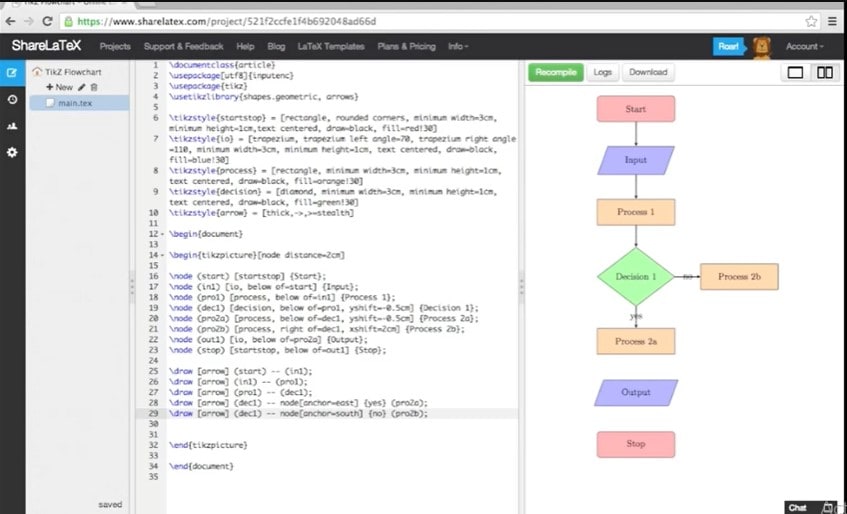
Tikz Complete Flowchart Example
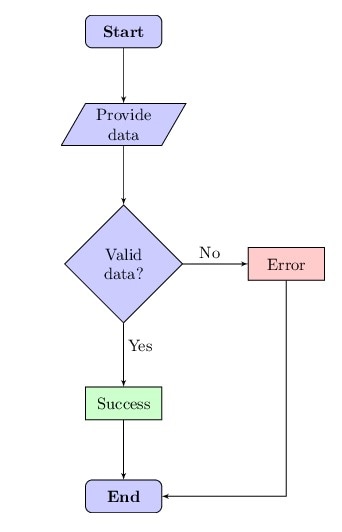
After drawing all the required shapes through markup commands, the next process is compiling the code to execute the output of the entered codes. We have portrayed a sample flowchart along with its complete code to demonstrate a full-fledged flow diagram for your understanding:
    \begin{tikzpicture}
    \node [terminator, fill=blue!20] at (0,0) (start) {\textbf{Start}};
    \node [data, fill=blue!20] at (0,-2) (data) {Provide data};
    \node [decision, fill=blue!20] at (0,-5) (decision) {Valid data?};
    \node [process, fill=red!20] at (3.5,-5) (error) {Error};
    \node [process, fill=green!20] at (0,-8) (success) {Success};
    \node [terminator, fill=blue!20] at (0,-10) (end) {\textbf{End}};
    \node[draw=none] at (1.85, -4.75) (no) {No};
    \node[draw=none] at (0.35, -6.75) (yes) {Yes};
    \path [connector] (start) -- (data);
    \path [connector] (data) -- (decision);
    \path [connector] (decision) -- (error);
    \path [connector] (decision) -- (success);
    \path [connector] (error) |- (end);
    \path [connector] (success) -- (end);
    \end{tikzpicture}
This code generates the below-given flowchart:
EdrawMax- The Best Alternative to Latex
If you find it challenging to create flowcharts using Latex Tikz because of its complex coding procedure, you can employ a user-intuitive platform for making flowcharts. In such a situation, we recommend using EdrawMax, a top-notch free GUI-based tool endowed with state-of-the-art features to facilitate effortless flowchart drawing.
EdrawMax inspires creativity in your diagrams by providing several commendable features, such as a professionally-built templates gallery, built-in symbols library, unending color & layout customization features, cross-platform compatibility, cloud syncing, and various export options. In fact, EdrawMax proves as an ultimate vector diagramming solution for small, mid, and high-level users, paving a route to creativity.
How to Create a Flowchart Using EdrawMax?
Creating the flowcharts via EdrawMax requires no markup language, coding, or tech-related knowledge; rather its drag-and-drop functionality enables you to quickly load shapes without hassle. Additionally, the color or size customization does not necessitate entering markup codes because customization options are accessible through intuitive bars and menus. The detailed procedure for creating your target flowchart is presented below:
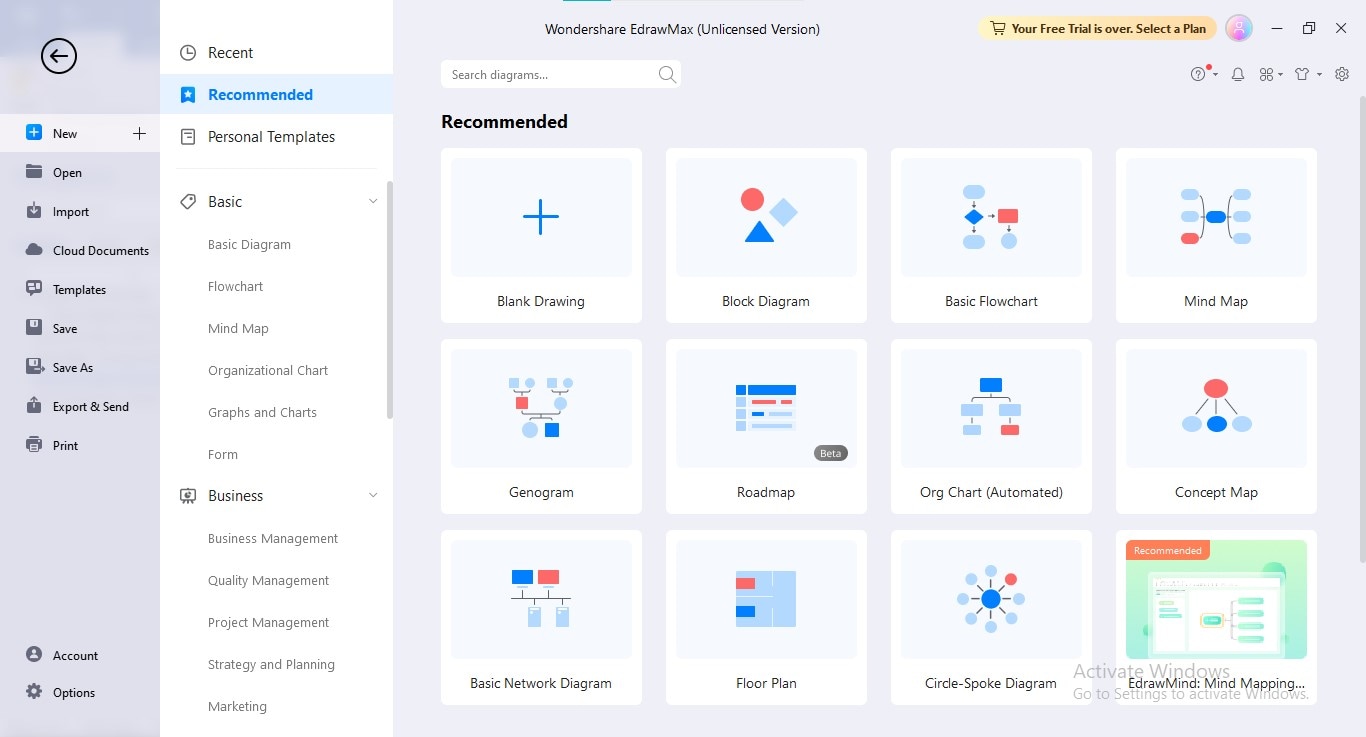
Step1
Download and launch the "EdrawMax" application or Try EdrawMax Online to use it for flowchart creation.
Step2
To initiate your diagramming from scratch, click the "New" option from the left panel and choose the "Basic Flowchart" option from the main interface. If you want to edit a prebuilt template, click the "Templates" option.
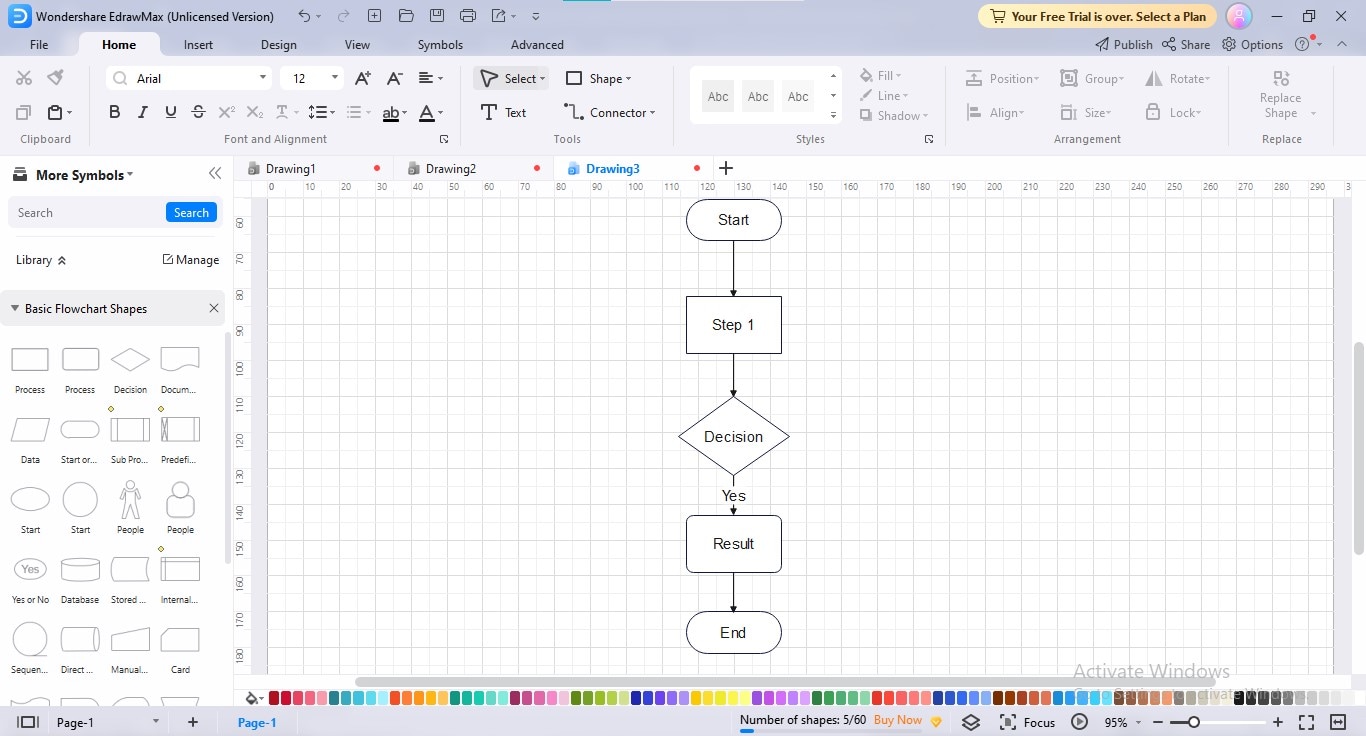
Step3
Add shapes, linking them through connectors, and enter the required information into your flowchart to complete it.
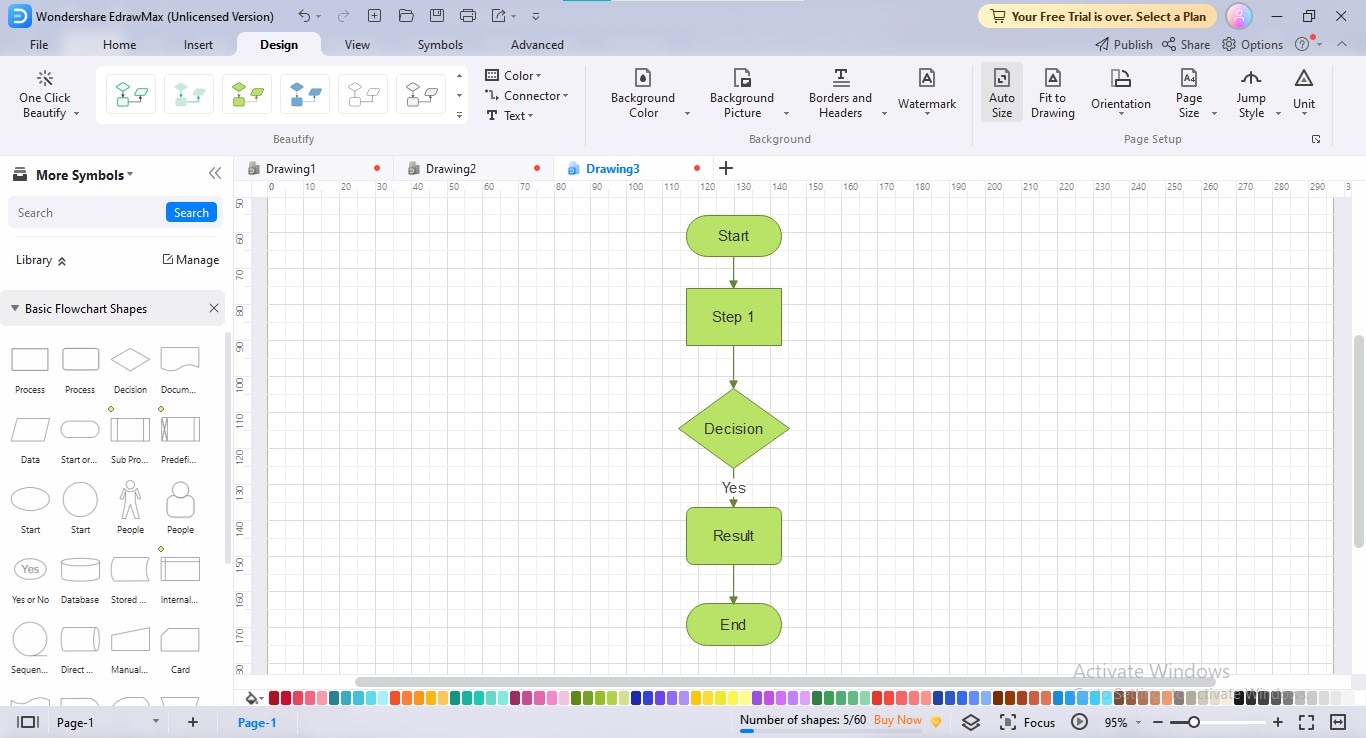
Step4
After establishing the flowchart by adding shapes and text, customize it using your favorite color scheme, theme, diagram layout, and background color.
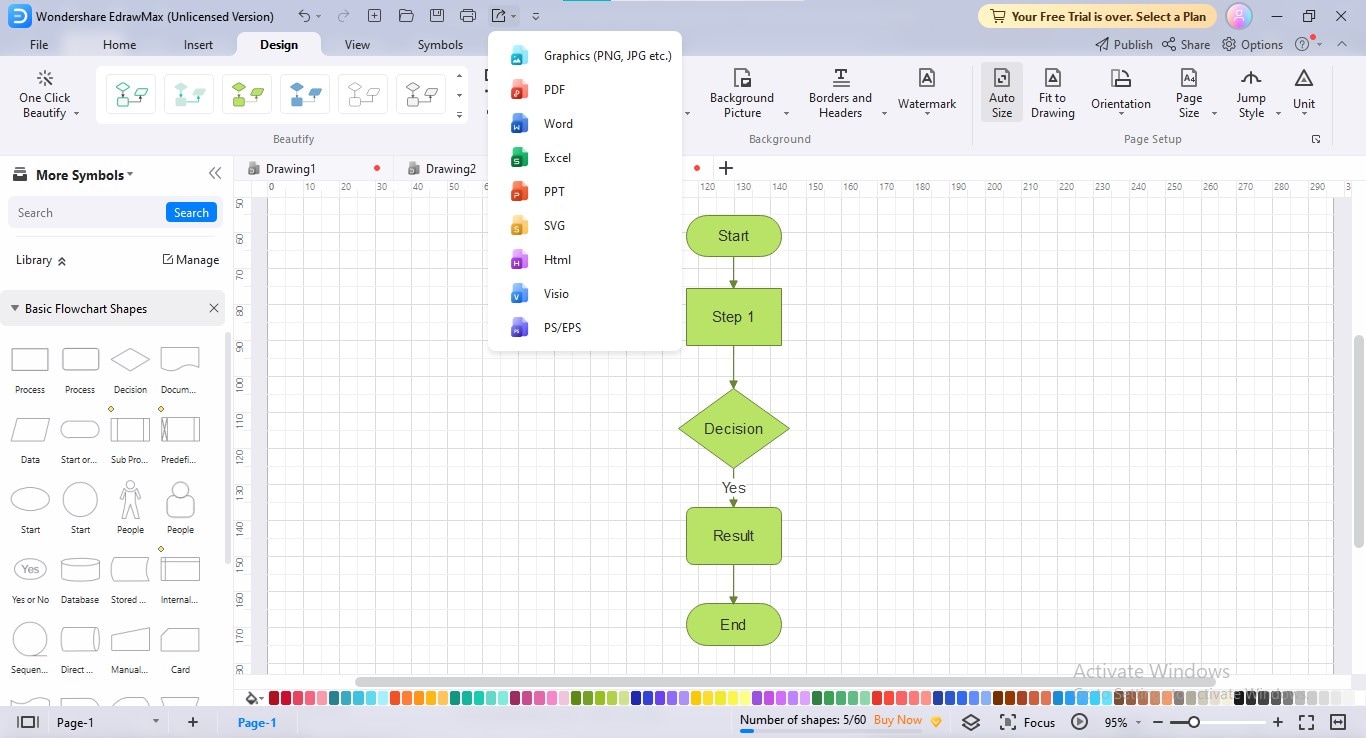
Step5
Click the "Export" button at the top bar to save the flowchart in your desired format.
How Is EdrawMax Better Than Latex for Flowcharts?
If you constitute a flowchart using Latex, you may face certain issues like the inability to remember exact codes, confusing text-based interface, and superfluous time & effort consumption. However, using an alternate solution like EdrawMax can relieve all these troubles, empowering a pain-free flowchart creation process. Using EdrawMax as an ultimate flowcharting platform can bring the following benefits to you:
- The prebuilt template gallery at EdrawMax enables you to avoid the hassle of starting from scratch and misalignment issues.
- The tool is enriched with thousands of symbols pertaining to different flowchart types to glorify your flowcharting experience, whether it's a process flowchart, a workflow, a system, a swimlane, or a document flowchart.
- You can import shapes into your flowchart without typing any command using the drag-and-drop feature.
- The customization of shapes, text, connectors, and background is pretty easy, enabling you to alter the appearance of your flowchart according to your preference.
Conclusion
Various typesetting vector graphics software exist in the market, out of which Latex is the exquisite route. Providing multipurpose features, such as typesetting, scientific document preparation, and vector drawing, Latex also provides a flowchart-making feature through its Tikz package. To create a flowchart in Latex, you first need to activate the Tikz package, introduce the tikzstyle command, then draw your preferred shapes.
We have described the in-depth procedure to draw each flowchart shape in Latex Tikz and connect them using connectors. If you find it formidable to craft flowchart graphics in Latex, you can adopt a more intuitive alternative solution – EdrawMax, for ideal flowchart creation.
AI Diagram Generator
Enter your prompt. Upload files if needed. Generate diagrams, charts, or slides instantly.
