Flowcharts in programming show the visual logic behind algorithms and programs. Many programmers use these diagrams to represent the flow of data, connections, and sequential processes within a program. Programming flowcharts are used widely for software development, automation, and design to sort algorithms, find bugs, solve problems, and more.
However, unlike traditional flowcharts, making them can be a challenge. You must keep everything in check, from using the right shapes to explaining the connections, maintaining loops, and more. Let’s check out some programming flowchart examples to understand them better, so you can replicate one easily.
In this article
12 Programming Flowchart Examples
Wondering how flowcharts in programming work? Here are some programming flowchart examples.
1. Programming Flowchart Example
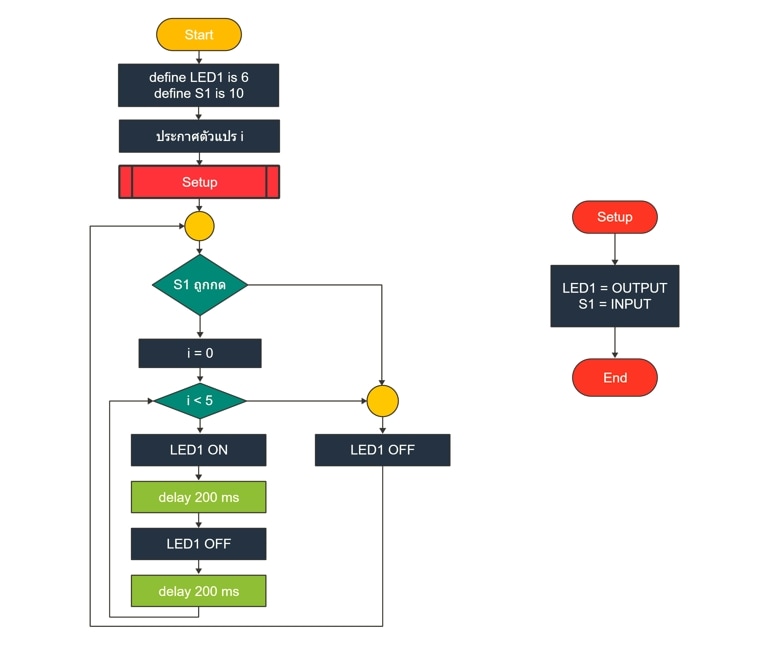
This programming flowchart showcases a typical method for figuring out a program bug before implementing it. Visual aids in this chart, including the color-coded categories and descriptive labels, help developers understand the logical sequence of operations more effectively.
Moreover, the creator has used two parallel paths to check the viability of two inputs for better understanding.
2. Programming Flowchart for Testing an Equilateral Triangle
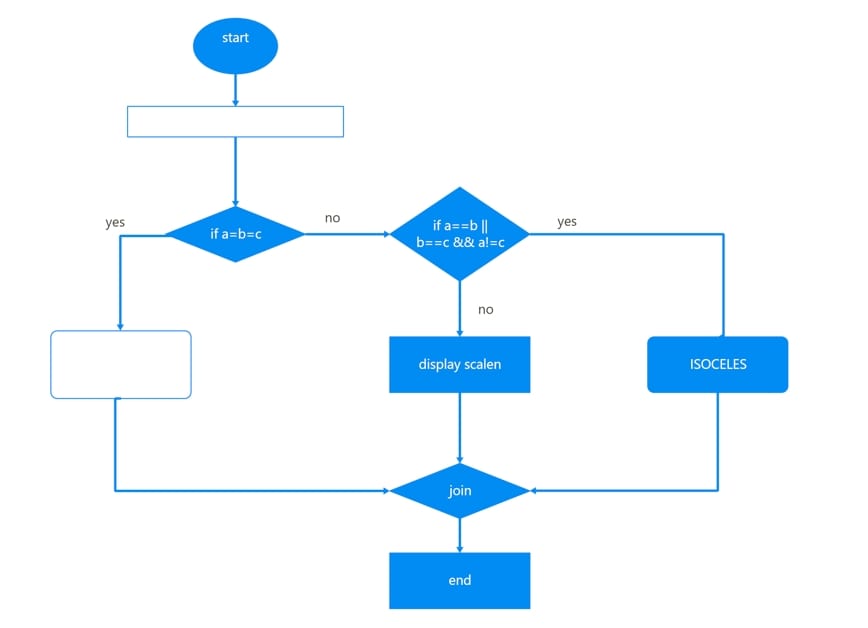
Here is a traditional monochromatic flowchart following a basic conditional operation. It starts by testing whether the triangle is equilateral and then tests the input for all three sides. By the end, it combines all the paths and denies the condition. Despite using a single color throughout, the clearly labeled connectors and shapes strike the audience's attention.
3. Triangle Testing Flowchart in Programming
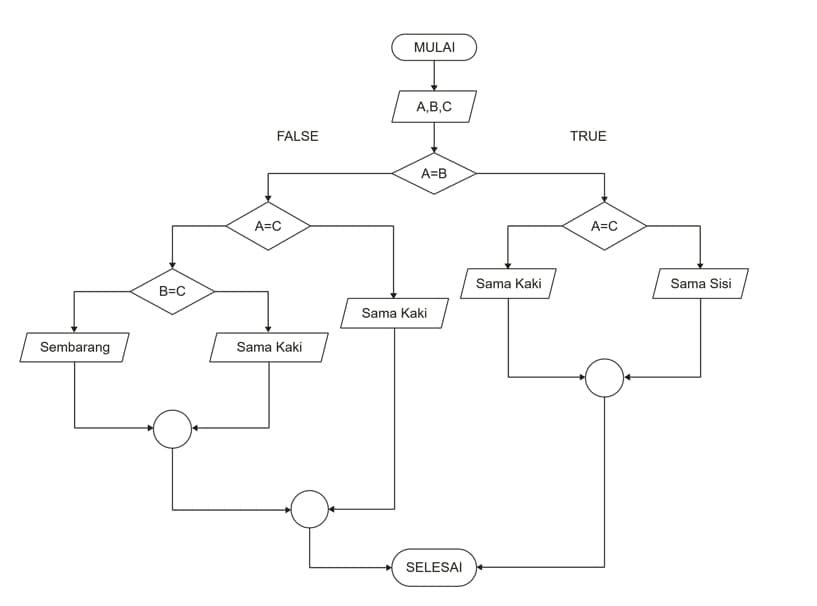
This is a relatively more complex take on a programming flowchart that tests the nature of a triangle from its side lengths. Depending on the outcome of each input, the chart has three endpoints before reaching the result. You can improve this flow by color-coding the categories.
4. Fibonacci Sequence Programming Flowchart
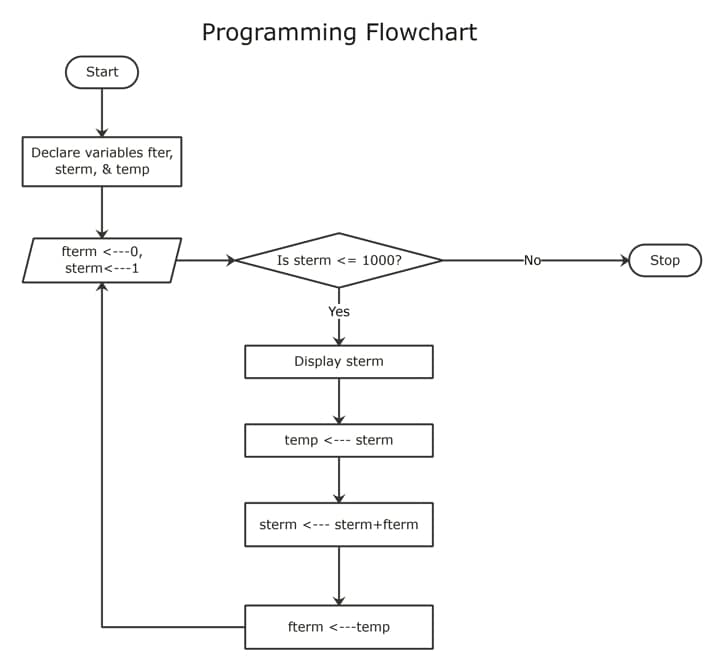
This programming flowchart follows the Fibonacci sequence by testing three variables. It showcases a basic single-tier structure, making it easy to execute for developers.
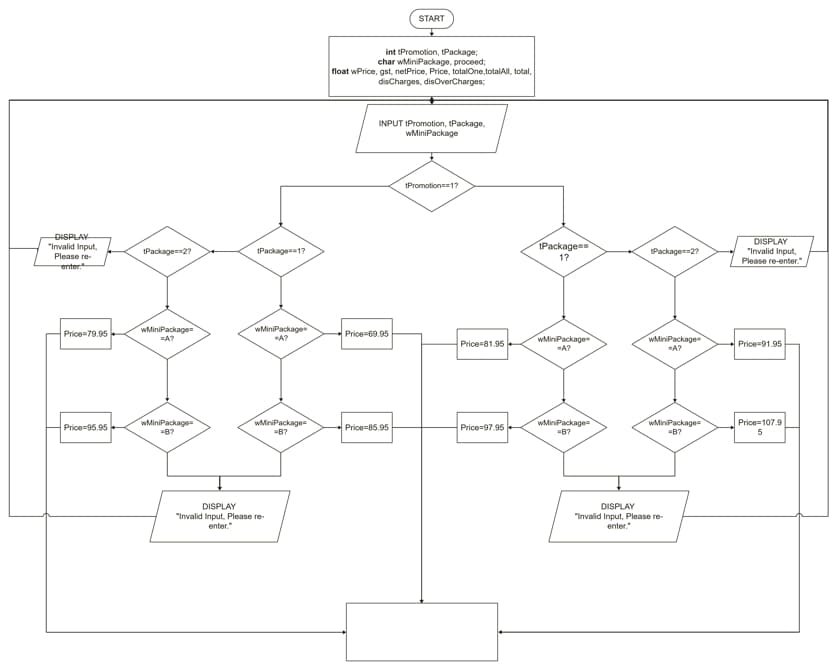
5. Promotional Prices Programming Flowchart
Here is a flowchart example showcasing the price of an item after applying different types of promotion. It might seem a bit complex at first, but the logical and organized flow of the sequence makes it easily understandable. However, adding visual cues like labelled connectors and colors might help communicate the program better.
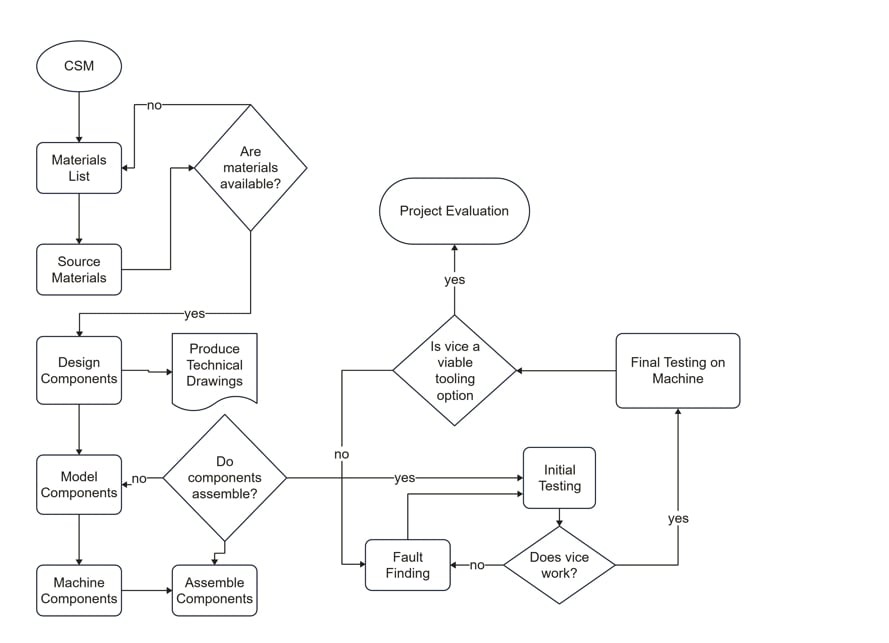
6. Programming Flowchart Machine System
Here is yet another programming flowchart showcasing how individual tasks are completed in a machine system. The flow follows a structured approach to plot interconnected paths for material listings, production, assembly, and project evaluation. An example like this is an excellent way to communicate the process logic to designers and developers.
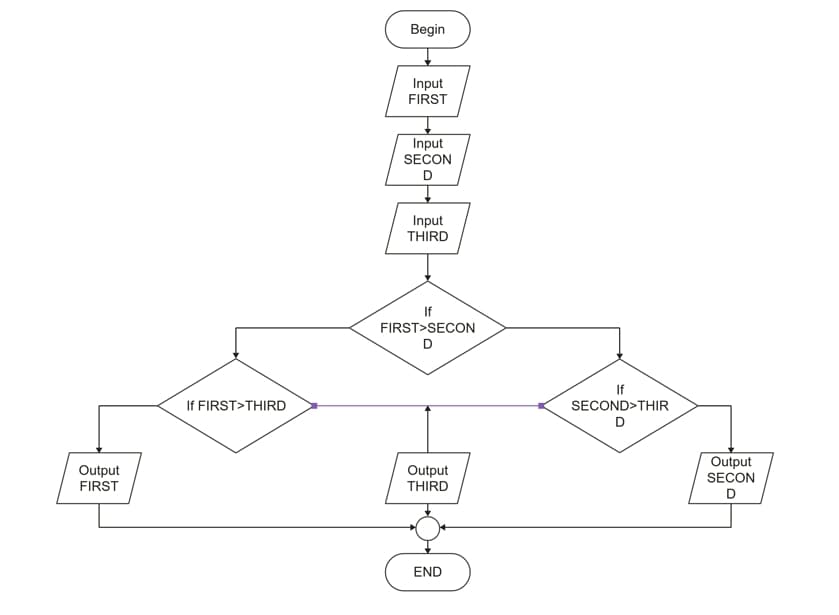
7. Basic Programming Flowchart
This diagram clearly illustrates a basic programming flowchart, representing the completion of tasks using standard symbols and shapes. It starts by testing the first input, the second, and the third, and then evaluates them further. Students can use this flowchart to understand and visualize the logic.
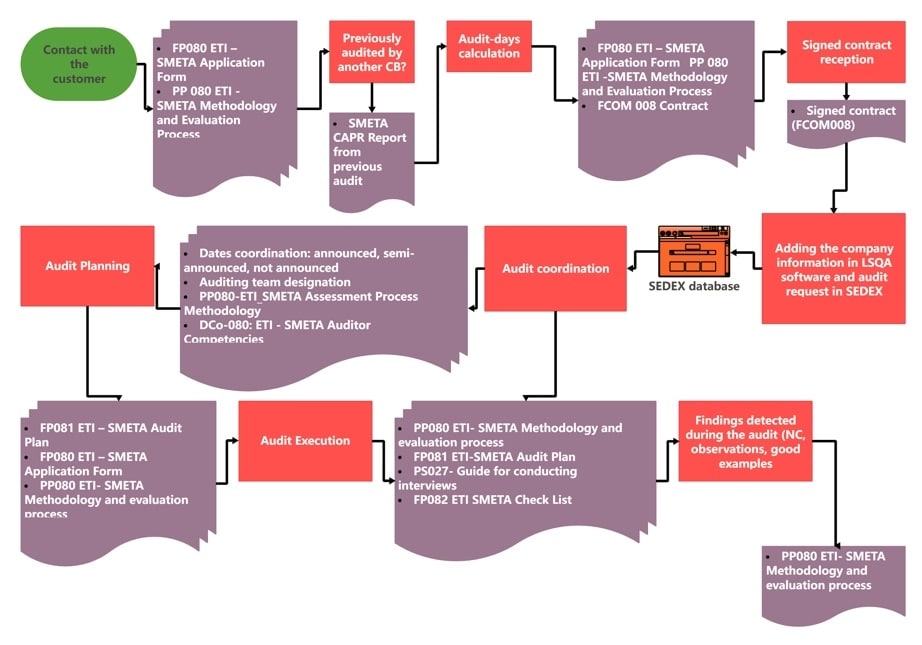
8. Program Flowchart for Audit Planning
An audit flowchart in programming represents the steps required to finalize the audit. It goes through sequences from customer interaction to audit planning, coordination, and post-audit steps. Moreover, this chart uses color coding and a top-down hierarchical structure to compensate for the complex flow.
9. Programming flowchart for Student Attendance Report
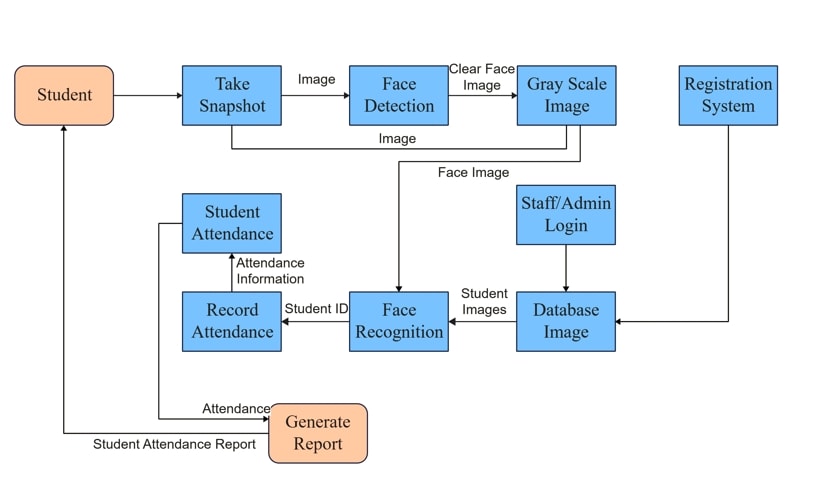
This programming flowchart showcases the tasks completed during a student attendance report. The process starts with the students taking a snapshot, proceeding to face recognition, and posting it to the database. The flow ends by generating the attendance report. Here, the creator has used the two-color theory and labeled connectors to facilitate communication.
10. Programming Flowchart Dashboard
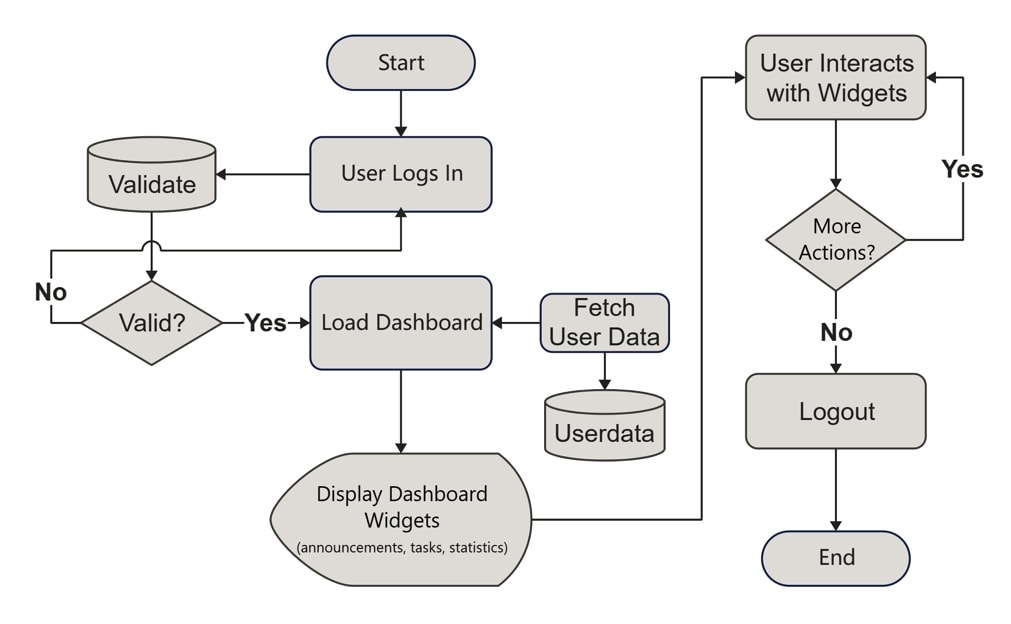
This programming flowchart outlines the user interaction for a dashboard system, depicting user login and validation. It uses widgets, key phrases, and statistics to indicate actions and decisions in the process.
11. Algorithm Programming Flowchart
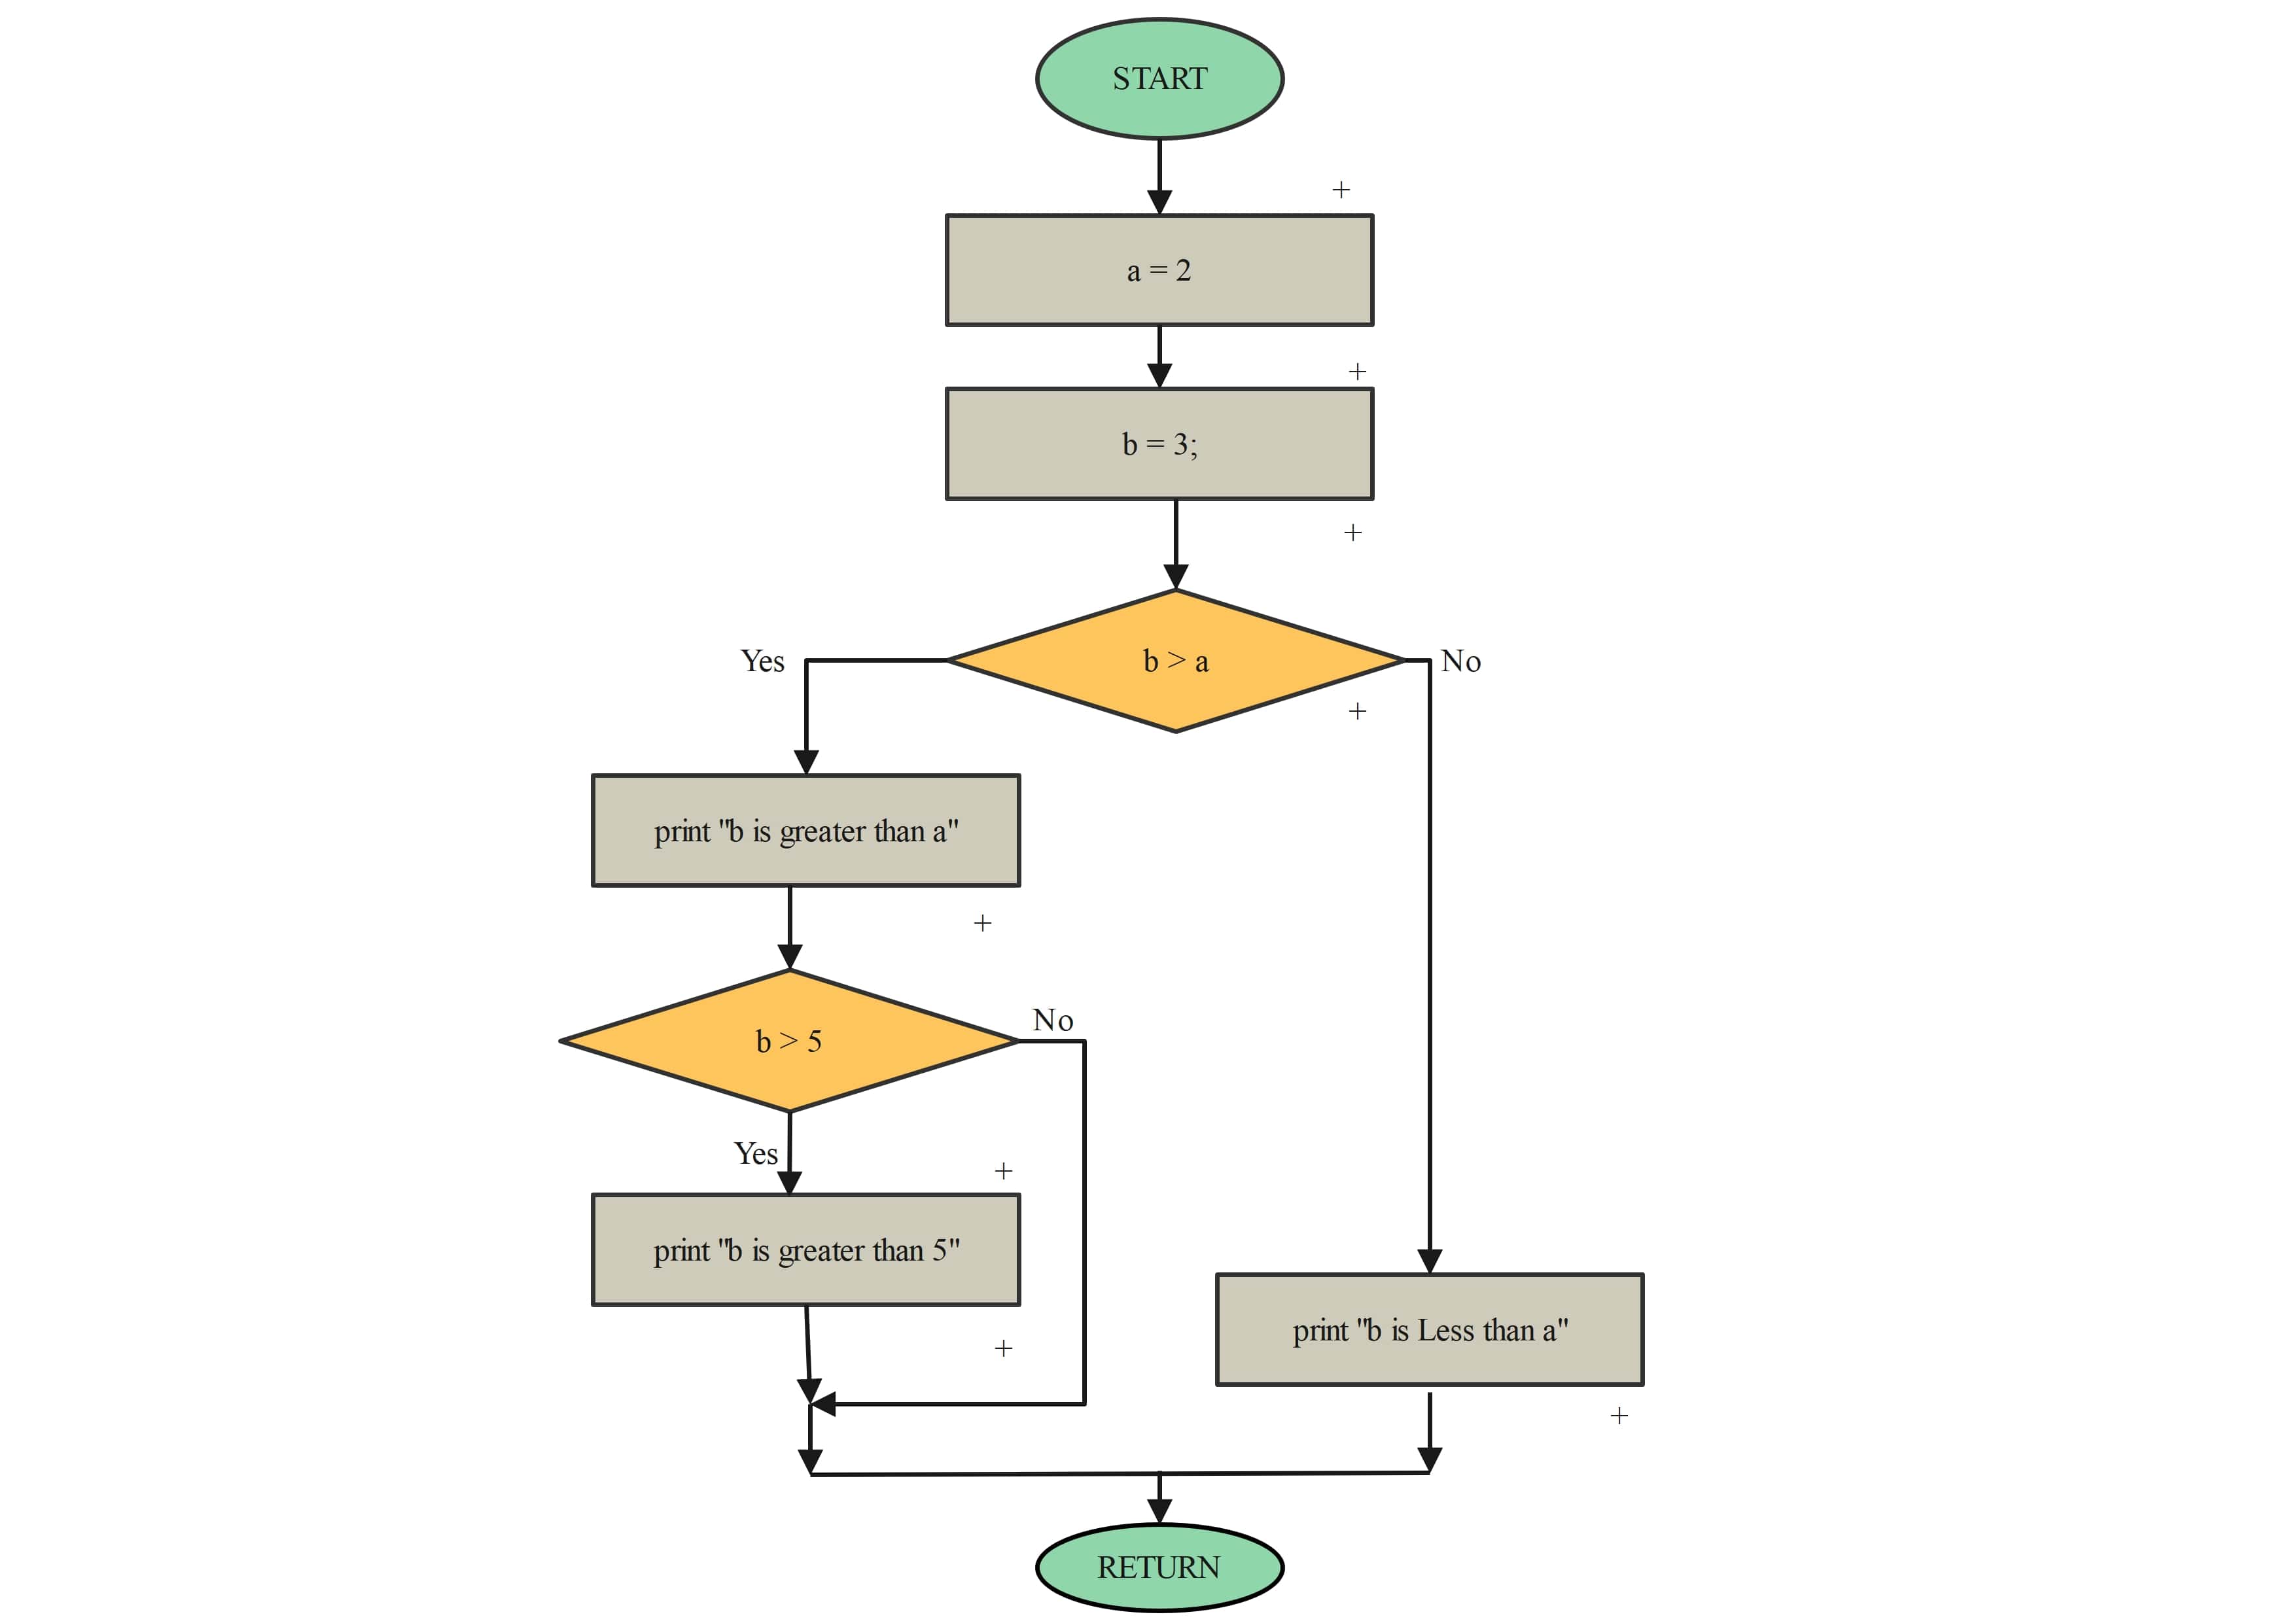
This algorithm flowchart attempts to find the significant number among two, A and B. It follows a simpler single-tier approach to plot the logic sequence. Additionally, colors to differentiate categories and a consistent flow of connectors make it easy to visualize the process.
12. Programming Flowchart for Algorithm Testing
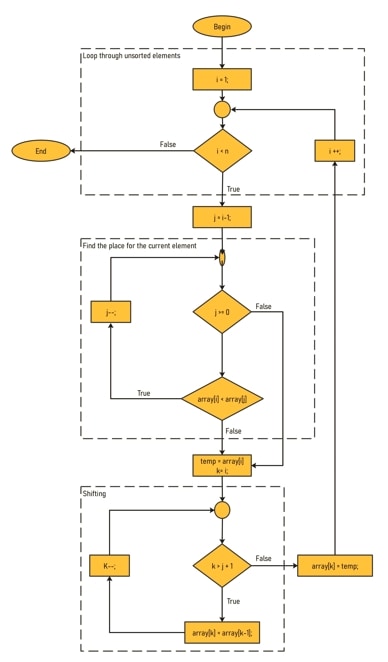
Here is a complex approach to understanding algorithm flows in programming. It divides the sequential flow into different loops, each dedicated to testing inputs. Plotting these flowcharts can be challenging, so you must focus extra on the logical steps and color coding.
Explore similar programming flowcharts from the EdrawMax template community.
How to Make a Programming Flowchart in EdrawMax?
EdrawMax is an all-in-one flowchart maker with AI capabilities and an advanced drawing kit. Its massive template community and industry-standard symbol collection help you practice creating flowcharts and master them. Let’s see how you can use it to your benefit.
Method 1: Start with a Template
Templates are an excellent way for beginners to practice their flowchart sequences. EdrawMax makes it possible with an extensive collection of programming flowcharts. Here is how you can use them to master the flow of sequences.
Start by installing the EdrawMax web or just go to EdrawMax web and log in to your Wondershare ID. You can also access the software with a Google account.
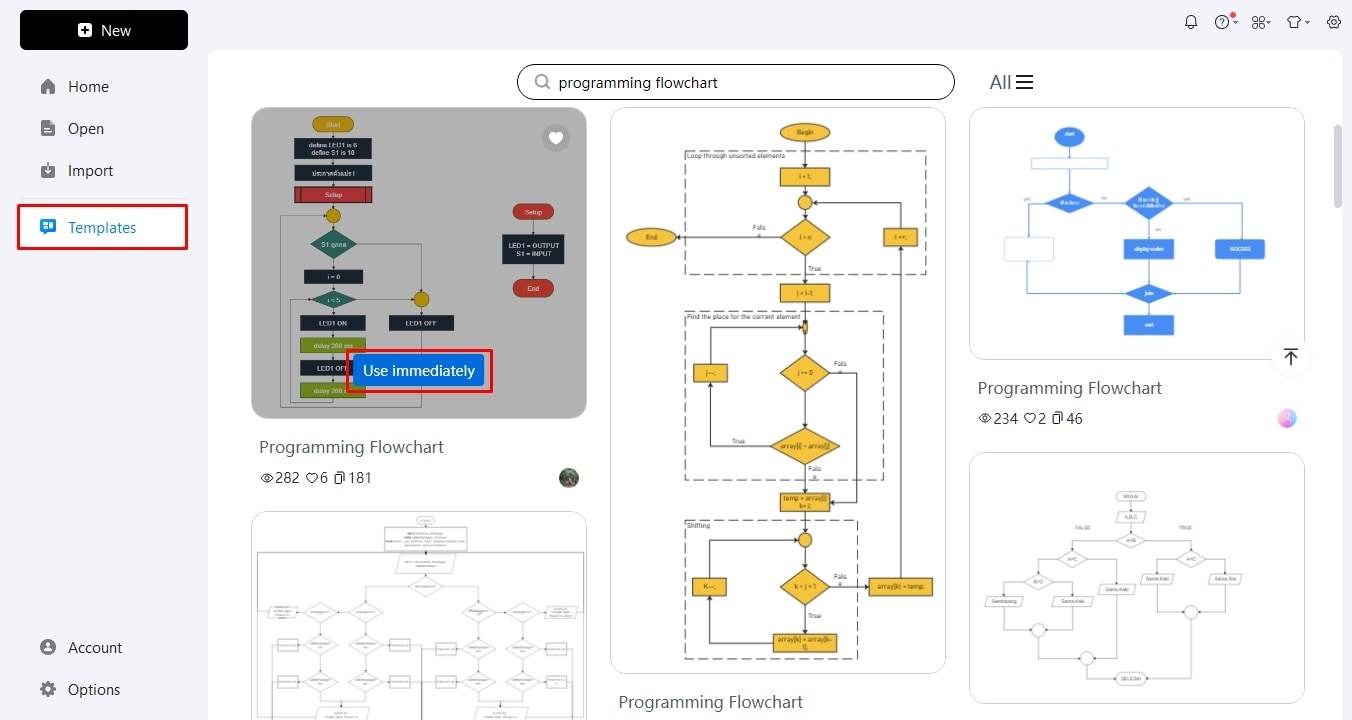
Now, visit the Templates section from the dashboard and type Programming Flowcharts. From the list, find one and click Use Immediately.
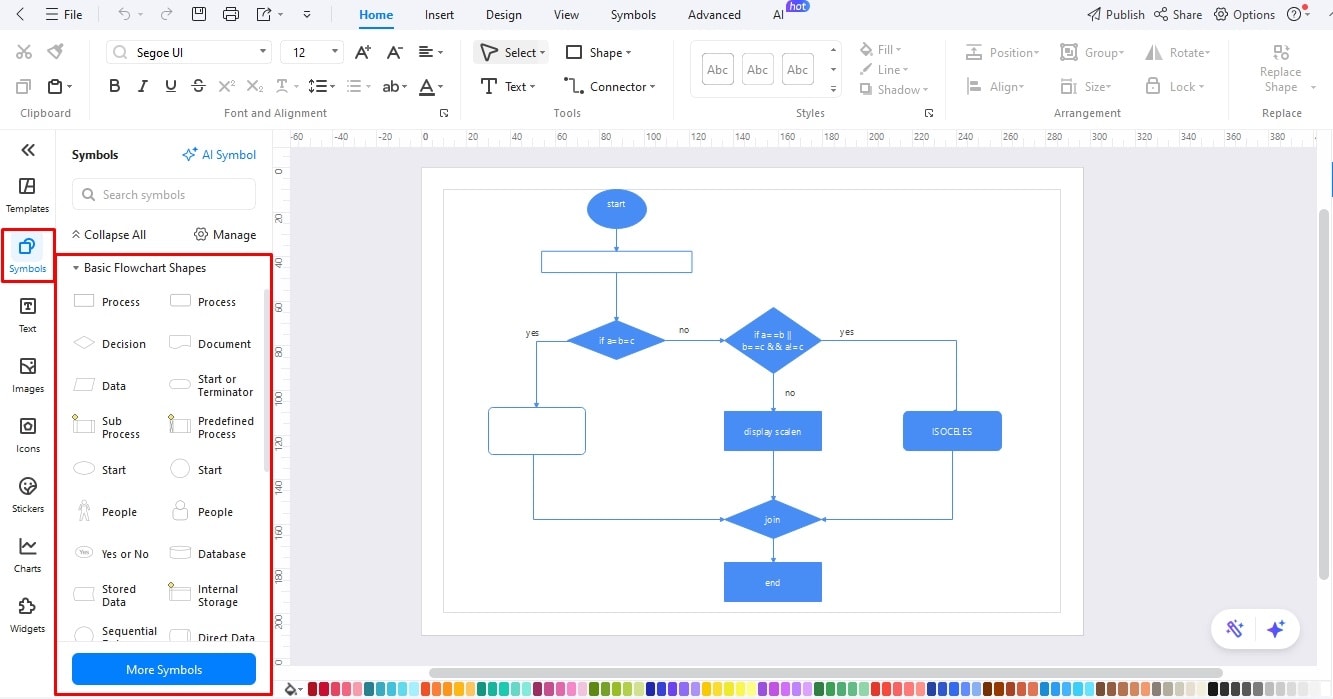
Once on the editing panel, access Symbols from the left side and readjust the shapes. Resize them accordingly.
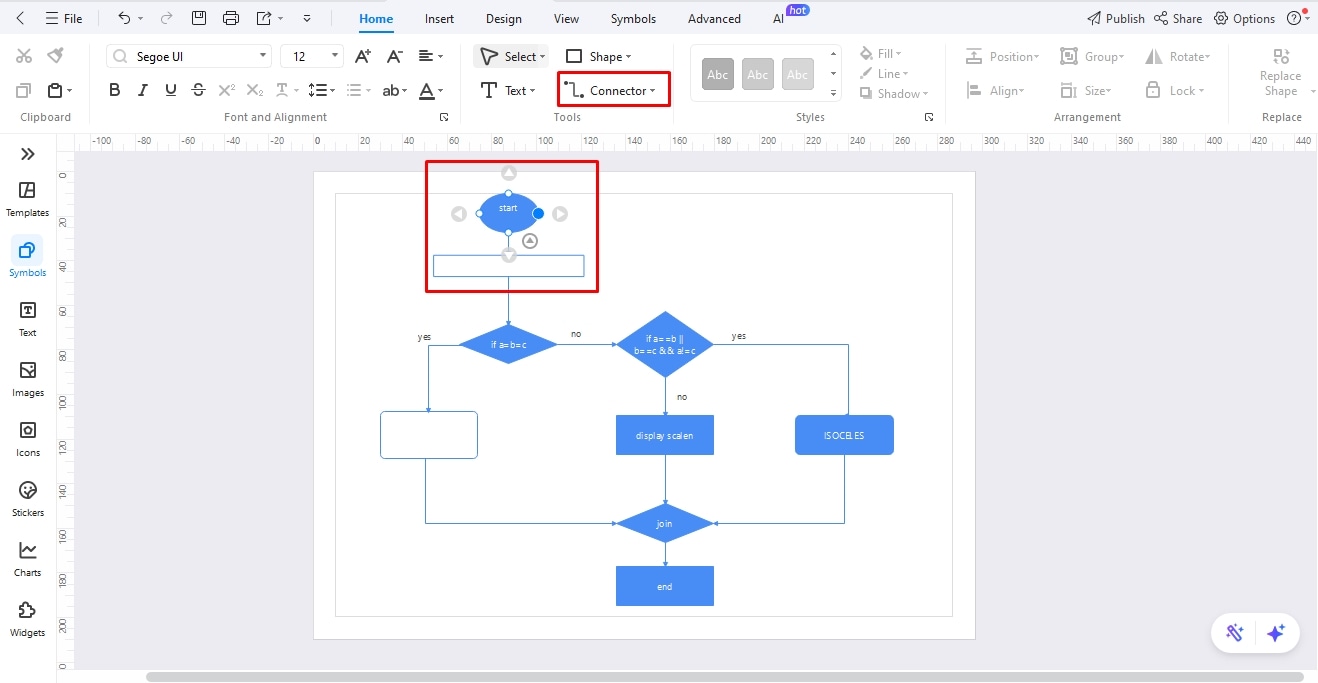
Use the connection points with each shape to link steps. Keep the connections consistent throughout.
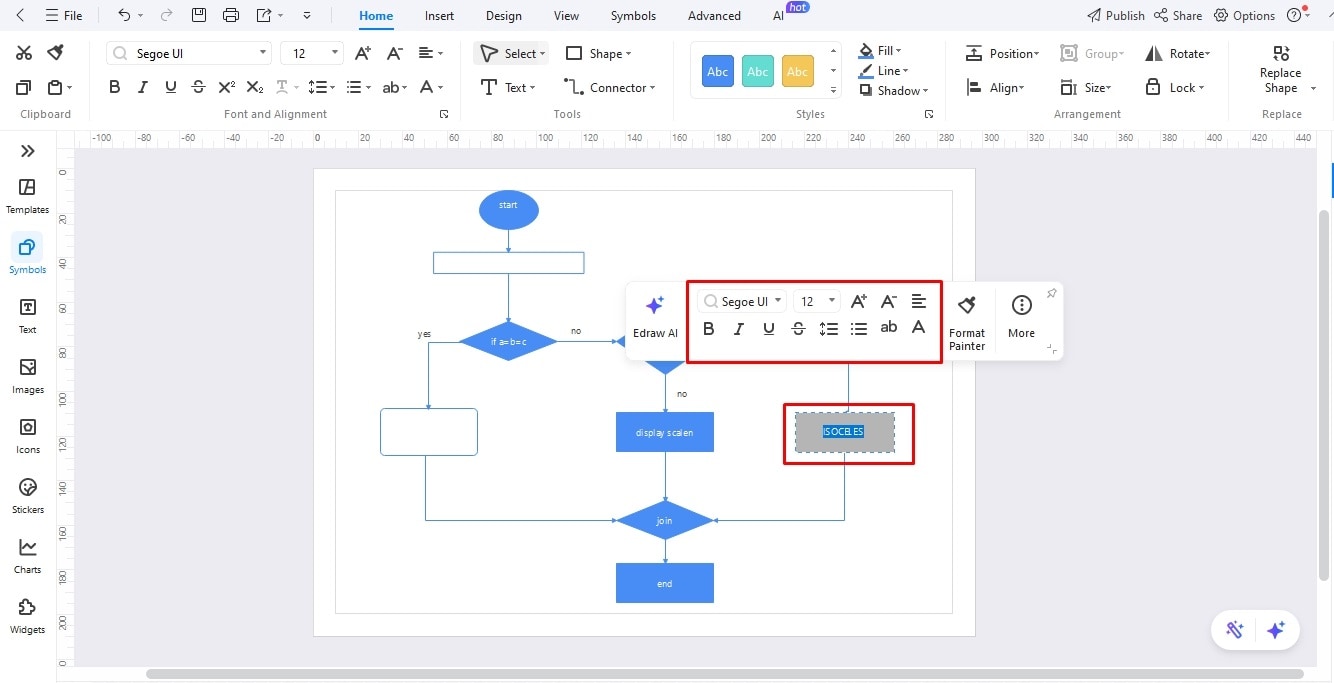
It’s time to add labels. Double-click anywhere on the canvas to type text. Be concise while labeling and change font details from the on-screen prompt.
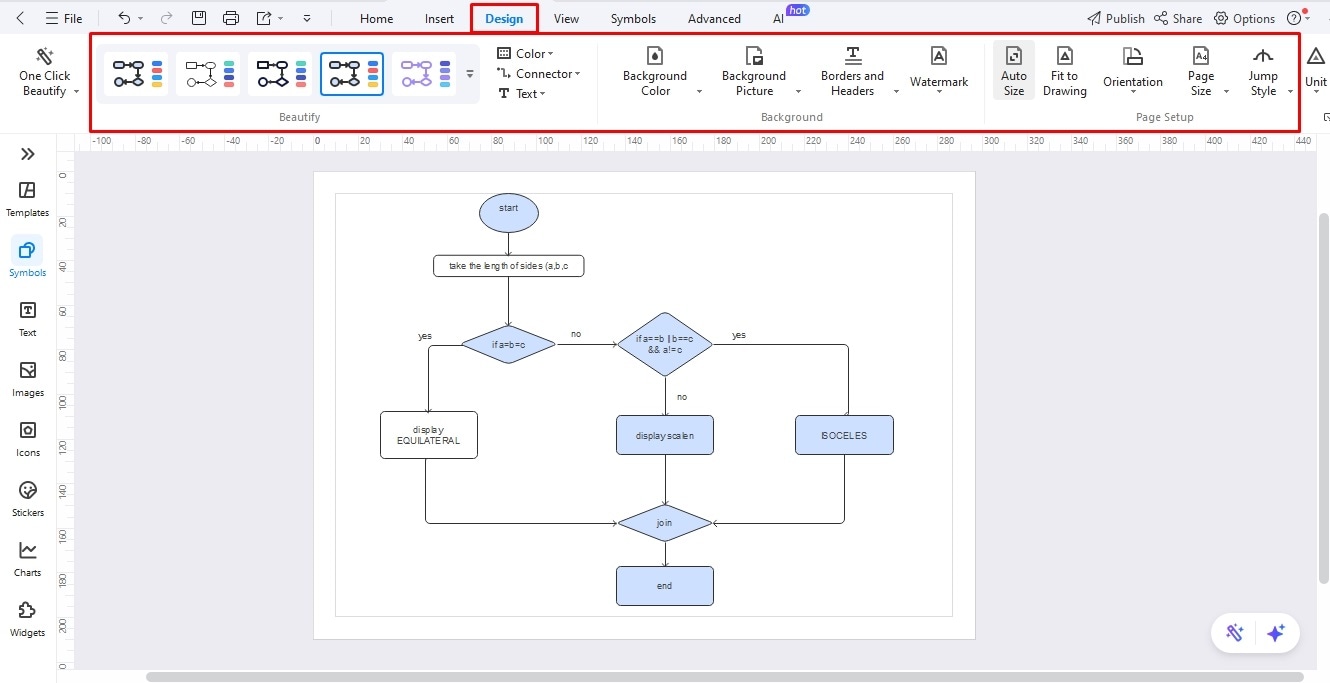
Once sure about everything, add visual cues to help the readability. Color-code categories from the Design tab at the top, and you are done.
Method 2: Practice Flowcharts from Scratch
Once confident about the structure, attempt to make a program flowchart from scratch. Follow these simple steps.
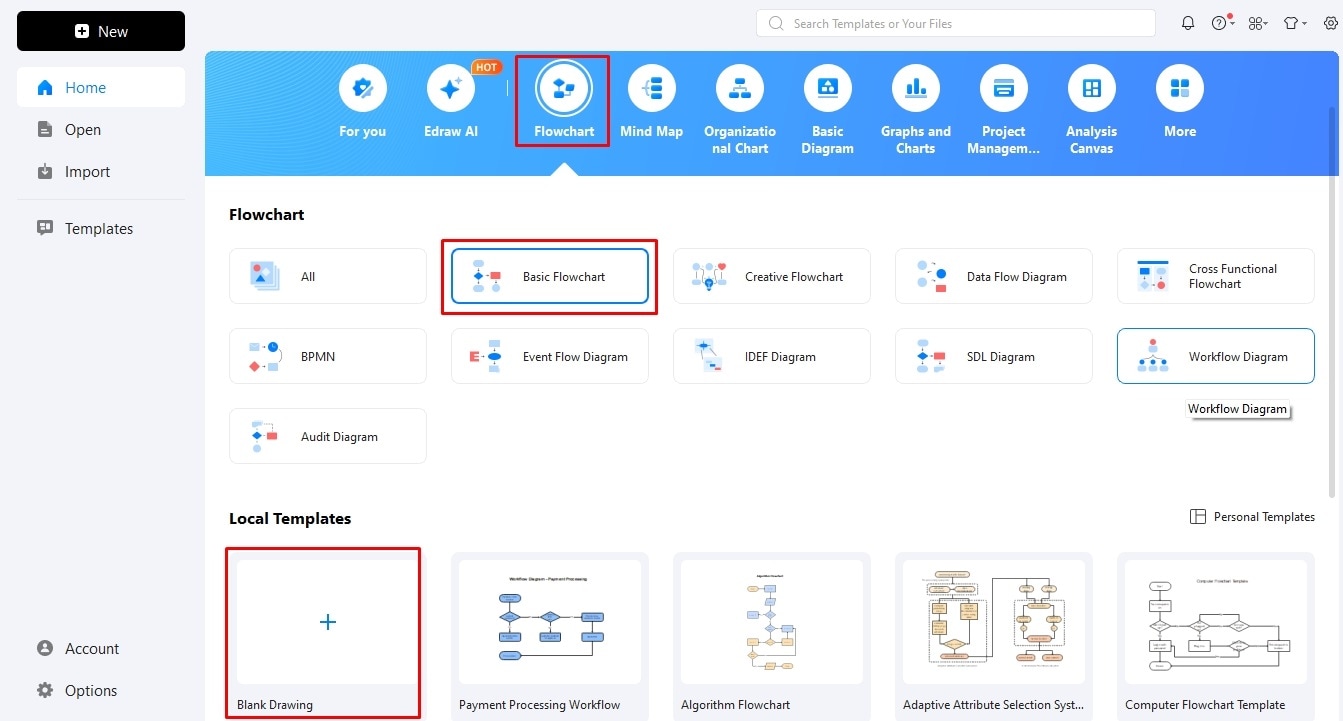
Click Flowchart > Basic Flowchart > Blank Drawing from the dashboard to open the editing panel.
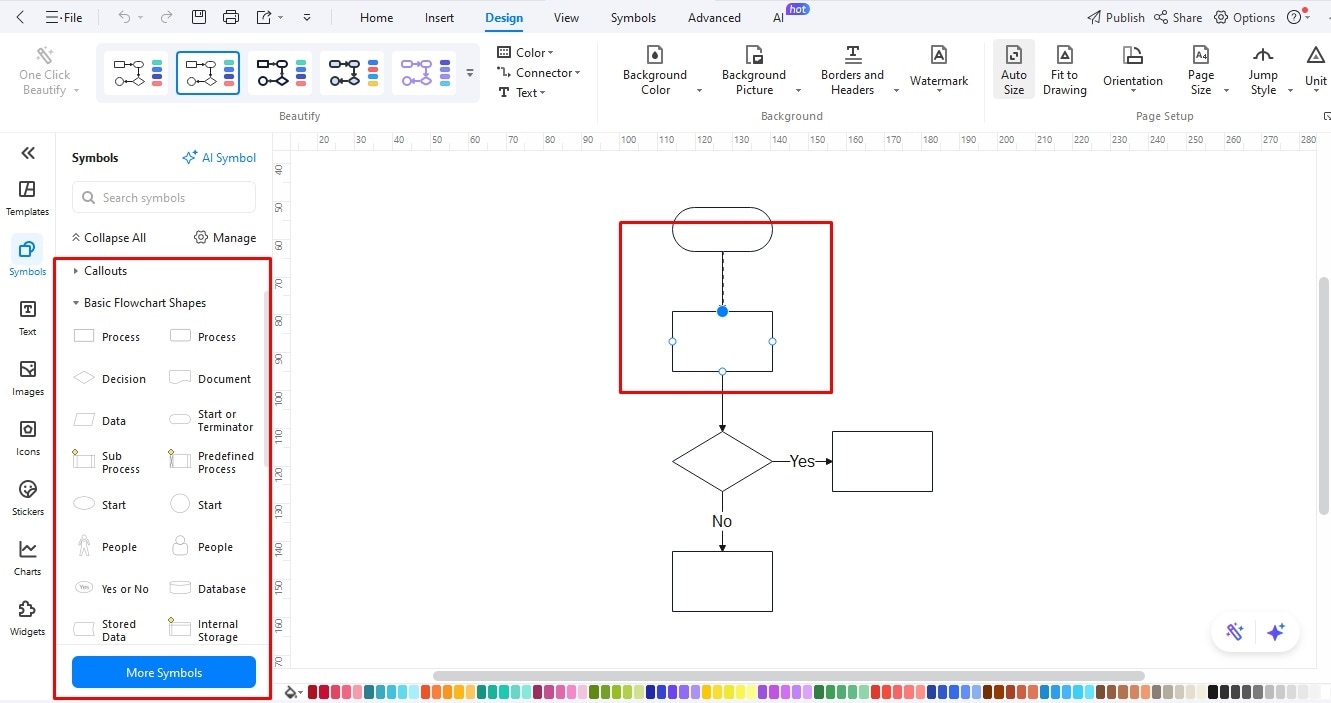
Drag and drop symbols from the left-side library and connect them to build a structure.
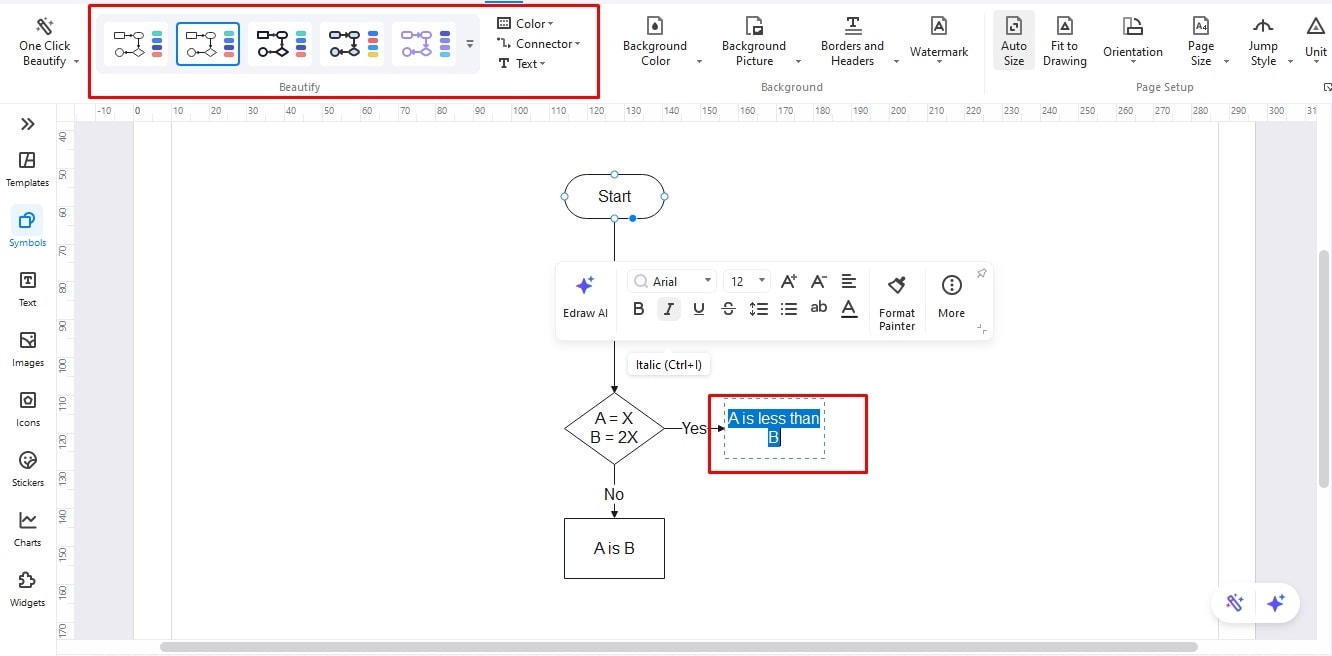
Add text labels and change the colors of individual boxes. Congratulations, you’ve successfully plotted a flowchart.
Apply Animations
Animations are an excellent way to bring movement to your flows and achieve clarity, so developers and designers are better equipped to understand the logic. Here is how you can apply animations to your static flowcharts.
Choose any connector from your flowchart and click Flowchart Animations. Adjust the flow direction, speed, color, and style of the step. You can also set a trigger for the animation from this menu.
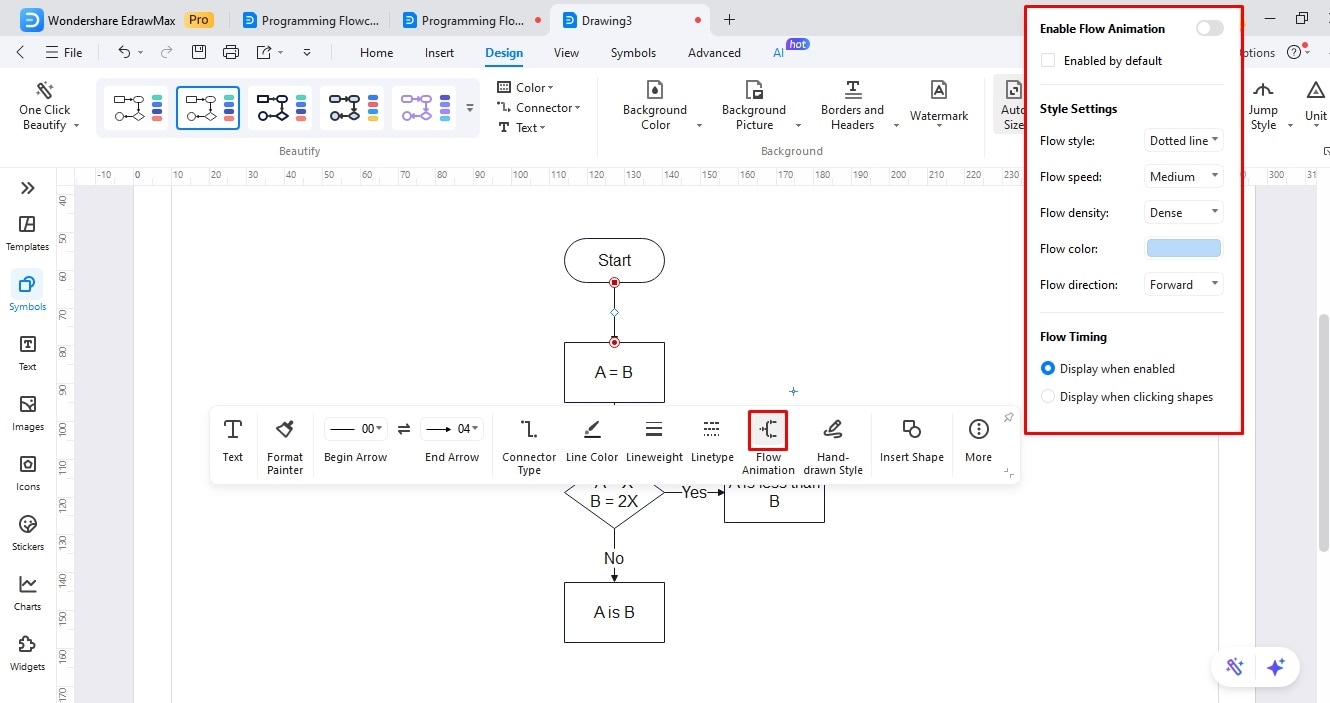
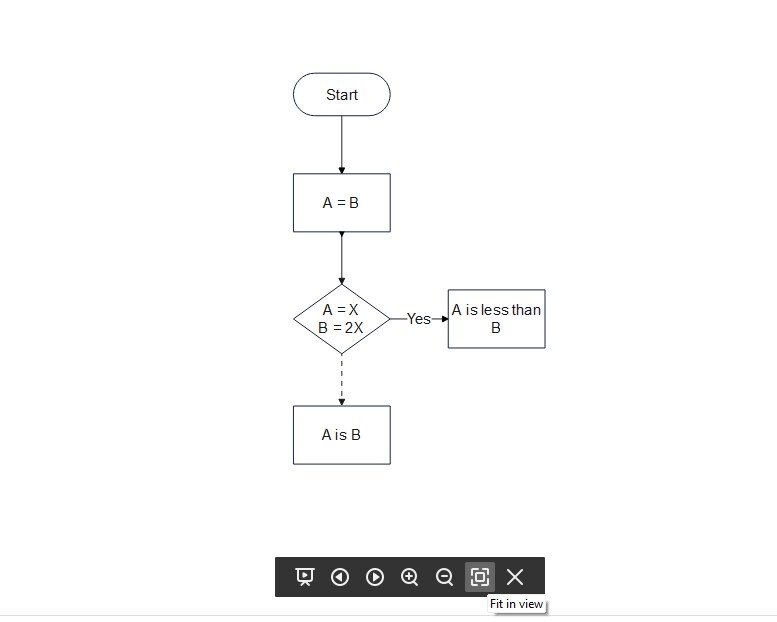
Do this for all required steps. Once done, press F5 to enter the Preview Mode and analyze the animations.
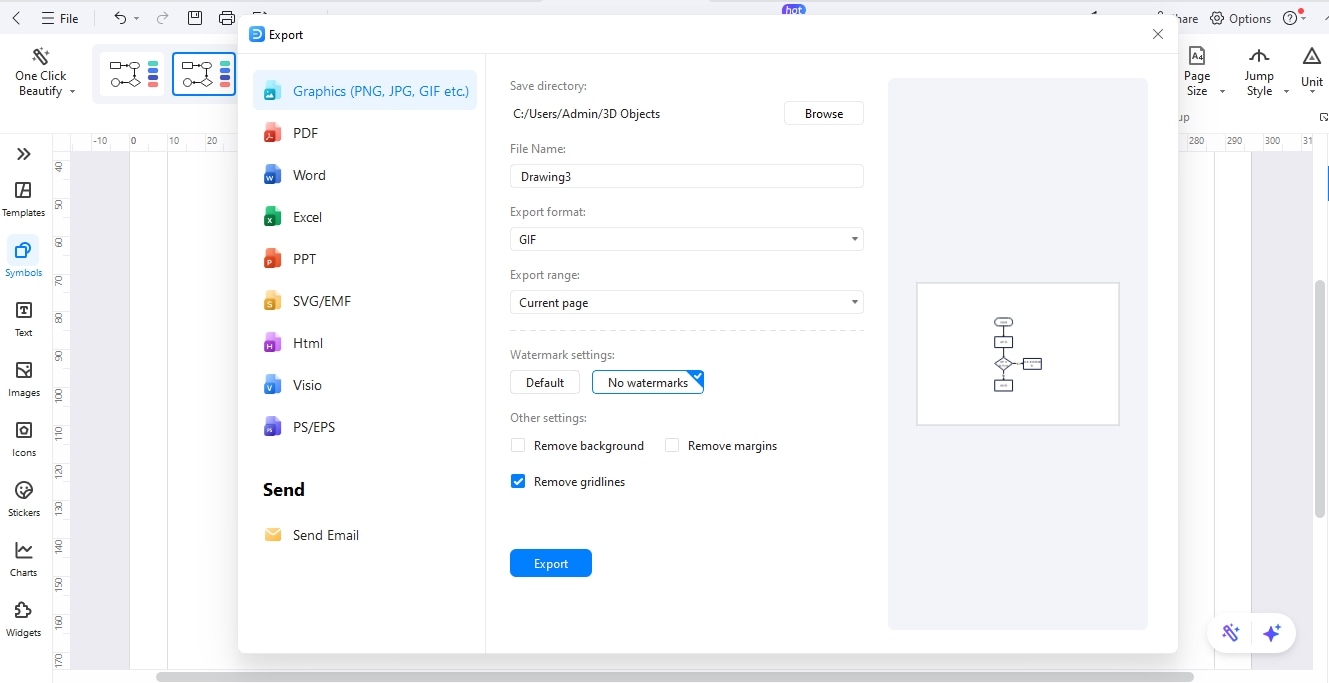
Finally, click the Export icon from the quick-access toolbar and download your flowchart in a GIF format.
Programming Flowchart Best Practices
Flowcharts in programming are all about building a logical sequence in a program while maintaining clarity. Here are a few tips to help you plot functional flowcharts that attract your audience's attention.
- Keep your flowcharts simple. Do not add overwhelming text and shapes, as they can only confuse the viewer. Even if the process has two or more subdivisions, try creating a separate path for each.
- Be consistent in using symbols throughout. What’s better is that you stick to universally recognized shapes (for instance, diamonds for decisions, circles for ends, etc.).
- Make sure your flow follows a logical sequence of steps. Use arrows consistently to guide the viewer through the steps.
- Use colors strategically. Allocate different colors to differentiate actions and decisions. However, do not overuse them, as they can divert your viewer’s attention.
- Always get feedback. Share your flowcharts with designers and developers to get a second opinion. Address inefficiencies and update your processes regularly.
Final Thoughts
Mastering programming flowcharts is a serious business. It requires a solid understanding of the structure and a lot of practice. Fortunately, tools like EdrawMax provide extensive resources so you can try again and again until perfection. Its vast canvas space, resizable symbols, and editable templates are a great way to start.
Give it a shot and see how it works for you.


