About this Network Diagram for Client Server template
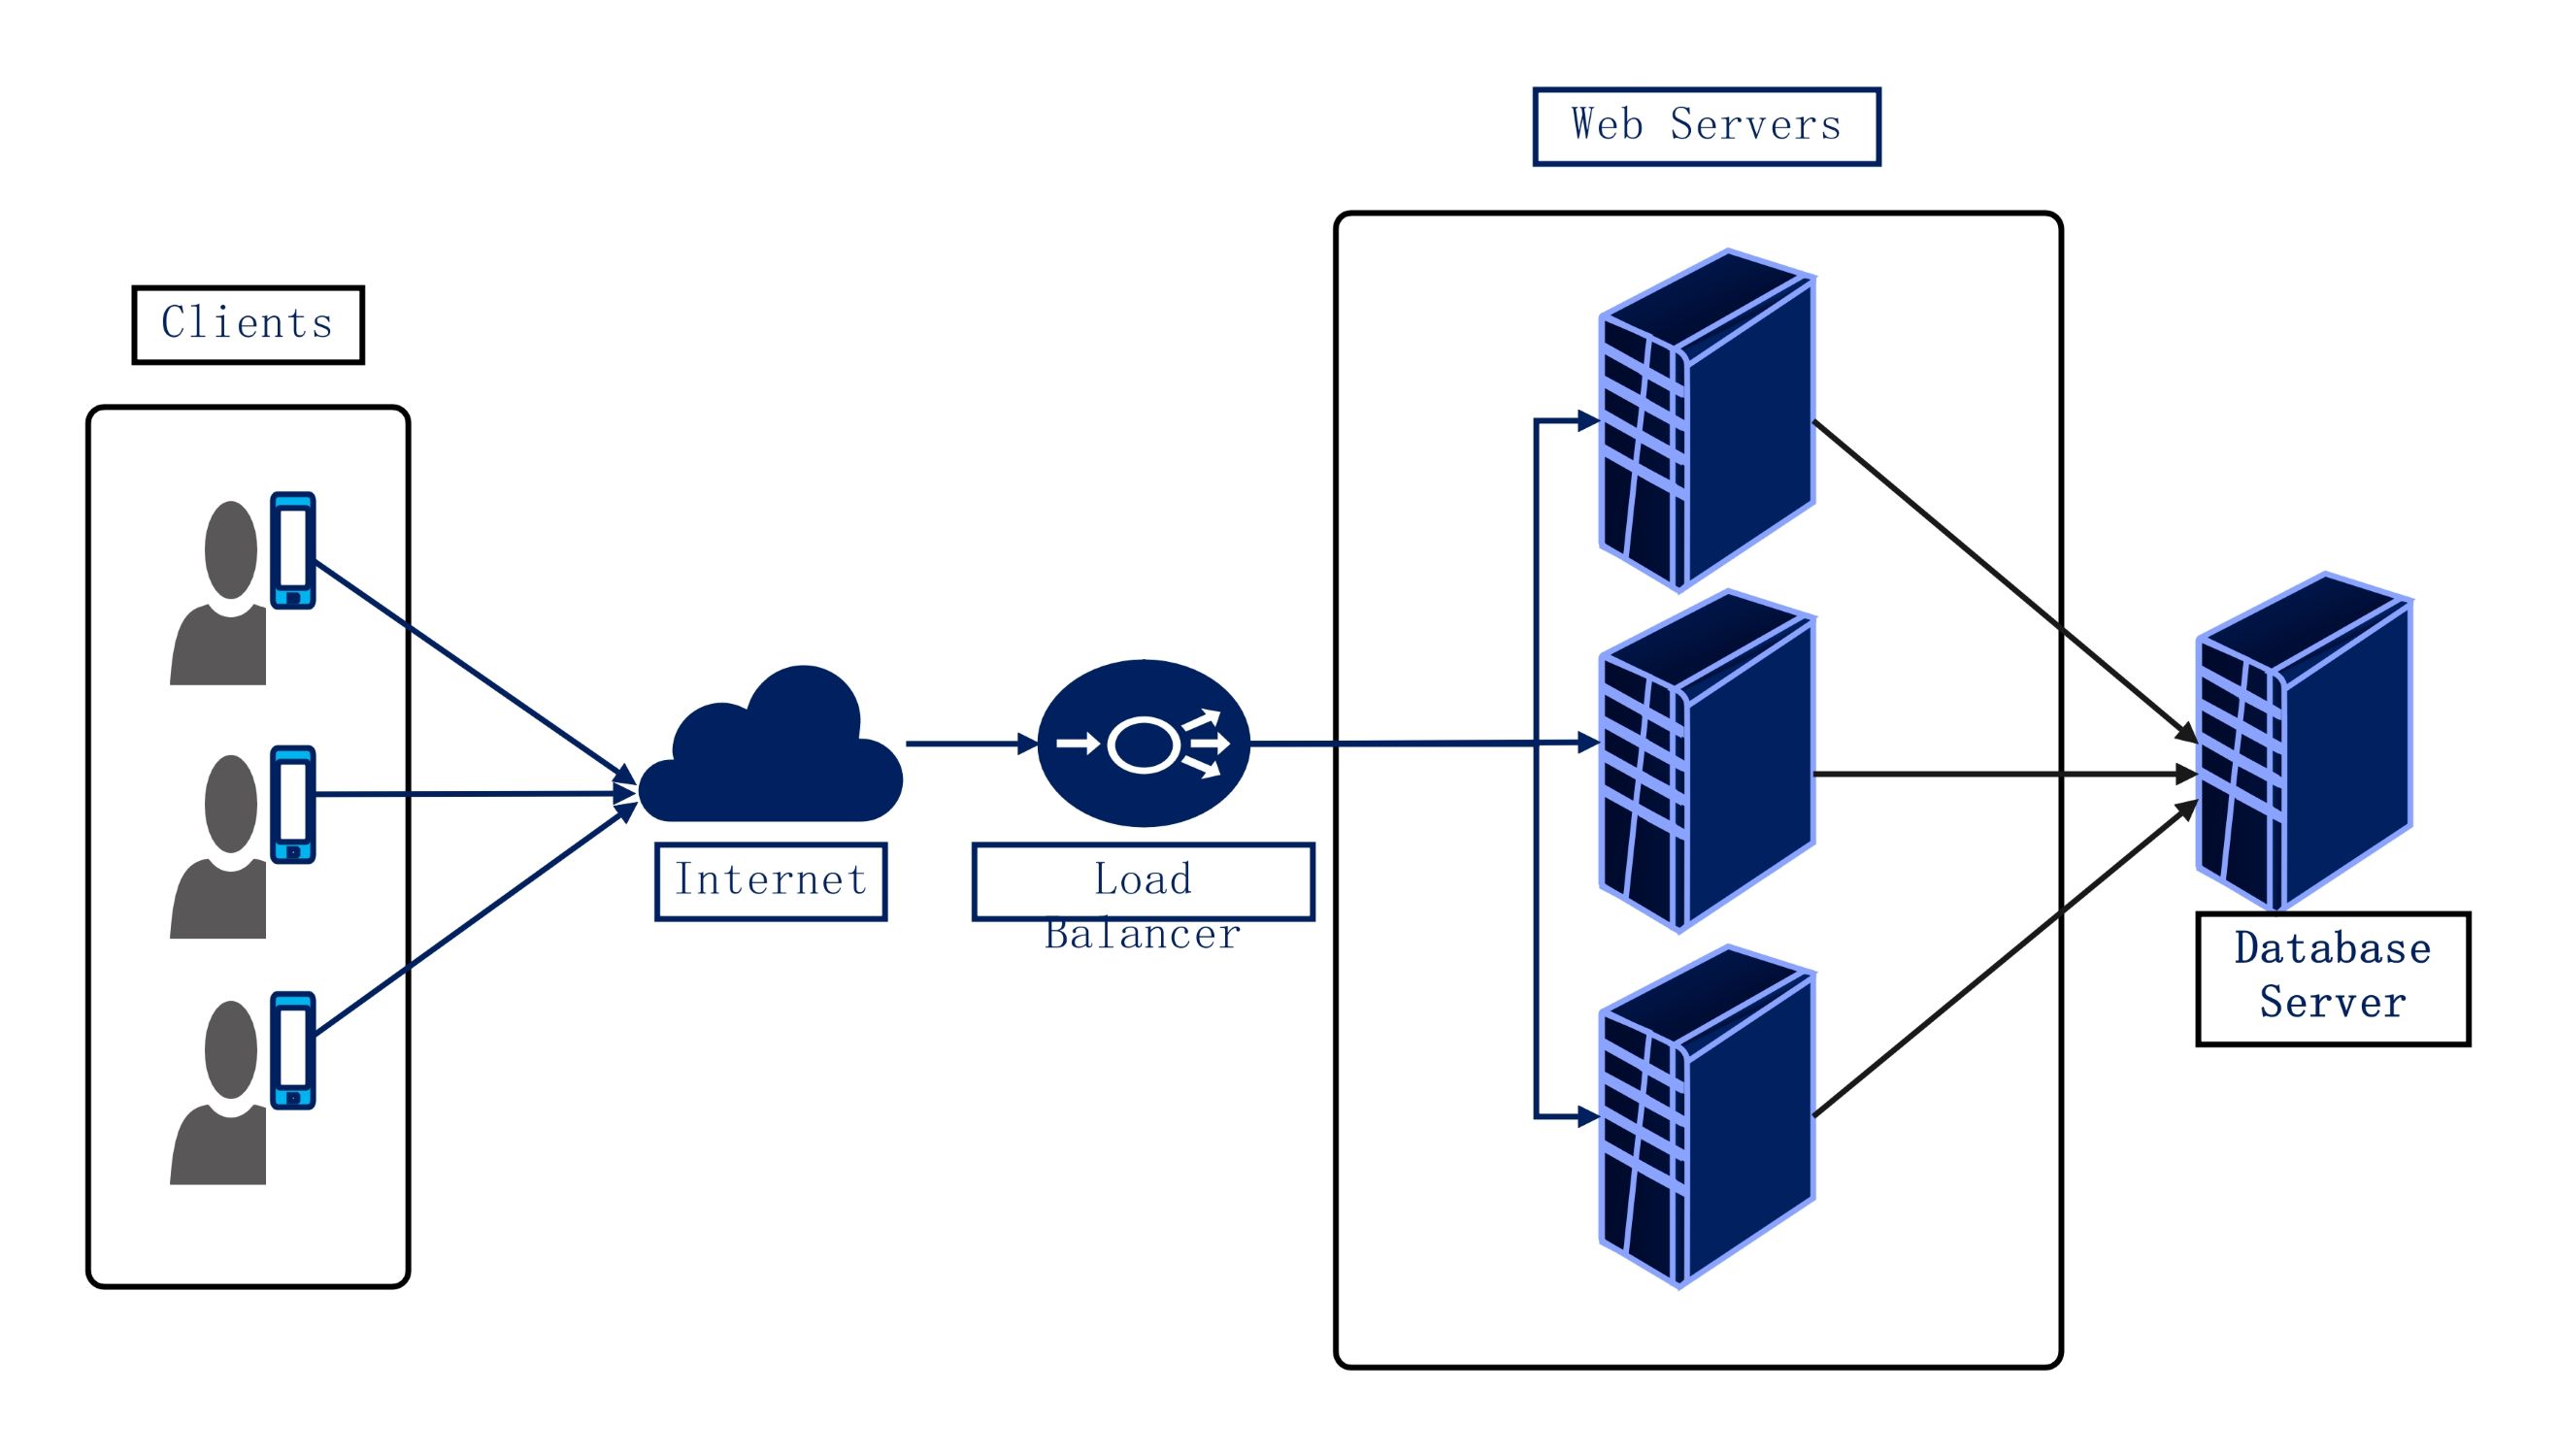
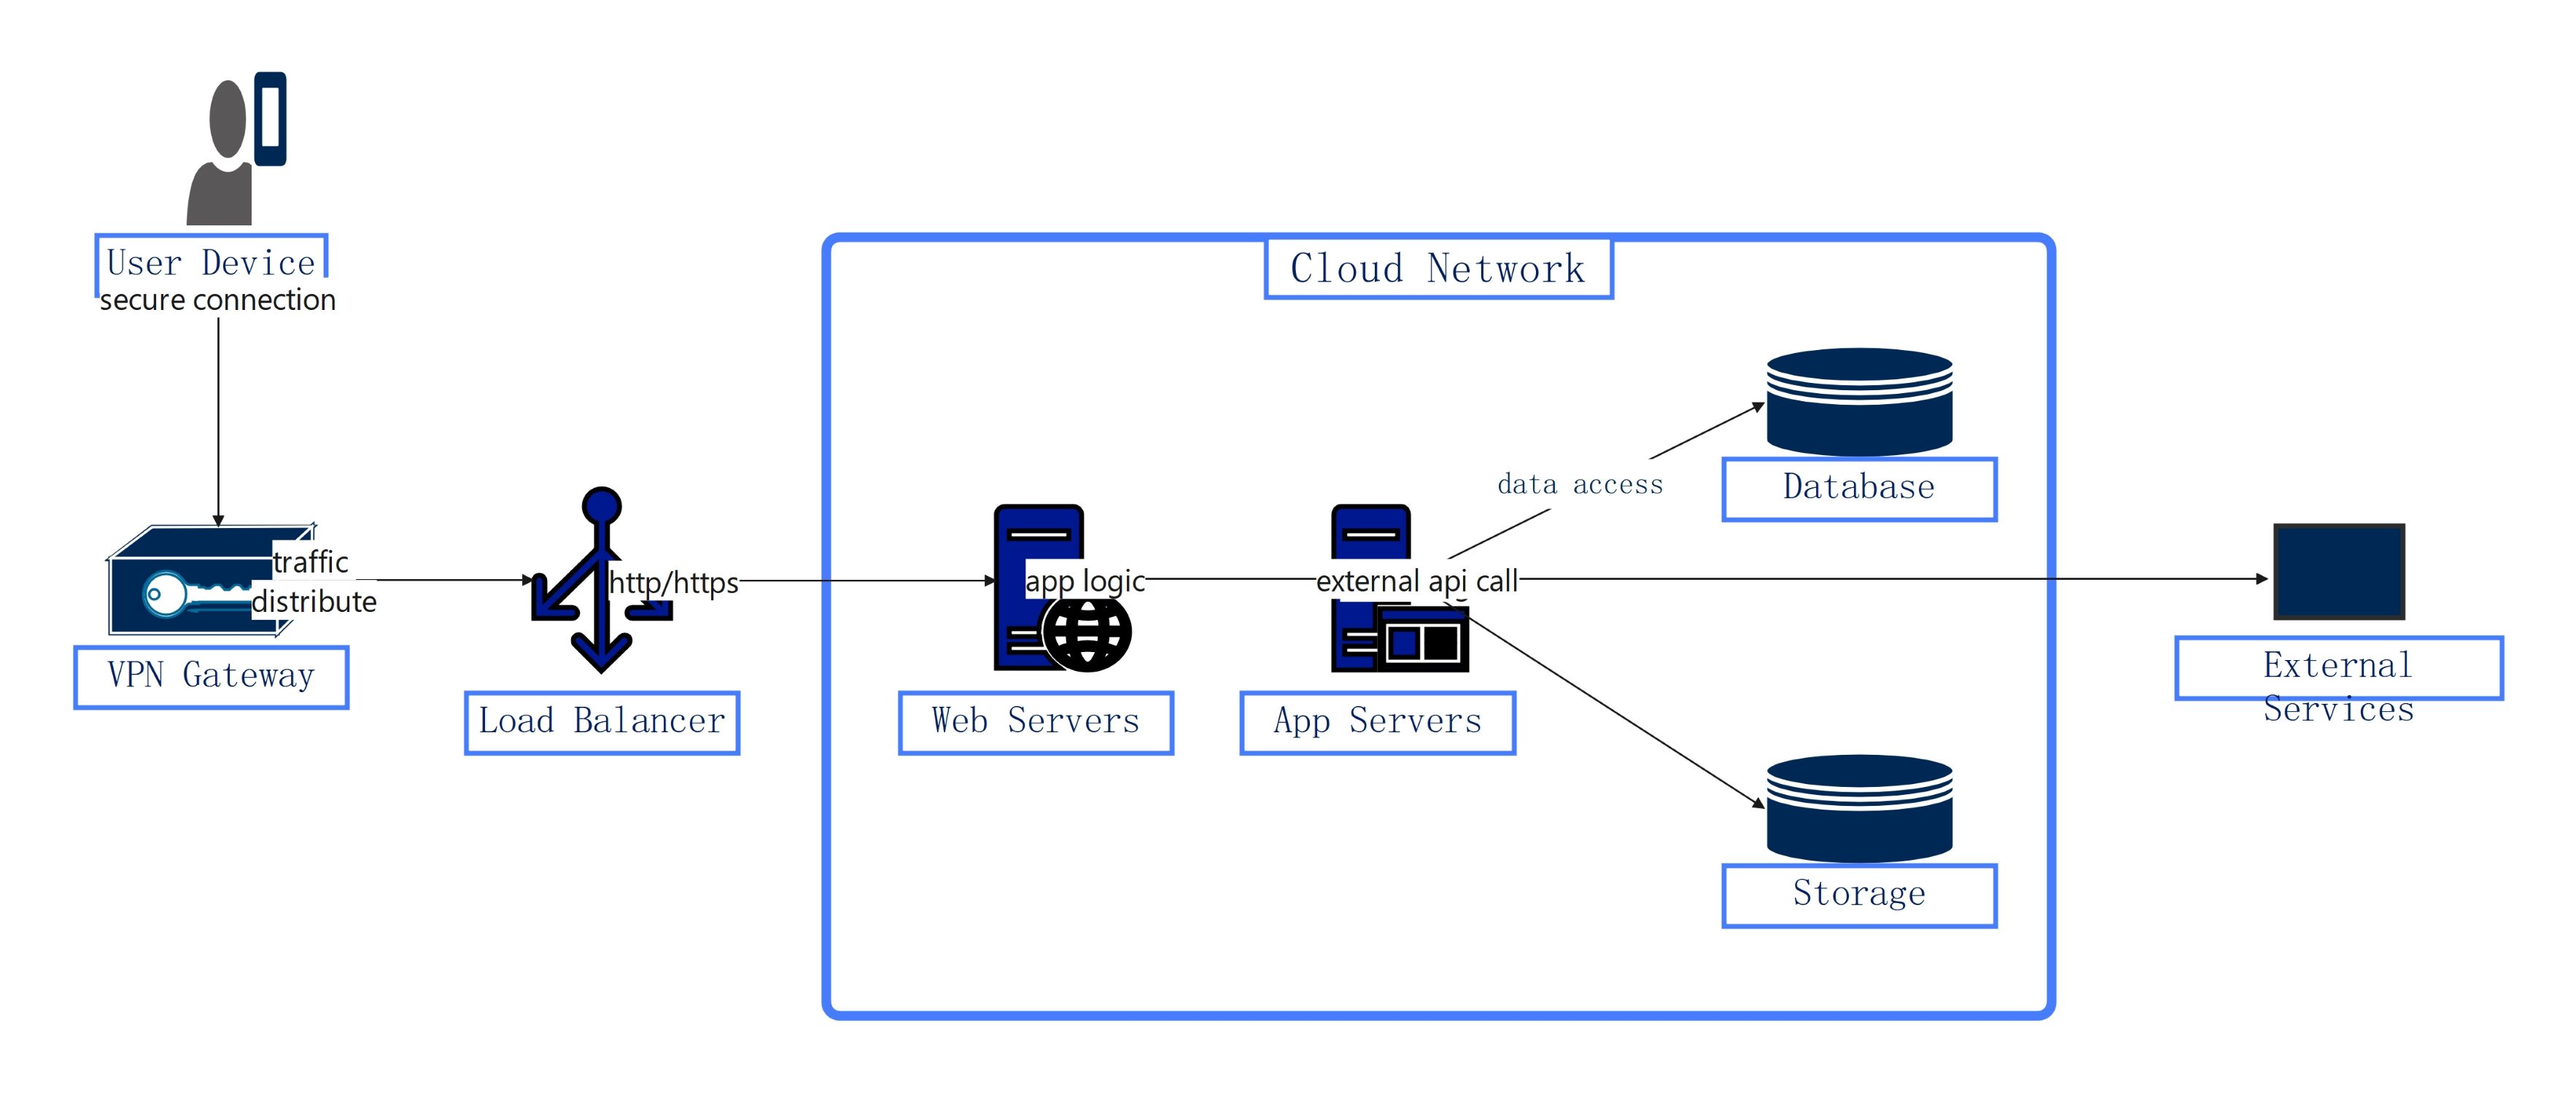
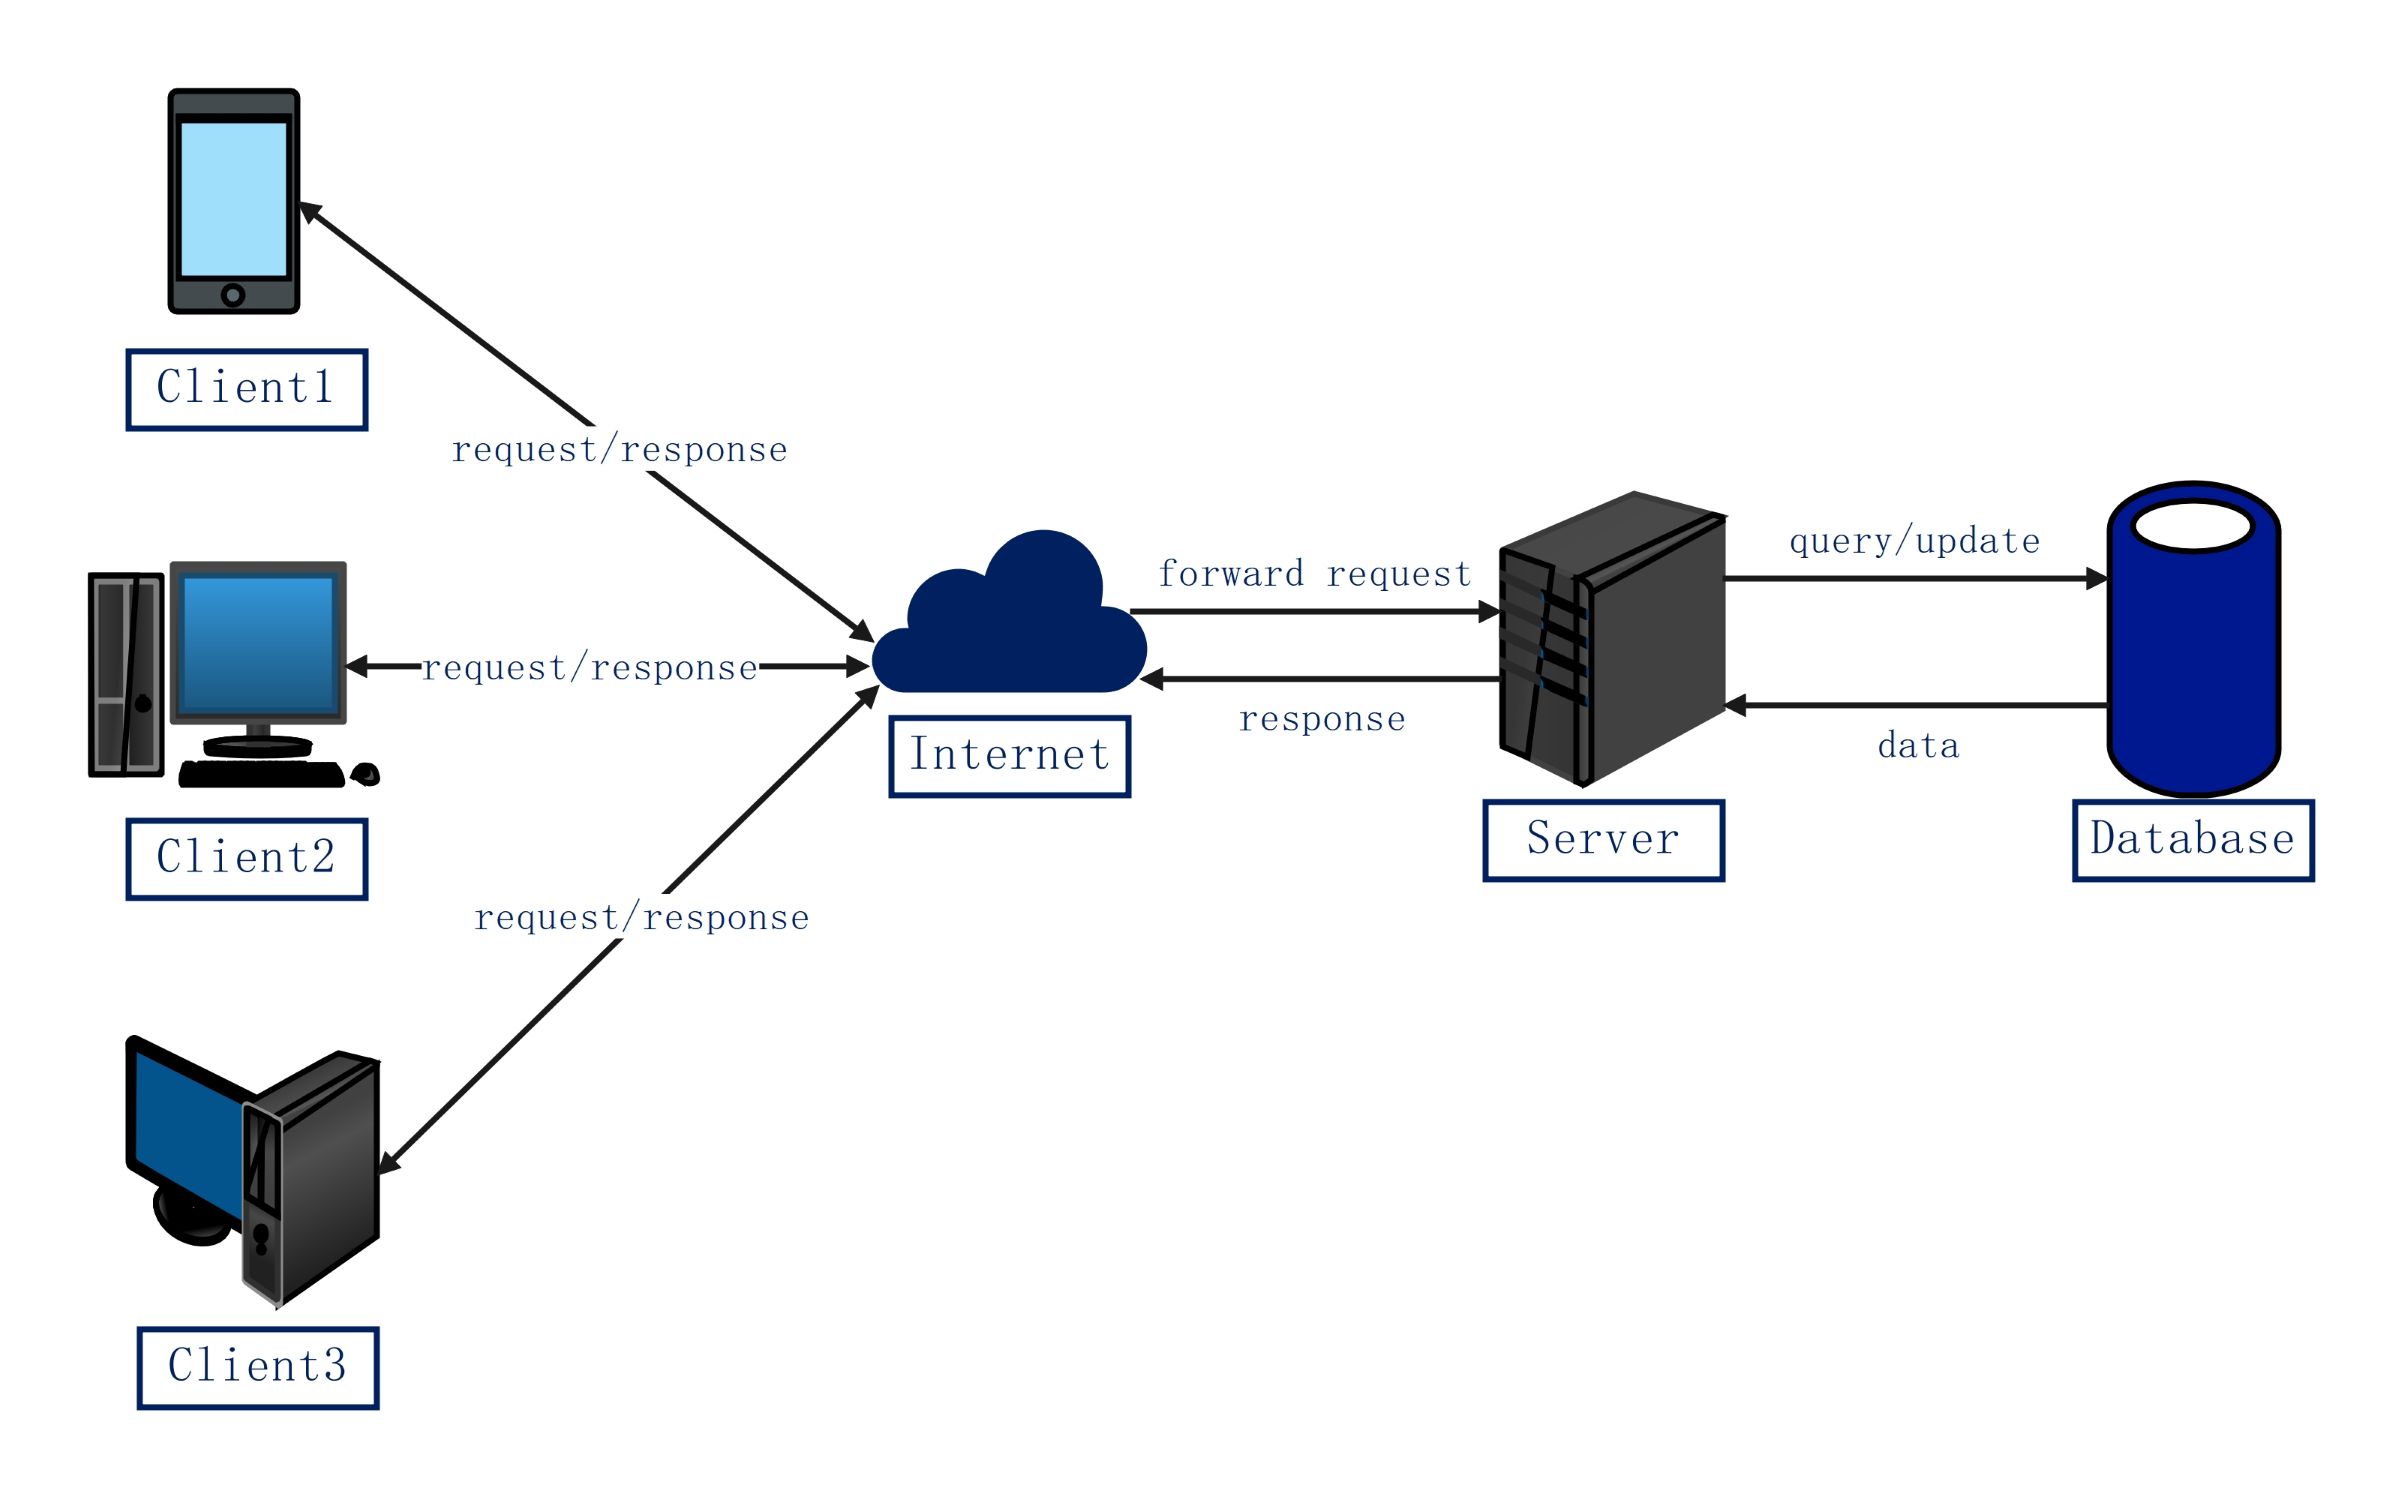
This network diagram for client server template visualizes the data exchange process. It maps out how multiple client devices interact with a central server via the internet. Use it to design robust web applications and professional internal company networks.
Client Devices
The client devices represent the starting point of any network request. These include mobile phones, tablets, and desktop computers used by end-users. They initiate communication by sending specific data requests through the web.
- Client 1: Mobile or smartphone device
- Client 2: Standard desktop computer setup
- Client 3: Workstation or additional desktop unit
The Internet Gateway
The internet serves as the bridge between the end-users and the central server. It facilitates the movement of requests and responses. This layer ensures that data packets travel across global networks to reach the destination.
- Request and response handling
- Cloud-based communication hub
- Forwarding traffic to the server
Server and Database Backend
The server processes incoming requests and communicates with the database. It acts as the brain of the system by managing logic. The database stores critical information and provides the data required by the server.
- Central Server for processing logic
- Database for information storage
- Query and update data flow
FAQs about this Template
-
What is a network diagram for client server?
A network diagram for client server is a visual map that shows the relationship between user devices and a central computer. It details how clients send requests for information and how the server fulfills them. This chart is vital for developers and IT teams. It helps them identify potential bottlenecks and plan for better system security during the initial design phase.
-
How does data flow in a client-server model?
In this model, data starts at the client device as a request. It travels through the internet to reach the central server. The server then checks the database for the necessary information. Once found, the server sends the data back to the client. This two-way communication loop ensures that users get the specific information or services they need quickly.
-
Why should I use a template for my network diagram?
Using a template saves significant time and ensures you follow industry standards. It provides a clear structure that is easy for team members and stakeholders to understand. You do not have to draw every icon from scratch. Instead, you can focus on technical details. This approach reduces errors and helps you create a professional visual representation of your IT architecture.