About this Network Diagram for Content Delivery Network template
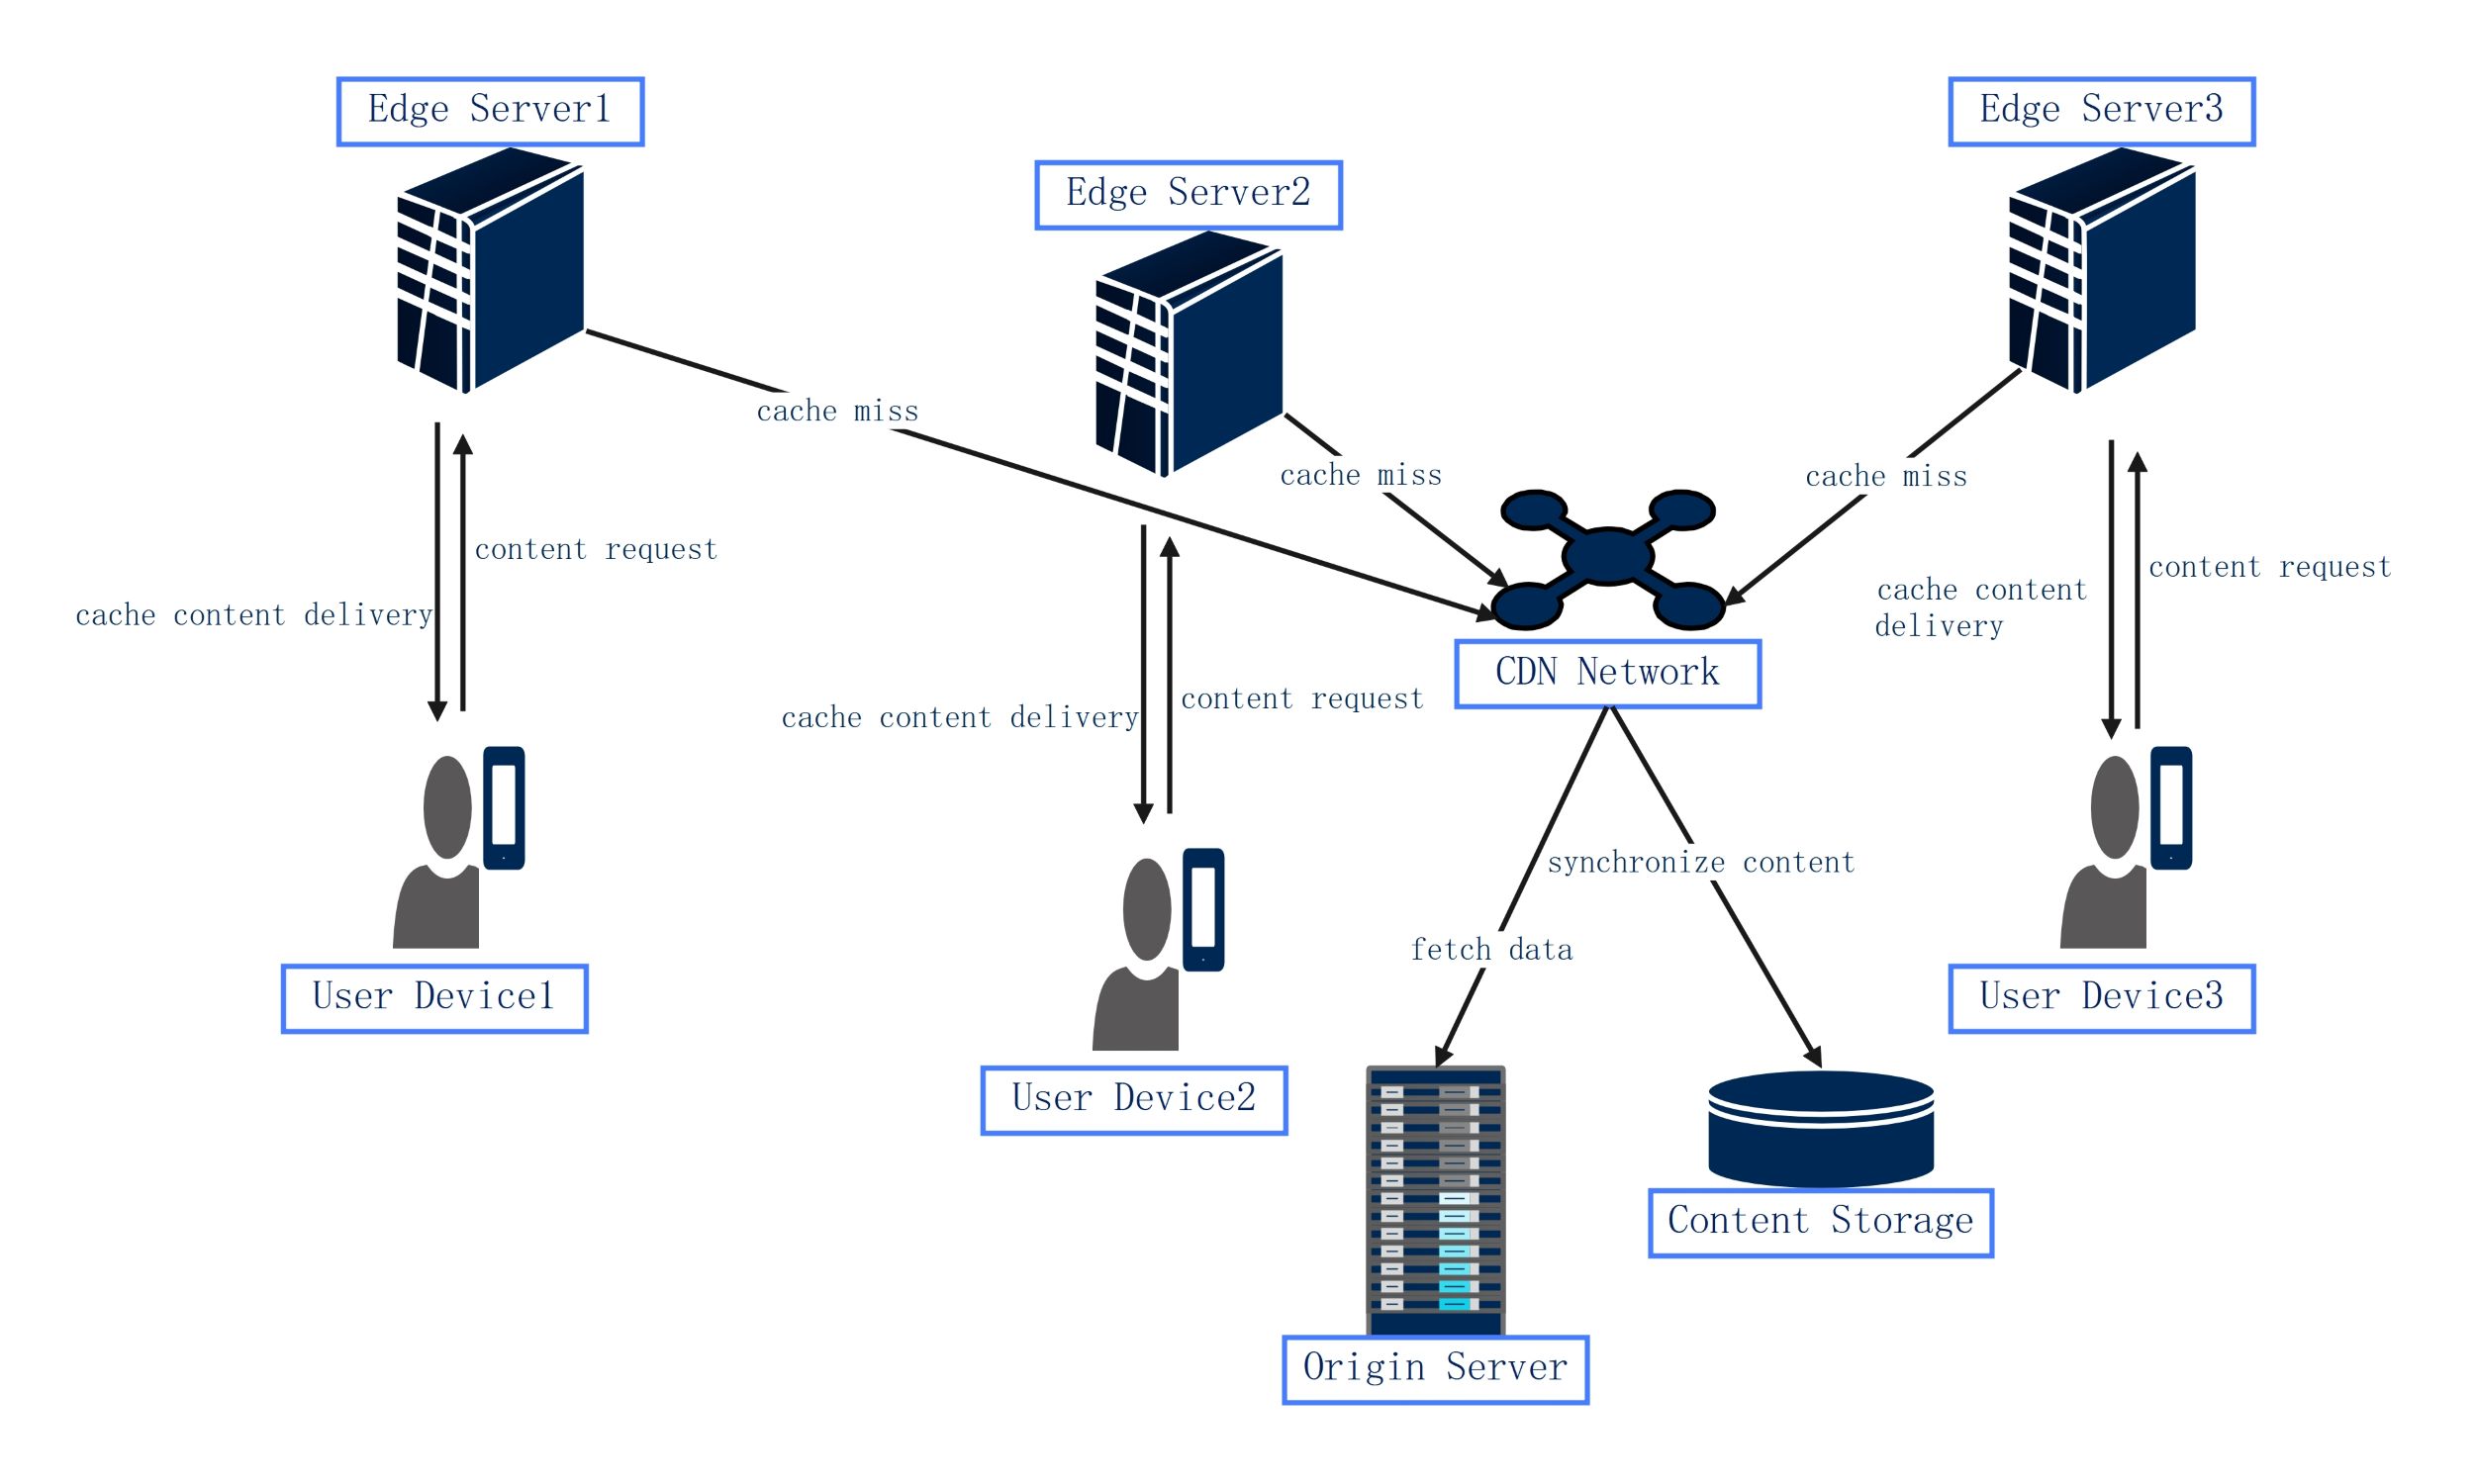
This template provides a clear visual layout of how a CDN functions. It maps the connection between end-users and the data source. Use it to design high-performance web systems and explain complex data flows to stakeholders.
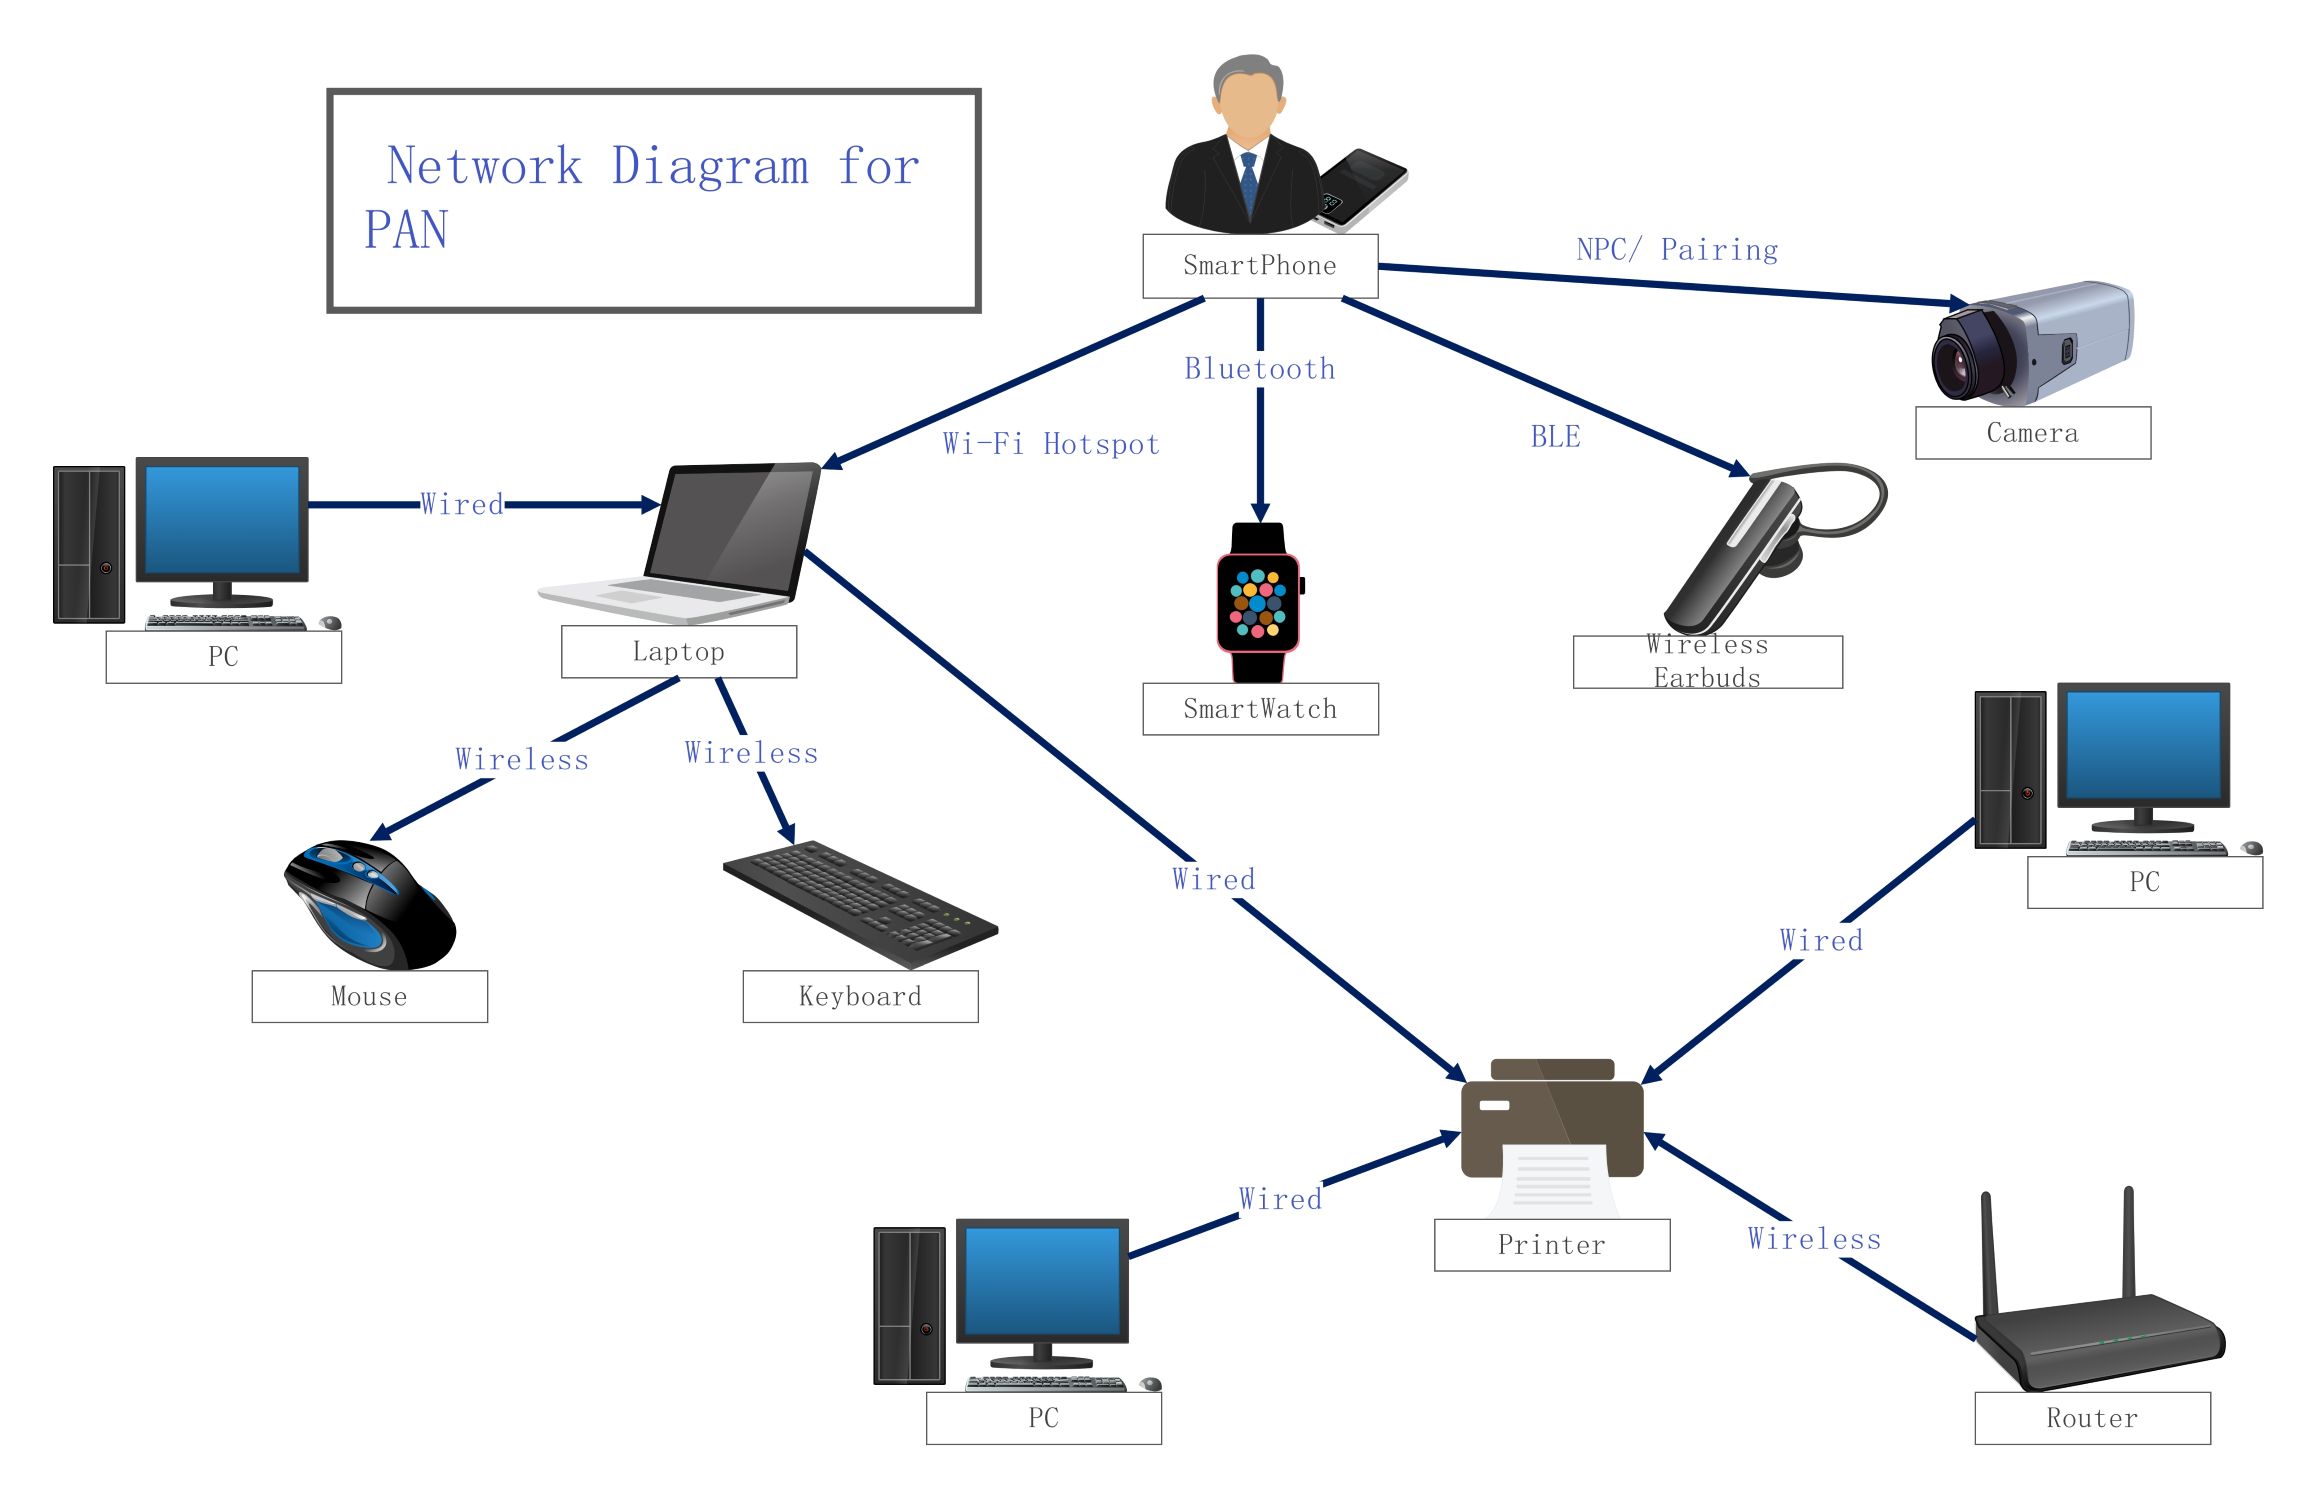
Edge Server Infrastructure
Edge servers are the first point of contact for users requesting online content. They store cached versions of data to reduce latency and improve speed. These servers sit between the user and the main data source.
- Edge Server 1
- Edge Server 2
- Edge Server 3
- Cache content delivery
- Cache miss protocols
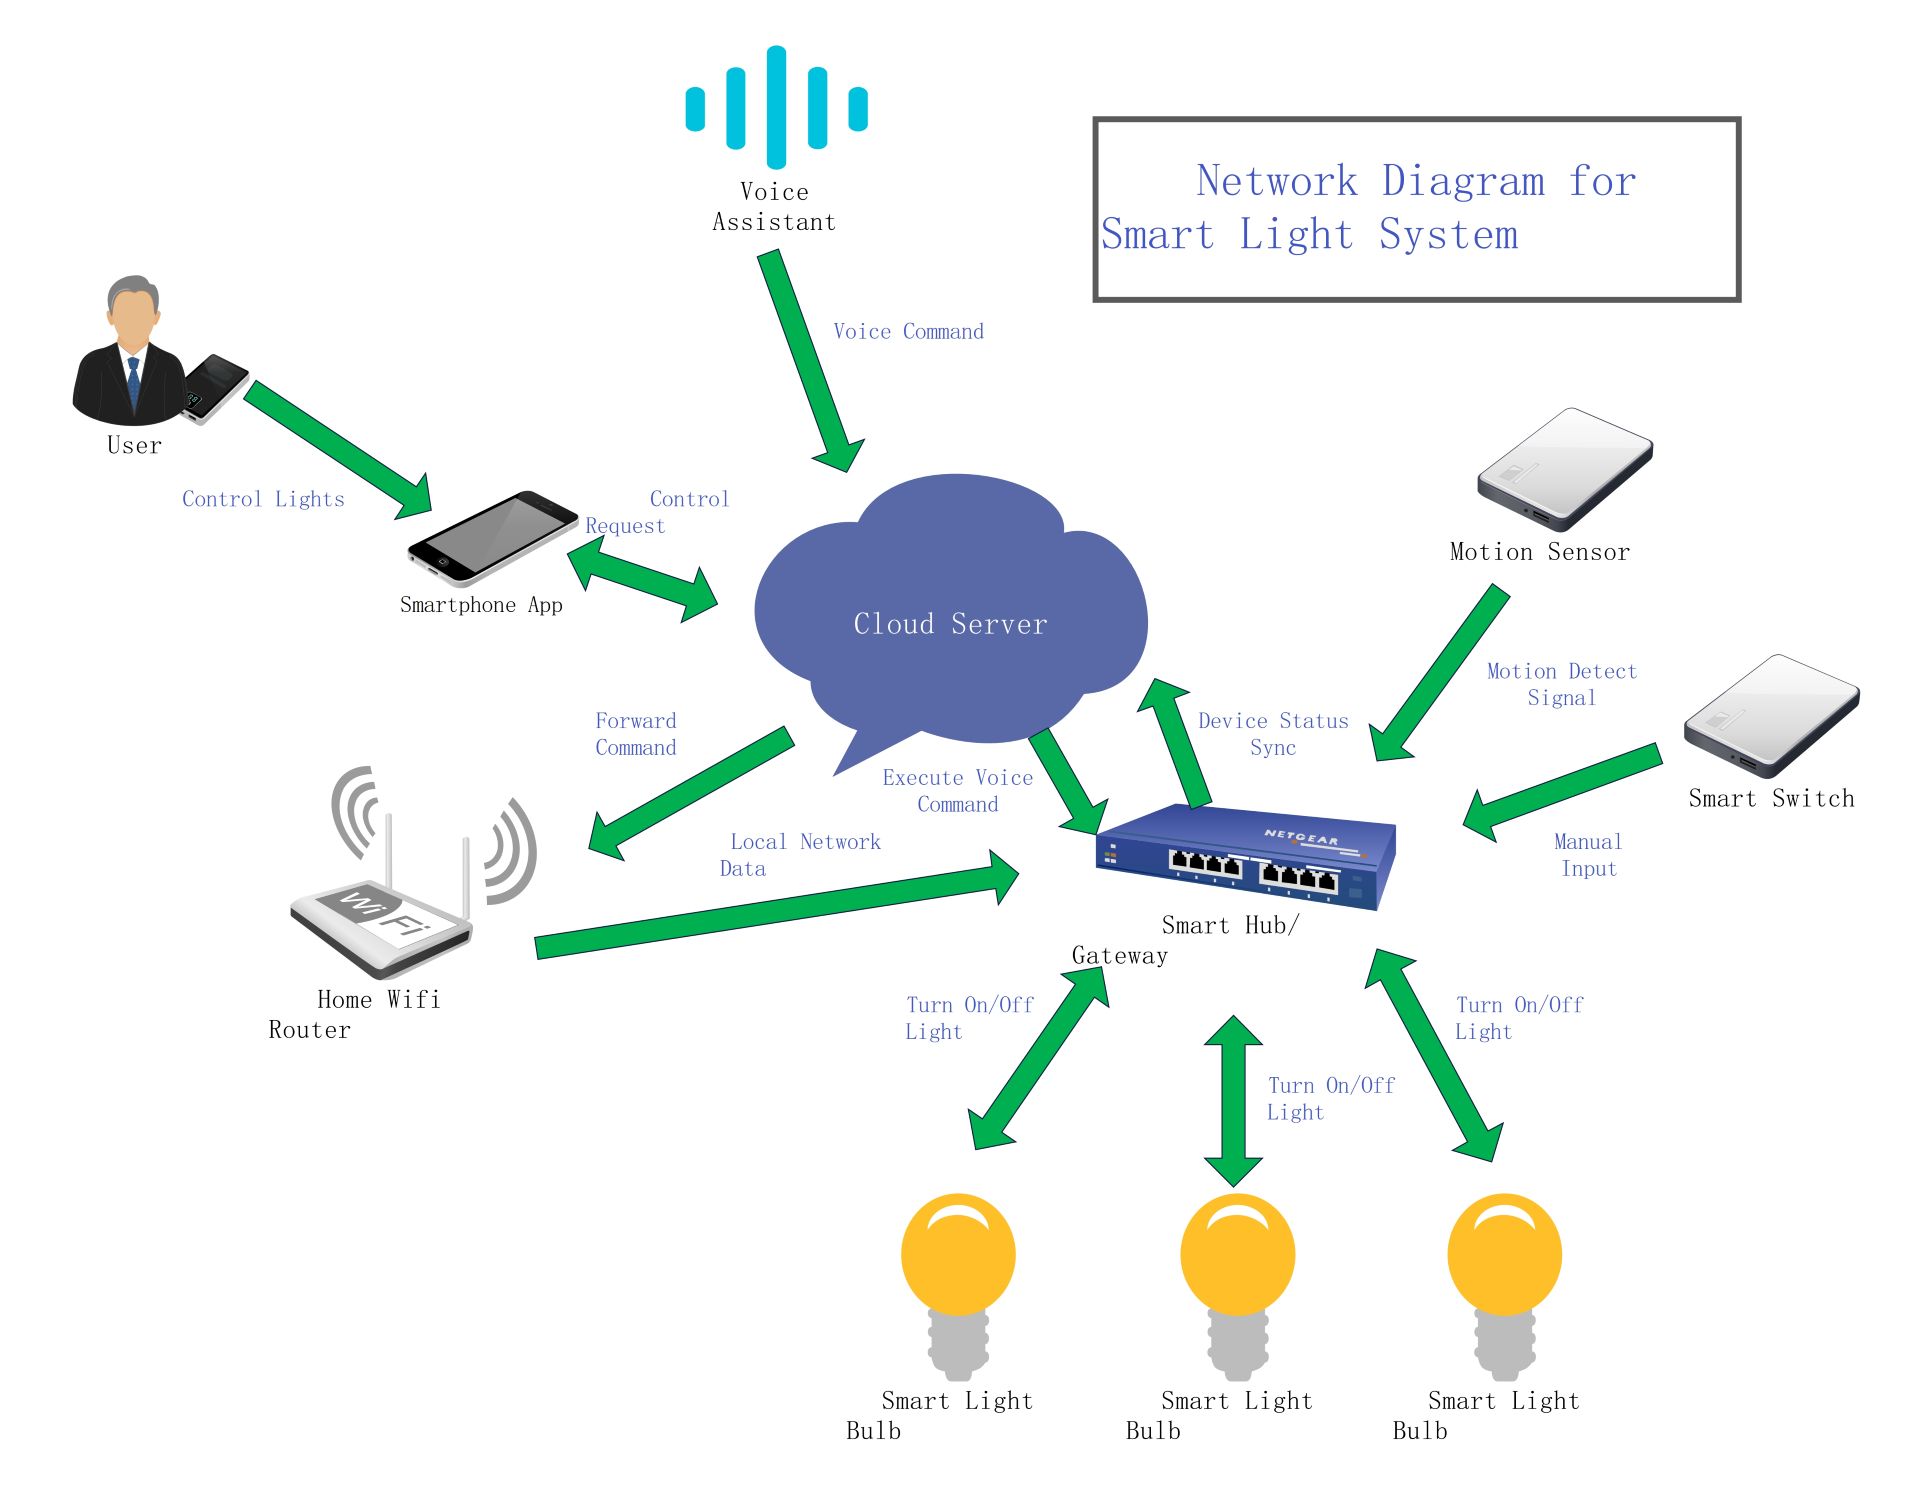
User Device Access
End-users connect to the CDN through various devices like smartphones or laptops. When a user requests data, the system routes them to the nearest server. This process ensures the fastest possible load times for web applications.
- User Device 1
- User Device 2
- User Device 3
- Content request signals
- Optimized delivery paths
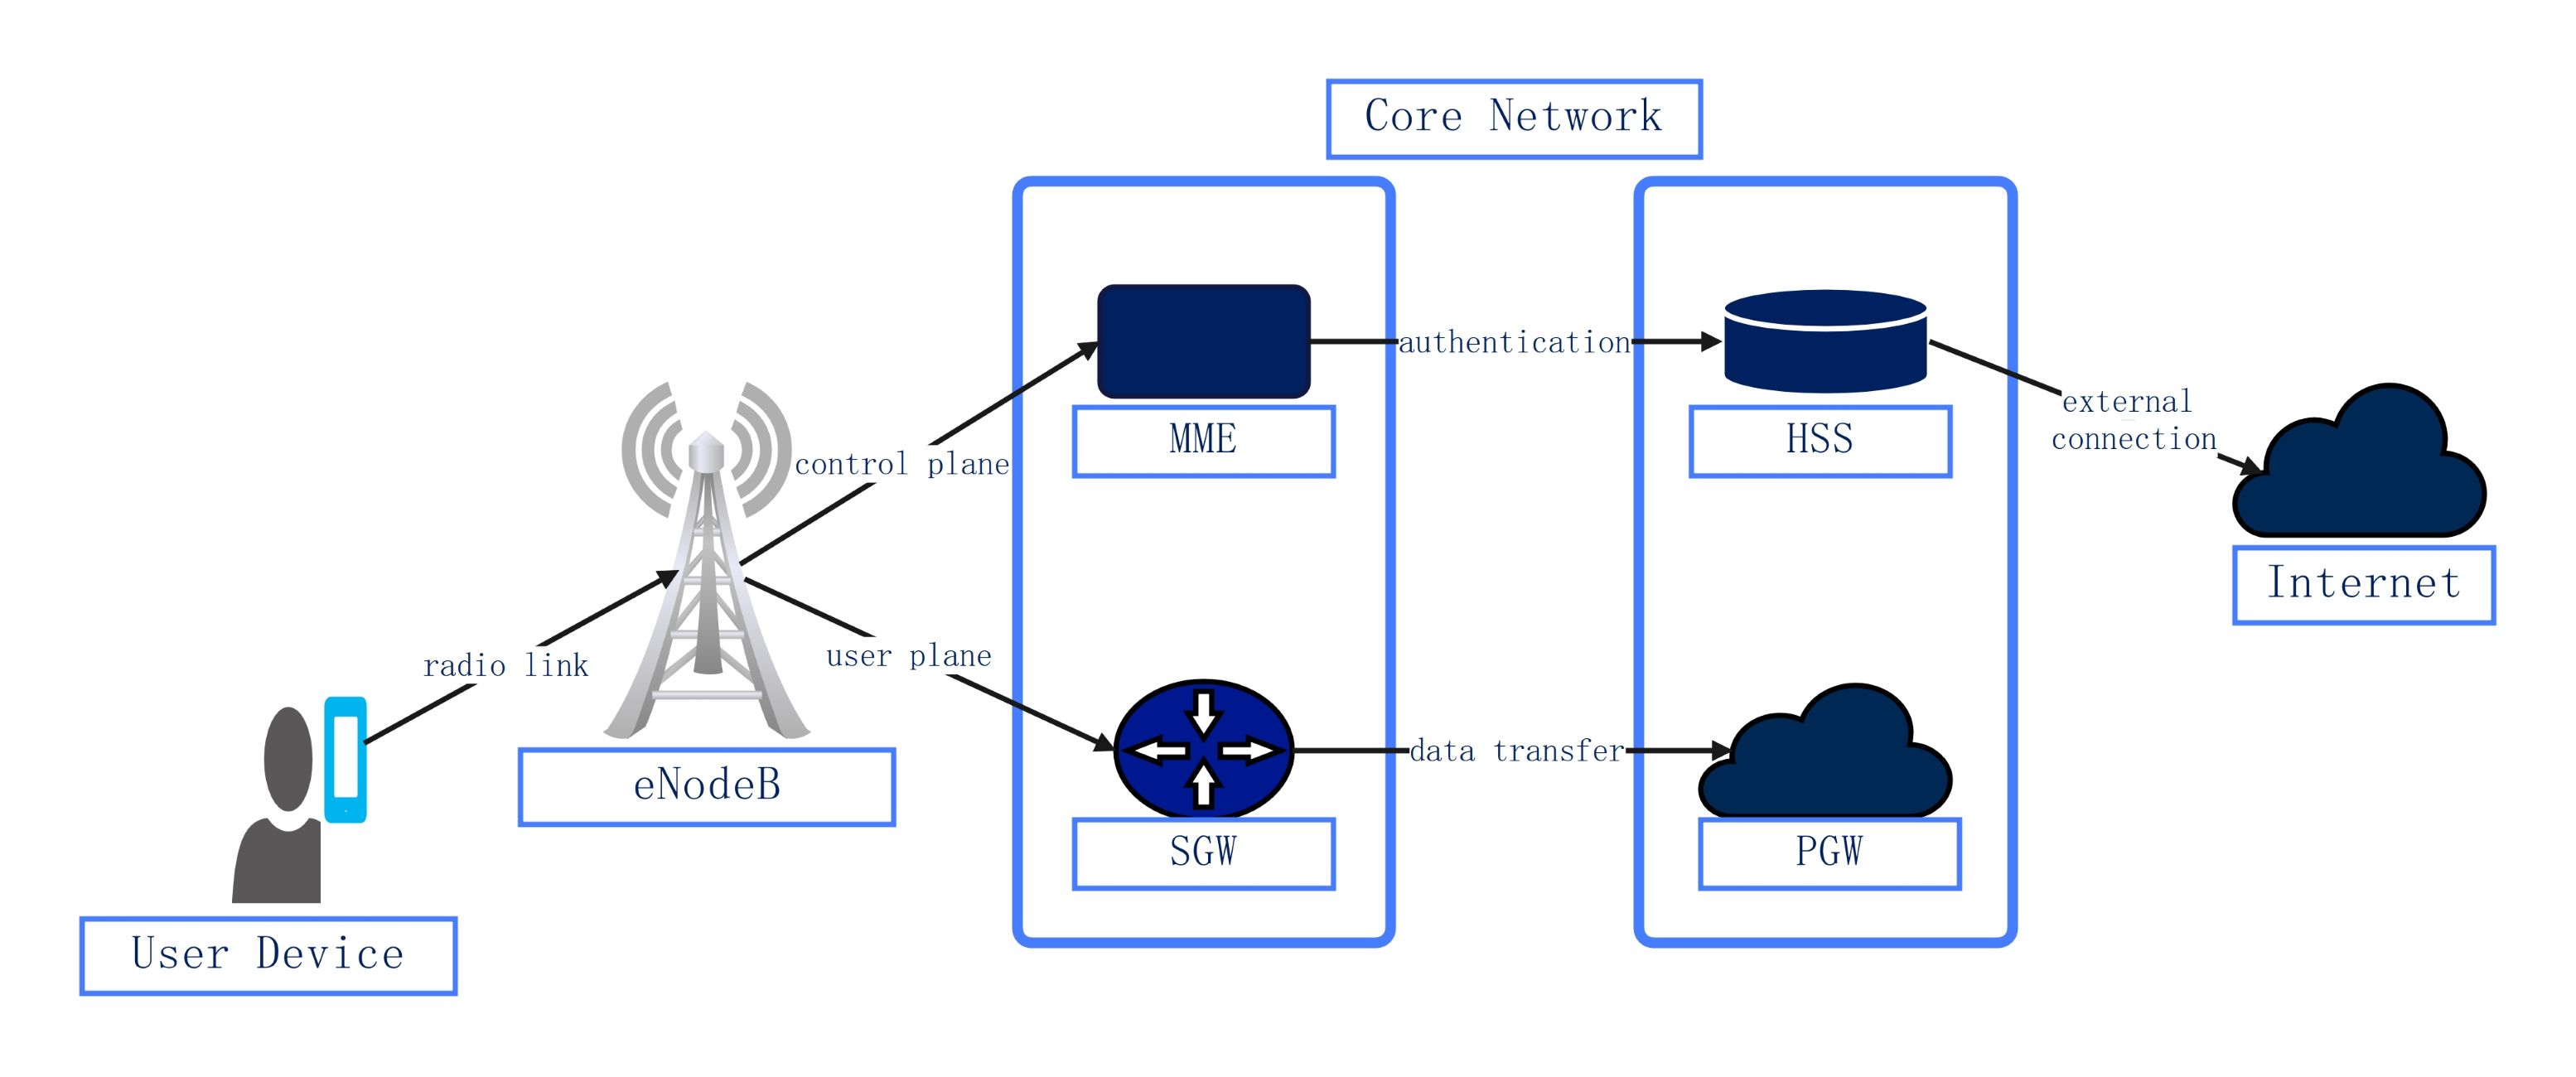
Core Network and Storage
The origin server and content storage form the heart of the system. If an edge server lacks a file, it fetches data from here. The central network synchronizes content to ensure all edge locations have the latest files.
- Origin Server
- Content Storage
- CDN Network hub
- Synchronize content flow
- Data fetch operations
FAQs about this Template
-
How does a CDN improve website performance?
A CDN improves performance by reducing the physical distance between the server and the user. By storing cached copies of website content on distributed edge servers, it minimizes latency. This means images, scripts, and videos load much faster. Shorter load times improve user experience, reduce bounce rates, and can even help search engine rankings for your web pages.
-
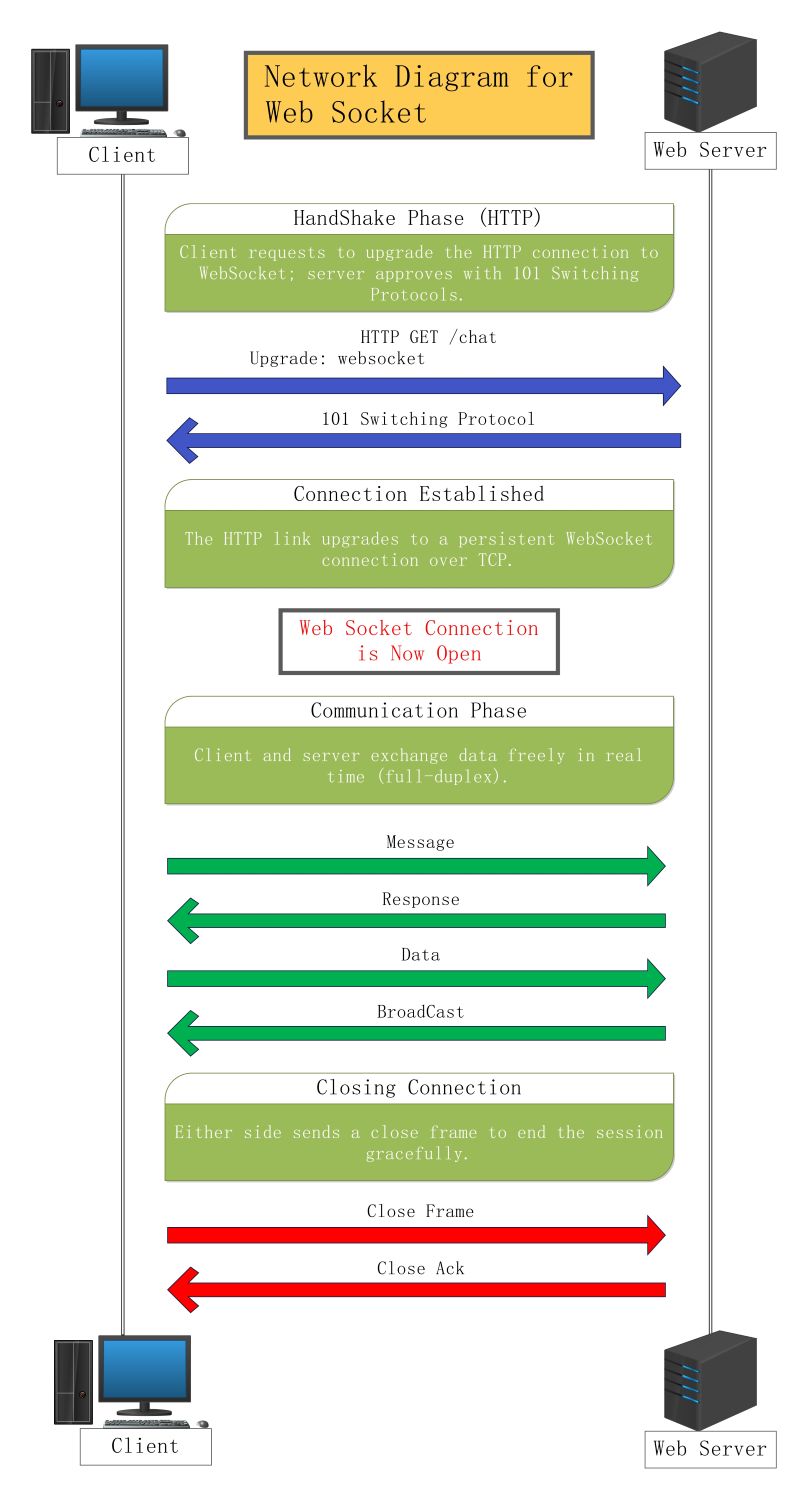
What happens during a cache miss in a CDN?
A cache miss occurs when a user requests a file that is not stored on the local edge server. When this happens, the edge server must contact the origin server to retrieve the necessary data. After fetching the file, the edge server delivers it to the user and stores a copy locally. This ensures future requests for the same file are faster.
-
Why should I use a network diagram to plan a CDN?
Using a network diagram helps you visualize the flow of data between users and servers. It allows IT professionals to identify potential bottlenecks and plan server locations strategically. A clear map makes it easier to explain the system to team members or clients. It also serves as a critical troubleshooting tool when performance issues arise within the content delivery pipeline.