- All templates
- Network diagram templates
- Network diagram edge computing
About this network diagram for edge computing
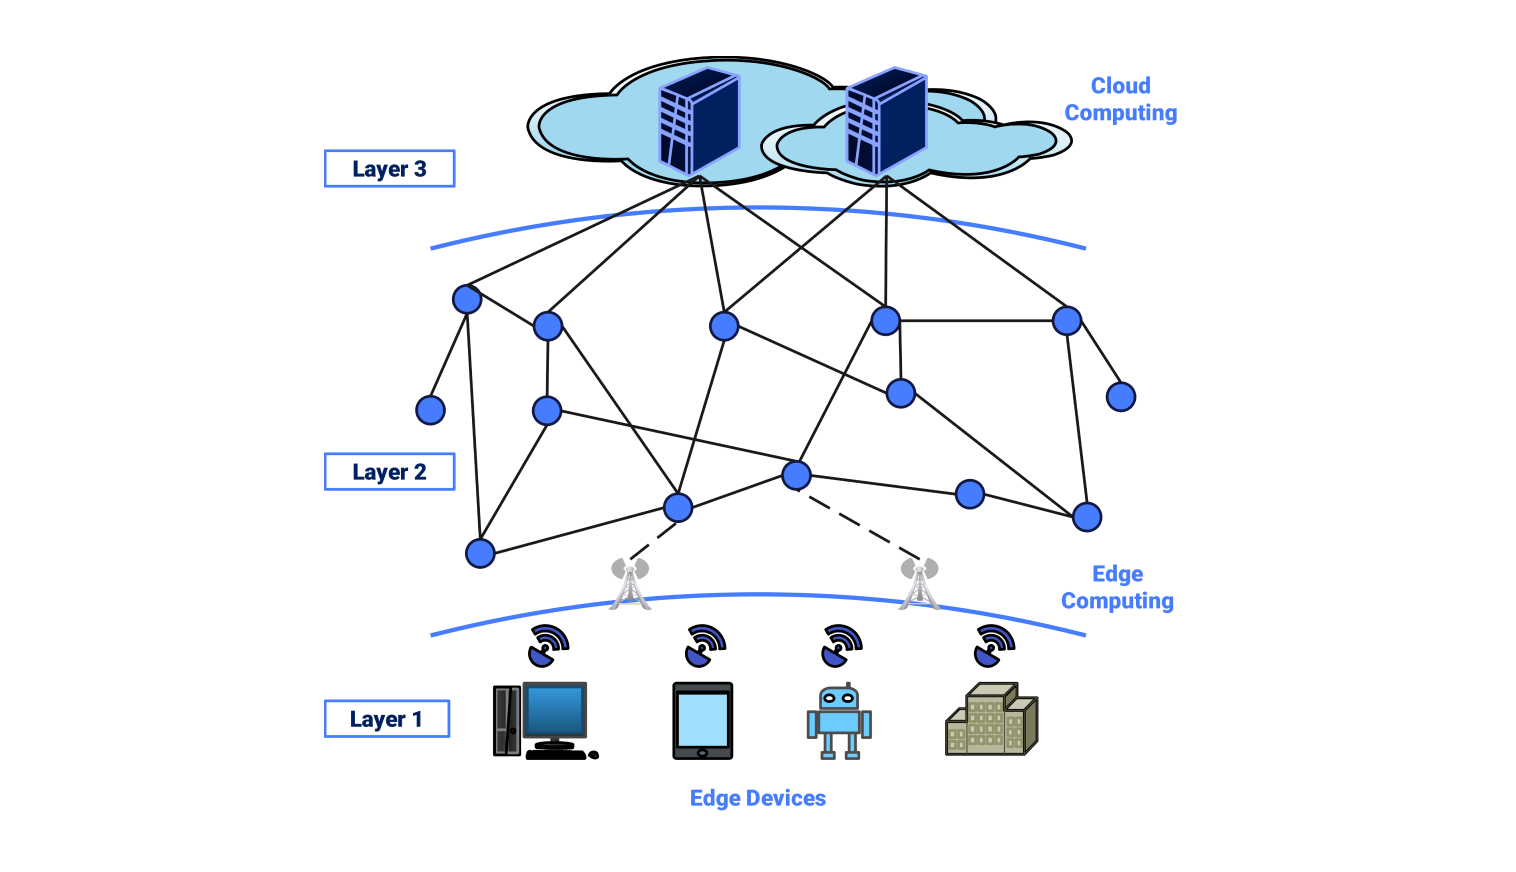
The edge computing network diagram depicts a layered architecture that aims to enhance data processing efficiency by balancing the load between the cloud and edge devices. This setup aims to speed up data handling. It should enable quick decision-making by computing the data close to its sources, without moving it far.
At layer 1 are the edge devices comprising computers, smartphones, IoT devices, and other similar local apparatus. These devices are data producers in that they either create or harvest information that will require processing.
A good example is temperature sensors present within factories. It collects data that must be analyzed instantly for safety. Some computation capabilities are assigned at the edge level. So, such devices can do basic computations and data trimming. Hence, only critical info is sent to the upper layers.
Layer 2 is where edge computing nodes, or intermediary processing units, come into play. These nodes connect the edge devices to the cloud. They can do more complex computations than the edge devices. But, they do not upload all the data to the cloud. These edge nodes can analyze data from several incoming streams. They will refine the data so only relevant information is sent to the cloud. This will result in saving bandwidth and improved processing.
Layer 3 consists of a cloud computing system where sophisticated processing and storage need is addressed. Cloud servers store data, carry out advanced analytics, and offer an additional backup for edge nodes. Edge nodes are for quick, real-time tasks. The cloud is for heavy processing and archiving. This framework optimizes efficiency.
This config performs better for apps needing very fast outputs. Examples are self-driving cars, smart cities, and factory automation. Latency is lower when quick, local decisions use edge computing. But, cloud resources run big data, machine learning, and storage over time. This provides a balanced load on the network.
In short, the edge computing network diagram here integrates cloud and edge resources. It is both scalable and efficient at managing data. It enables edge analytics and uses the cloud for heavy tasks. This optimizes speed, bandwidth, and processing in complex, data-rich apps.
Related templates
Get started with EdrawMax today
Create 210 types of diagrams online for free.
Draw a diagram free Draw a diagram free Draw a diagram free Draw a diagram free Draw a diagram free