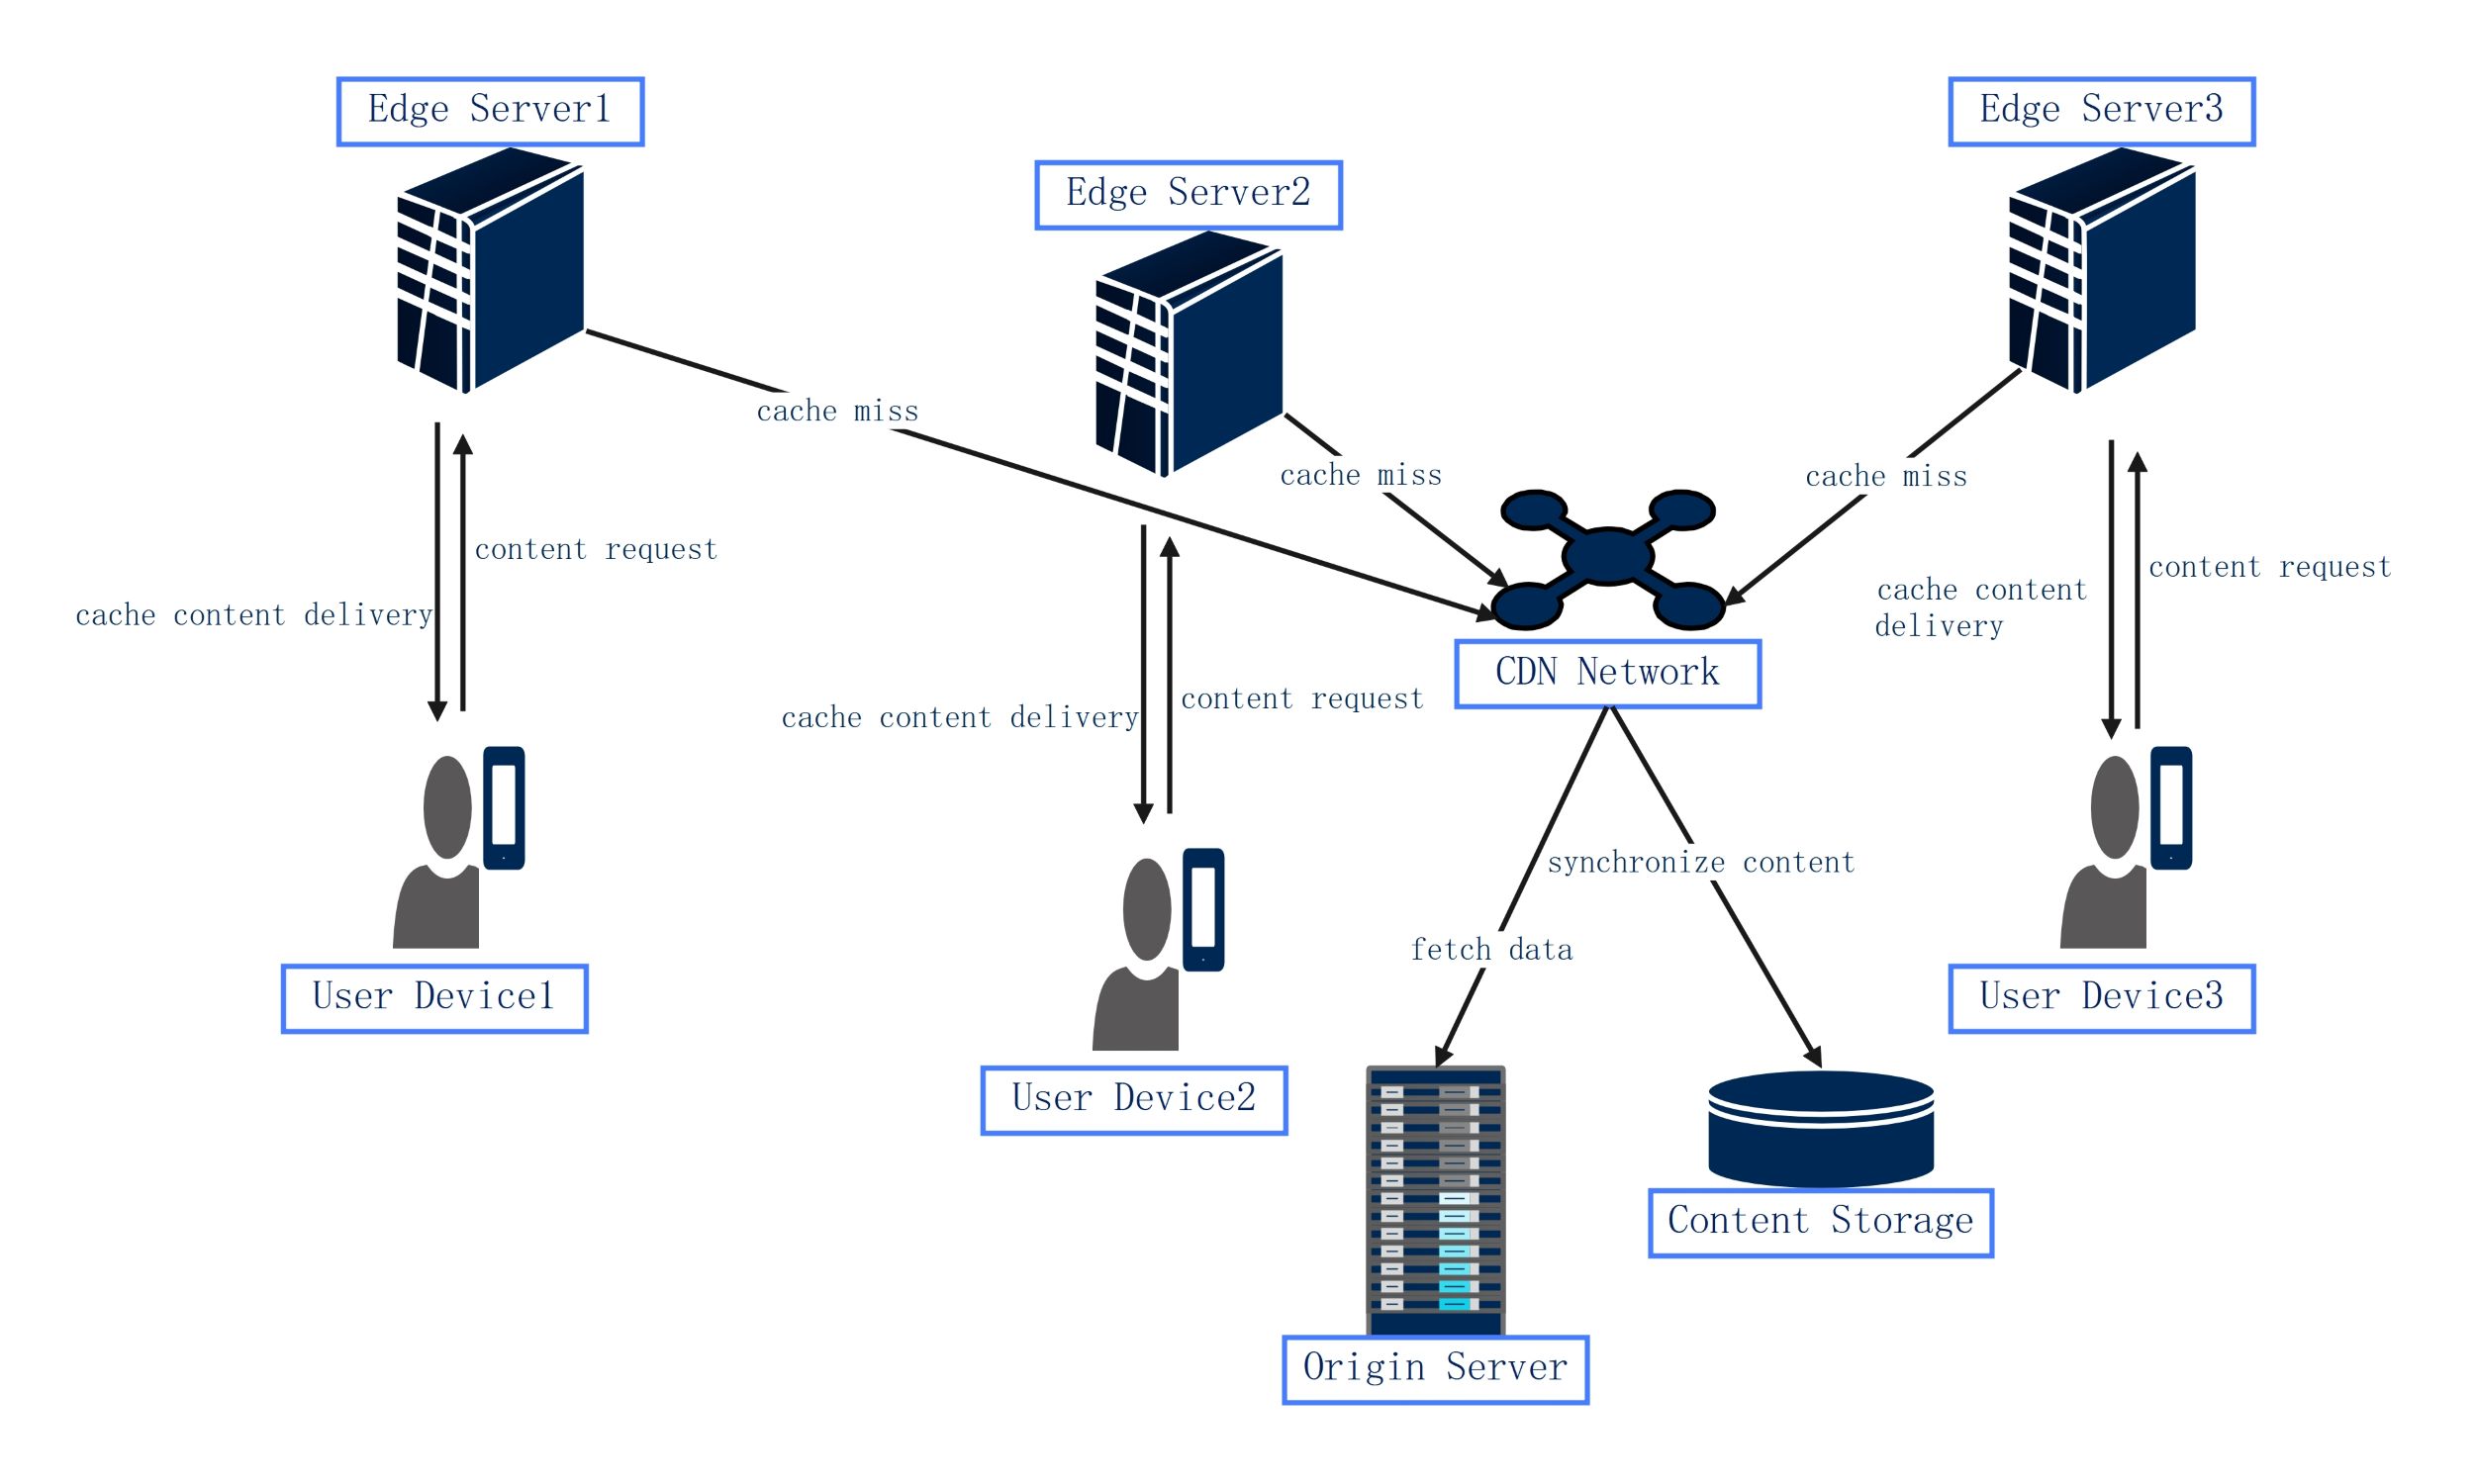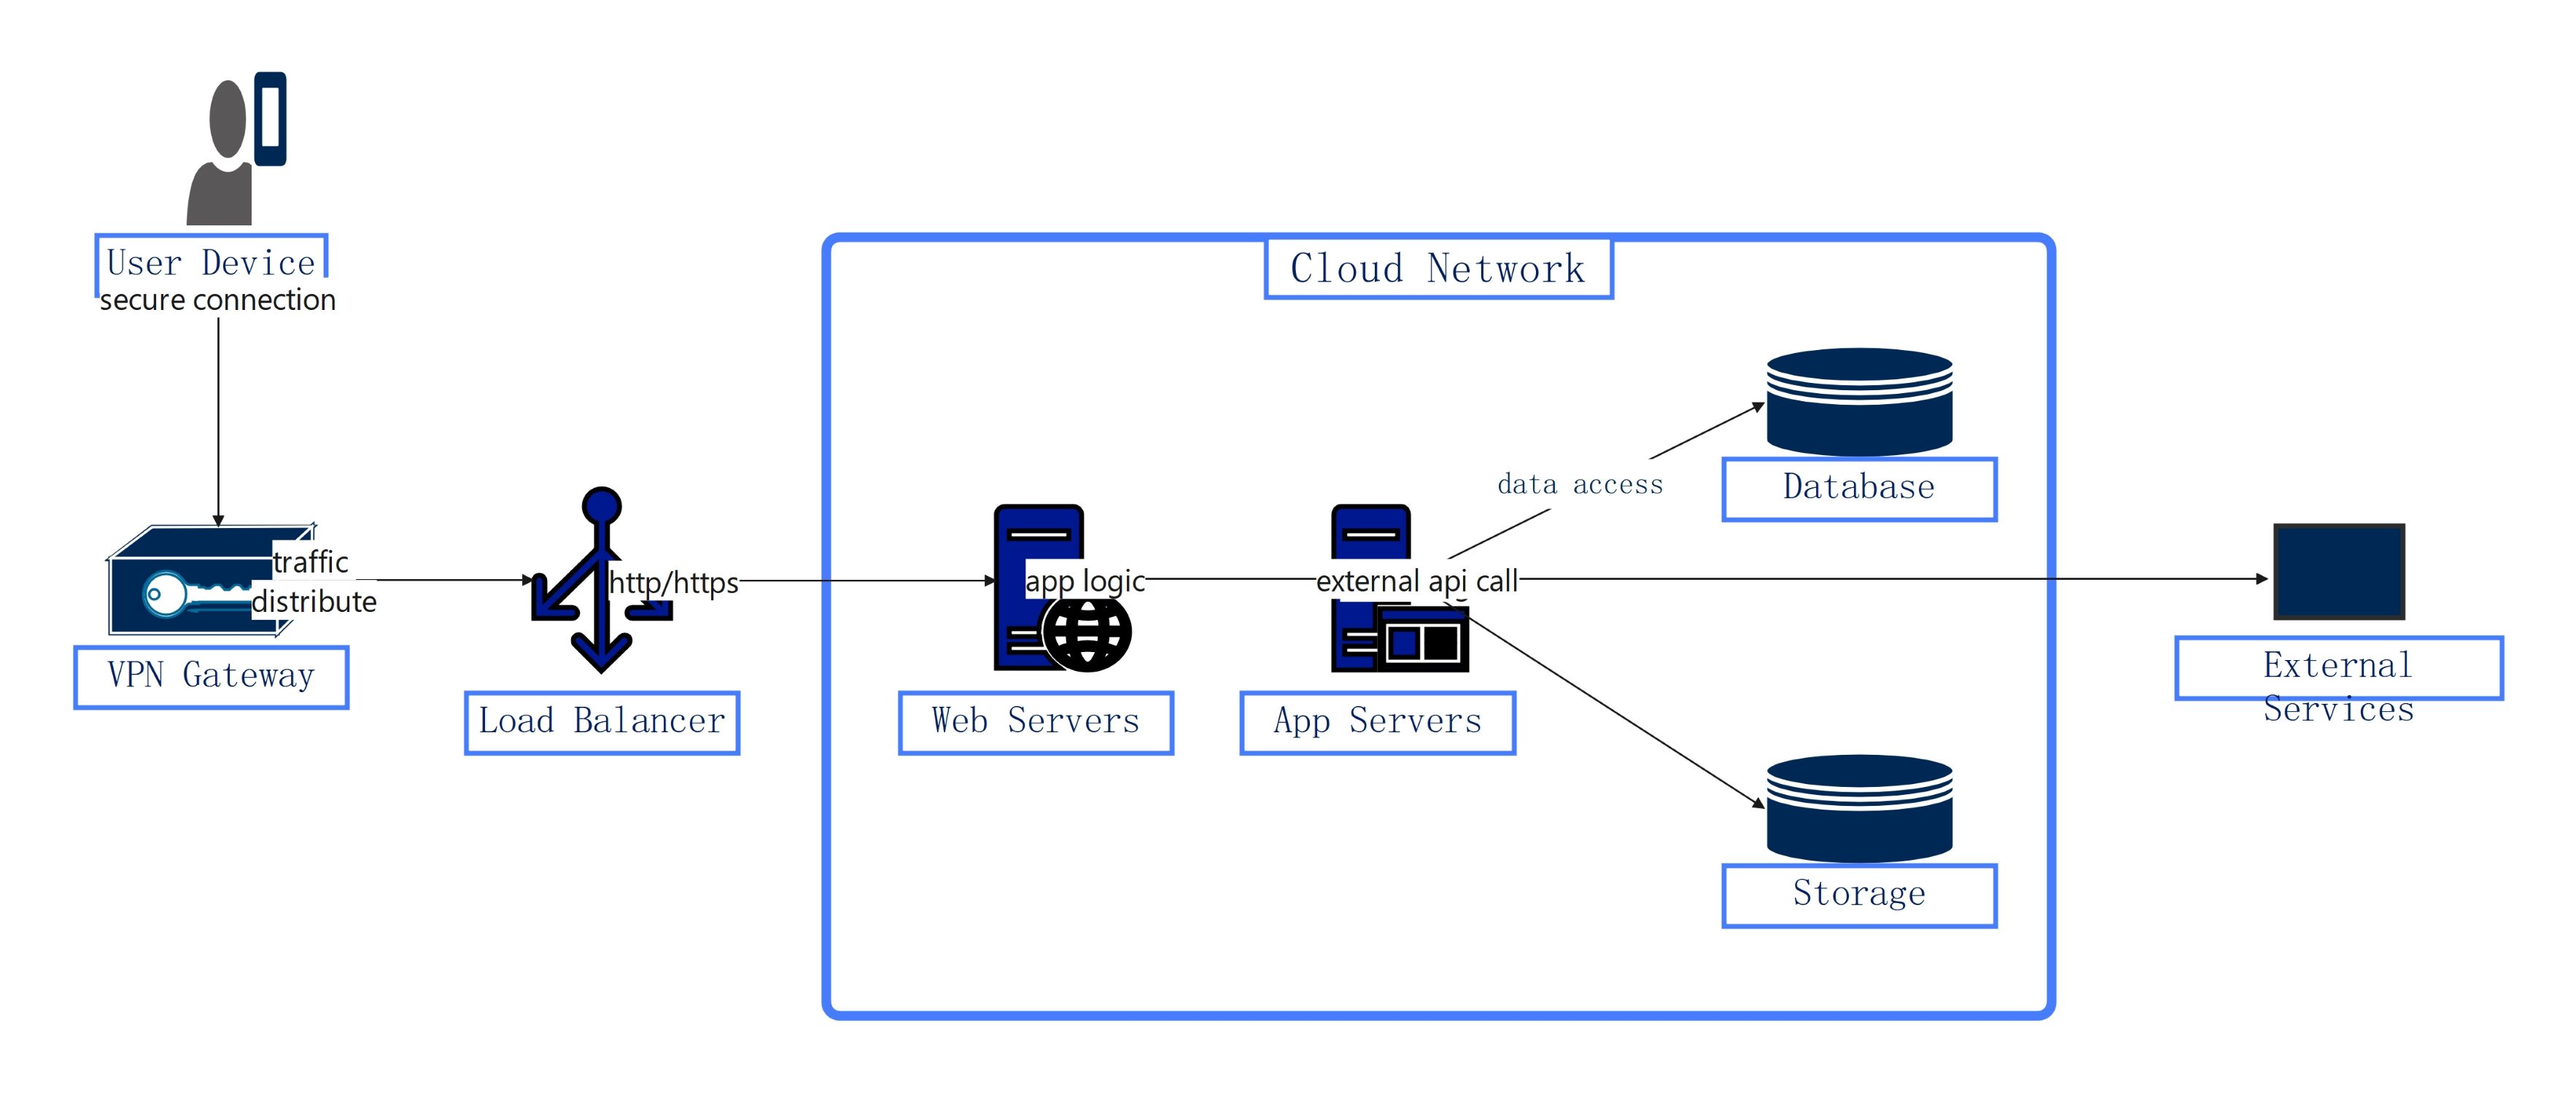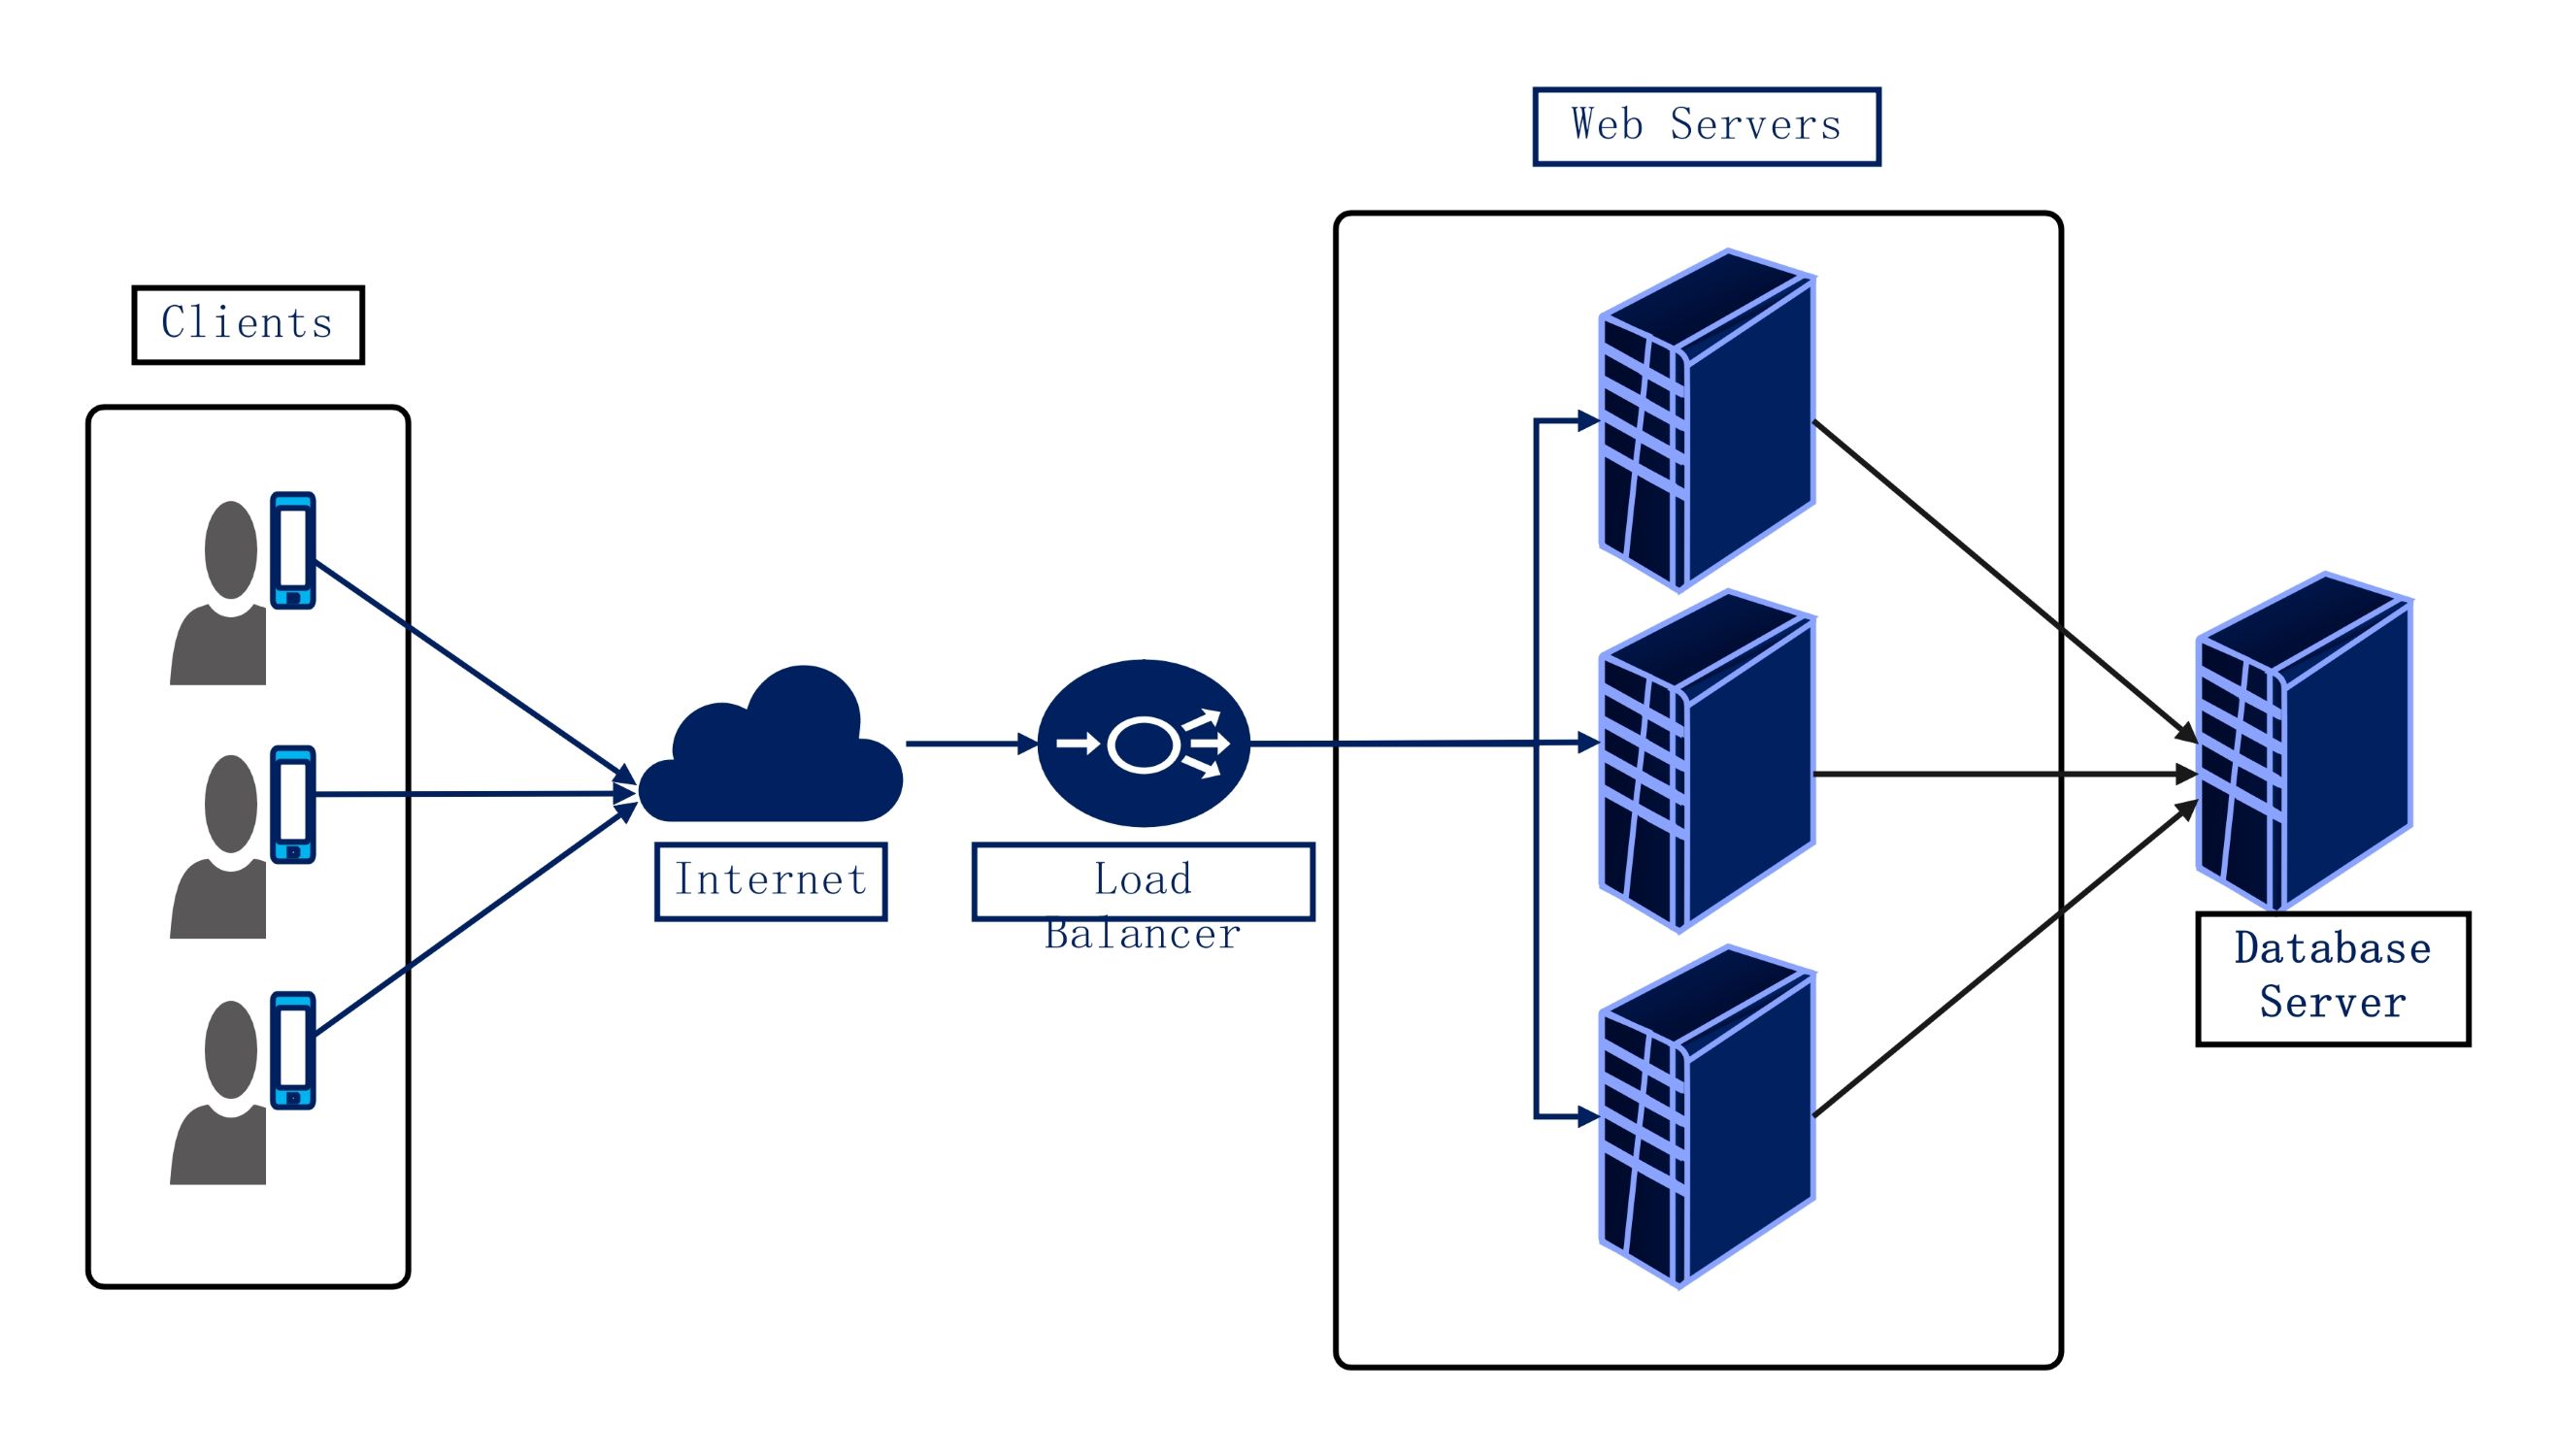
About this network diagram for load balancer template
This template provides a clear visual map of a standard load balancing setup. It demonstrates the path from the end-user to the backend database. Use this diagram to document your infrastructure or plan new system updates for better performance.
Clients and Internet Connectivity
This section represents the initial point of contact where users access your service through various devices. Requests travel from individual clients across the public internet before reaching your network's entry point for further processing and distribution.
- Multiple user devices
- Public internet gateway
- Request initiation flow
The Load Balancer Role
The load balancer acts as a traffic cop sitting in front of your servers. It receives incoming requests and routes them to the most available web server based on specific algorithms to ensure optimal resource utilization.
- Traffic distribution node
- Health checking capability
- High availability management
Backend Servers and Database
This segment shows the cluster of web servers that handle application logic. These servers process requests and communicate with a central database server to retrieve or store information, completing the user's initial request cycle efficiently.
- Web server redundancy
- Scalable server pool
- Centralized database server
FAQs about this Template
-
What is the main purpose of a network diagram for a load balancer?
The primary goal of this diagram is to visualize the distribution of network traffic across several servers. It helps engineers identify potential single points of failure and plan for horizontal scaling. By mapping out the flow from clients to the database, teams can optimize performance and ensure that no single server is overwhelmed by too many requests at once.
-
How does a load balancer improve application reliability in this setup?
A load balancer improves reliability by constantly monitoring the health of backend web servers. If one server fails or becomes unresponsive, the load balancer automatically redirects traffic to the remaining healthy servers. This process happens in real-time, preventing service downtime for users. It ensures that the application remains accessible even during hardware failures or scheduled maintenance windows on individual servers.
-
Can I use this template for both local and cloud-based networks?
Yes, this template is versatile enough for both on-premises and cloud-based infrastructures. Whether you are using physical hardware in a data center or virtual instances in the cloud, the core logic remains the same. You can customize the server icons and labels to match your specific environment, making it a valuable tool for documenting hybrid or multi-cloud network architectures.