Six Sigma is a data-driven methodology that seeks to increase productivity, decrease errors, and improve procedures. The development of a process map, which enables teams to precisely see and analyze present workflows, is essential to its success. We'll examine how to create a Six Sigma process map in this blog, with an emphasis on transportation processes. We will also present EdrawMax, a process-simplifying, multipurpose diagramming tool.
In this article

1. Understanding the Process
You should have a clear understanding of the process you want to improve before starting to create a process map. A comprehensive understanding of the process's functioning is necessary for any task, be it manufacturing, service-oriented, or anything in between.
Determining Inputs and Outputs
Identifying the inputs and outputs is the first stage in making a process map. An input is the information, resources, or raw materials that are used in a process, whereas an output is the outcome. Determining these components is essential to comprehend the limits of the procedure and its influence on the company. This phase of Six Sigma is crucial for guaranteeing that the process is precisely described.
Identifying Transportation
Any process map must include transportation since it shows how people, resources, and information are moved from one step to the next. Excessive transportation can occasionally result in inefficiencies, added expenses, and delays. Finding and displaying transportation in your process map will assist you in determining which areas might benefit from optimization.
Mapping the As-Is Process
The current state of the process is depicted in the as-is process map. It acts as a benchmark to pinpoint regions in need of development. It is essential to document every stage of the process, which includes decision points, steps, and inputs and outputs while developing a Six Sigma as-is process map.
Capturing Pain Points
The parts of your process that cause you discomfort and require improvement are called pain points. Bottlenecks, repetitive work, protracted handoffs, and quality problems are a few examples. Finding the problems is a major area of emphasis for Six Sigma since it helps define the improvements that are needed and, eventually, helps the project reach its goals.
Ensuring Map Accuracy
You have to ensure accuracy to create a functional process map. This means that the process should be accurately depicted on the map, and it should be supported by facts and observations. Work together with team members who possess process expertise to confirm the accuracy of the map. Misguided improvements and resource waste might result from any inaccuracy.
2. How EdrawMax Can Help
EdrawMax is a flexible and easy-to-use diagramming tool that can significantly speed up the Six Sigma process map design process. It is a great option for experts and businesses using Six Sigma approaches because it provides a variety of features designed to specifically address the requirements of process mapping.
The following are the main advantages of process mapping with EdrawMax:
- User-Friendly Interface: Both novice and expert users may easily and rapidly generate process maps with EdrawMax thanks to its user-friendly interface.
- Collaboration Tools: Team members can work on process maps together in real time with EdrawMax's real-time collaboration features, regardless of where they are in the world.
- Huge Symbol Library: The app comes with a vast collection of shapes and symbols made especially for process mapping, so your diagrams will be accurate and eye-catching.
- Customization: To ensure a consistent look and feel, you can modify the colors, typefaces, and styles of your process maps to meet the unique requirements of your company.
- Export Options: EdrawMax allows you to quickly share process maps with others.
Steps to Create a Six Sigma Process Map with EdrawMax
Step 1: Launch EdrawMax
Open the EdrawMax application on your computer, and log in or sign up.

Step 2: Gather Data
Collect relevant data about the process, such as inputs, outputs, and key performance metrics.
Step 3: Start a new project
In the EdrawMax interface, click on "New" to start a new project. Then, select "Basic" from the categories on the left.
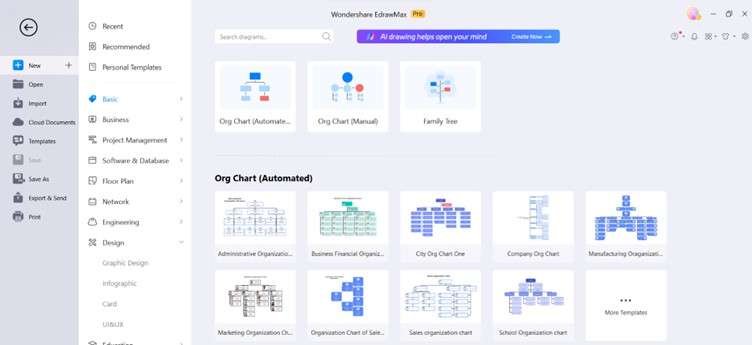
Step 4: Go to Basic Diagra
Click the [+] symbol to start from scratch, or select a circular diagram template to modify. To alter your circle diagram, you can select symbols and elements from libraries located on the left menu.

Or,
Start with a blank drawing and select the symbols to create the matrix forms in the library, which is located to the canvas's left.
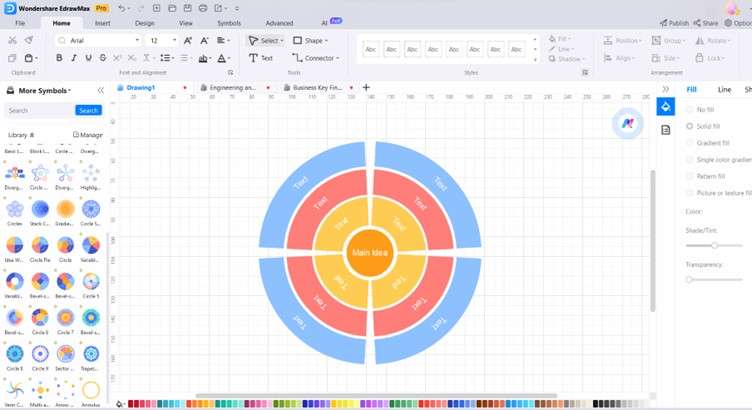
Step 5: Define Inputs and Outputs
For each step in the process, begin by dragging and dropping the appropriate symbols onto the canvas.
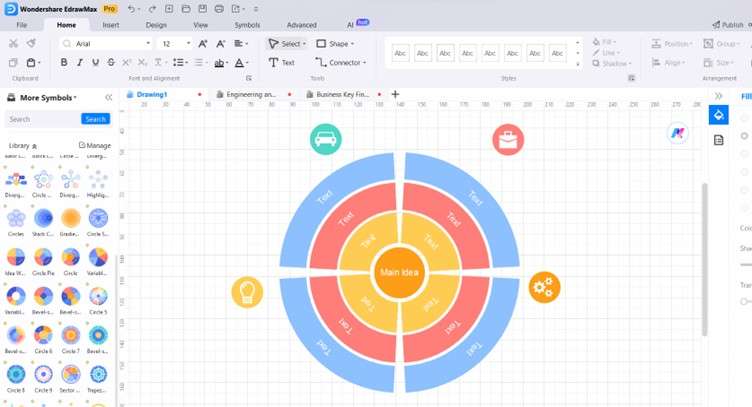
Step 6: Map Pain Points
Indicate bottlenecks, delays, mistakes, and any other process problems that have an impact on efficiency by adding a label or text. They're commonly called "pain points."
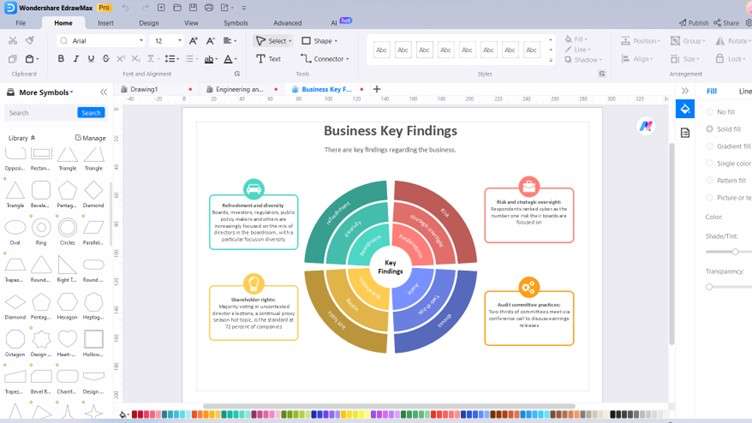
Step 7: Check Map Accuracy
Be sure that the process map you have created properly depicts the process as it is right now. Make any required changes or improvements.
Step 8: Color and Styling:
Customize the appearance of your DFD by selecting symbols, lines, or shapes and changing their color, line style, or font style.
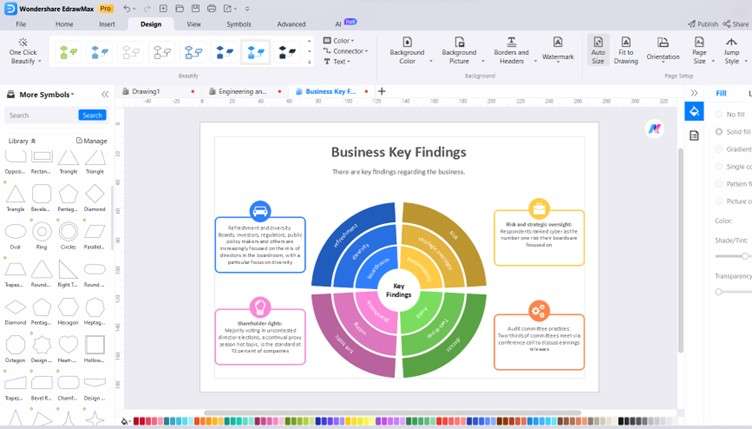
Step 9: Save and export
Once you are satisfied with your Six Sigma diagram, save your work. You can save it in various formats and share it with others

Conclusion
Creating a process map in Six Sigma is a crucial step toward improving efficiency and reducing defects. EdrawMax simplifies this process, allowing you to create accurate diagrams that aid in visualizing and optimizing workflows. By following the ten steps outlined in this blog, you can effectively map your transportation processes and identify areas for improvement, contributing to your organization's success in achieving Six Sigma excellence.


