


Risk monitoring plays a vital role in helping organizations identify and mitigate potential risks. By adopting a proactive approach, integrating monitoring of risks into overall management processes, and using tools to create charts for creating monitoring risks, organizations can effectively monitor and manage risks. This enables them to make informed decisions, allocate resources efficiently, and protect their interests in an ever-changing business environment.
In this article
Part 1. Key Principles and Objectives of Risk Monitoring
There exist some key principles and objectives for monitoring risks. Monitoring risks, such as hedging risk, helps organizations to proactively identify and assess potential threats and vulnerabilities, allowing them to implement timely and appropriate risk mitigation strategies.
1. Proactive Approach:Continuously monitor, analyze, and evaluate potential risks such as fraud risk to identify emerging issues early.
2. Timeliness and Frequency: Regularly assess risks in a timely manner to enable immediate action if necessary.
3. Integration:Integrate monitoring of risks into overall management processes and strategies, aligning it with organizational goals.
4. Documentation: Maintain a well-documented system to accurately assess, analyze, and report risks, ensuring data is readily available. This approach is widely used in monitoring bank risk.
Part 2. Components of Risk Monitoring Framework
A framework for monitoring risks has certain components, whether it’s strategic risk or any other type of risk. These components help to monitor risks efficiently. In turn, they
also help organizations to take appropriate steps to avoid these risks.

1. Risk Identification:Systematically identify potential risks that may impact the organization, considering internal and external factors.
2. Risk Assessment:Assess the potential impact and likelihood of identified risks, for example, technology risk, and prioritize further action and mitigation.
3. Risk Measurement:Quantify risks to understand their potential impact and allocate appropriate resources for mitigation efforts.
4. Risk Reporting: Regularly report monitoring of risks for effective communication and decision-making at all levels of the organization.
Part 3. Risk Monitoring Process and Steps
Monitoring risk is a systematic approach. In order to monitor risks effectively, be it IT risk or risk of any other kind, certain steps are involved in the process. These
advanced steps assist in successfully monitoring all kinds of risks.
1. Set Risk Monitoring Objectives:Clearly define monitoring goals and objectives, including scope and purpose.
2. Identify Key Risk Indicators (KRIs):Determine specific, measurable indicators to serve as early warning signs.
3. Implement Monitoring Activities:Regularly collect data using automated tools, surveys, interviews, or other methods.
4. Analyze and Evaluate Data:Thoroughly analyze data for trends or patterns, evaluating against predetermined thresholds.
Part4. Benefits of Using Tools to Create Risk Monitoring Charts
To monitor risks like strategic risk adeptly, creating charts for monitoring risks is extremely helpful. Using a specialized tool to create a risk monitor chart is always recommended. There are a lot of advantages to doing this.
1. Visual Representation:Tools for monitoring risks create visually appealing charts for easy comprehension and effective decision-making.
2. Data Integration:These tools integrate data from multiple sources, providing a holistic view of potential risks for accurate analysis.
3. Historical Trends:These tools track historical trends, helping organizations identify patterns and recurring risks for proactive mitigation.
Part 5. Create a Risk monitoring Gantt Chart Using EdrawMax
Wondershare EdrawMax is an excellent tool for creating Gantt Charts for monitoring risks like liability risk due to its user-friendly interface and extensive range of features. Users can easily add tasks, milestones, and dependencies to their charts. The software also allows for easy customization, enabling users to add risk indicators. To create a Gantt chart for monitoring risks using the tool, follow the steps given below:
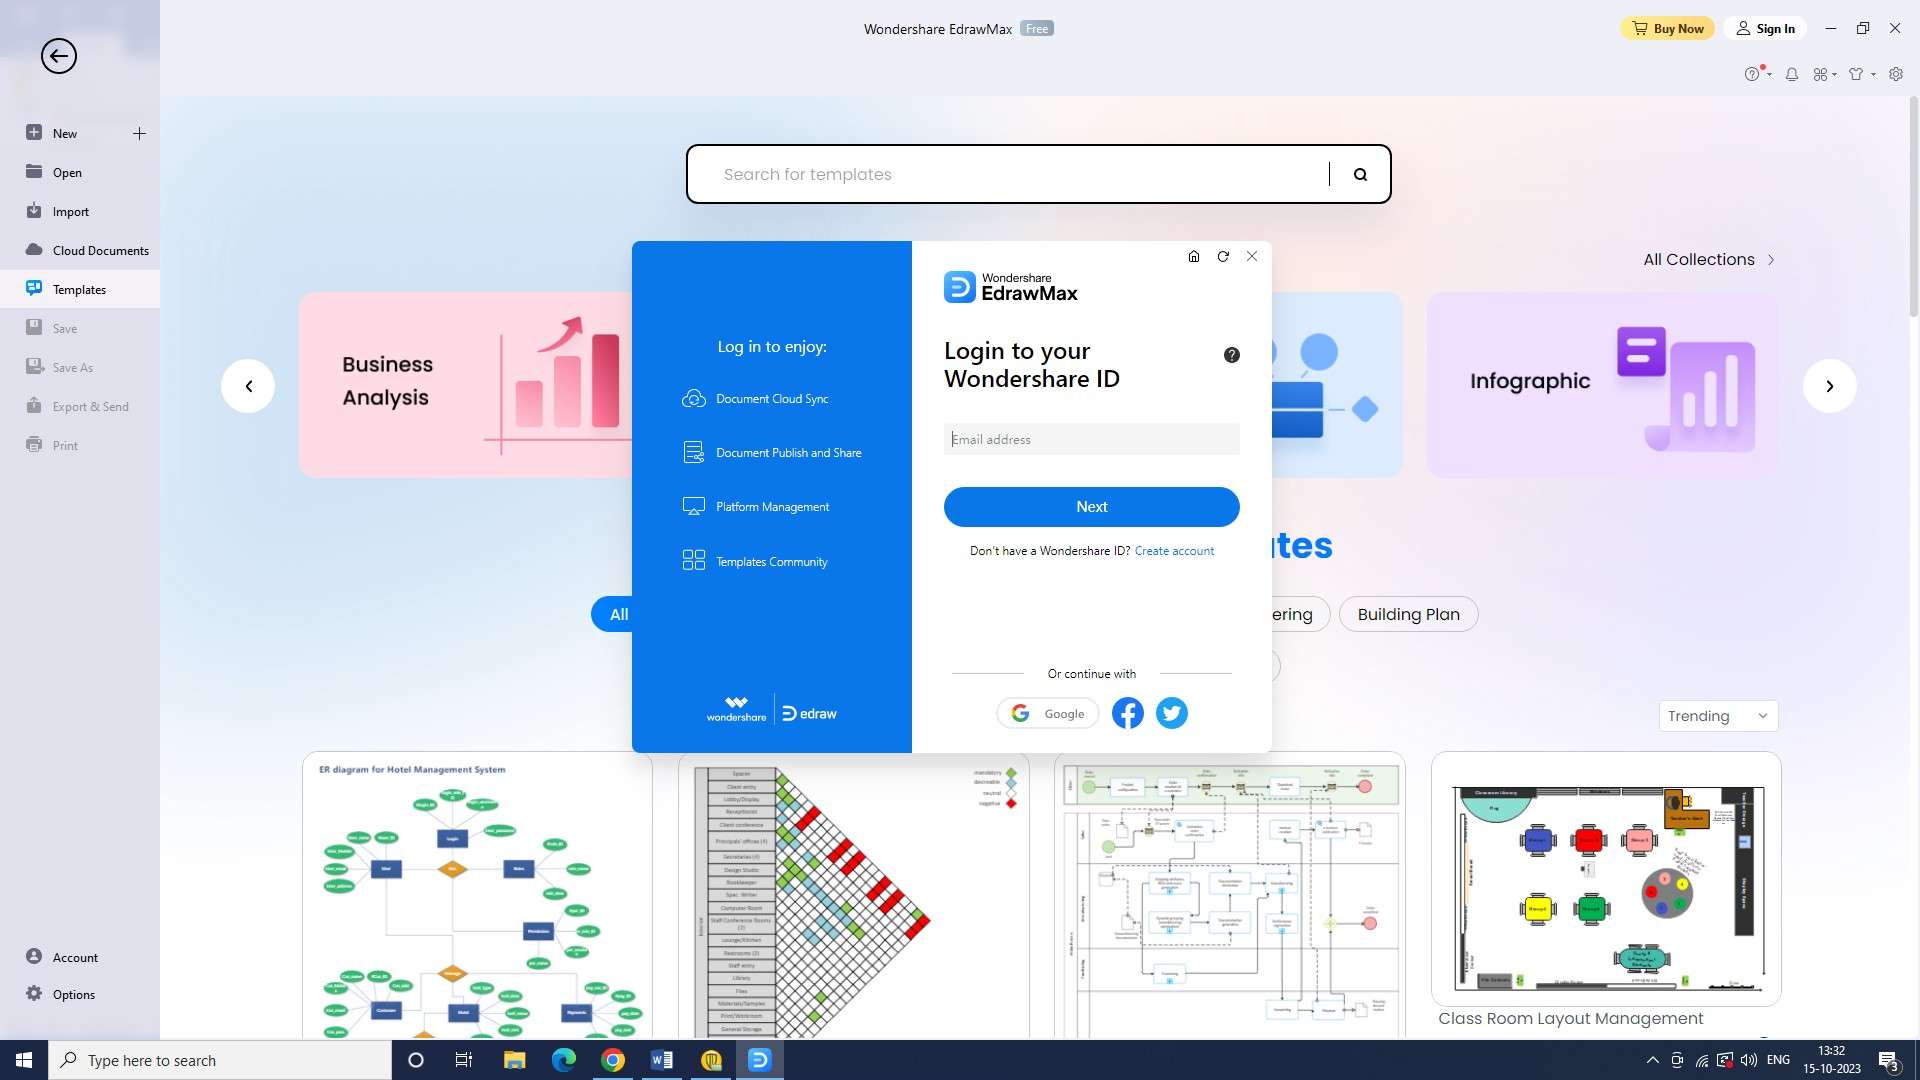
Step 1: To make your Gantt chart in Wondershare EdrawMax, first, you have to log in. You can either log in using your existing account or you can create a new account.
Step 2: Now click on the “New” button to create a new document. You will find the button on the top left corner of your screen.

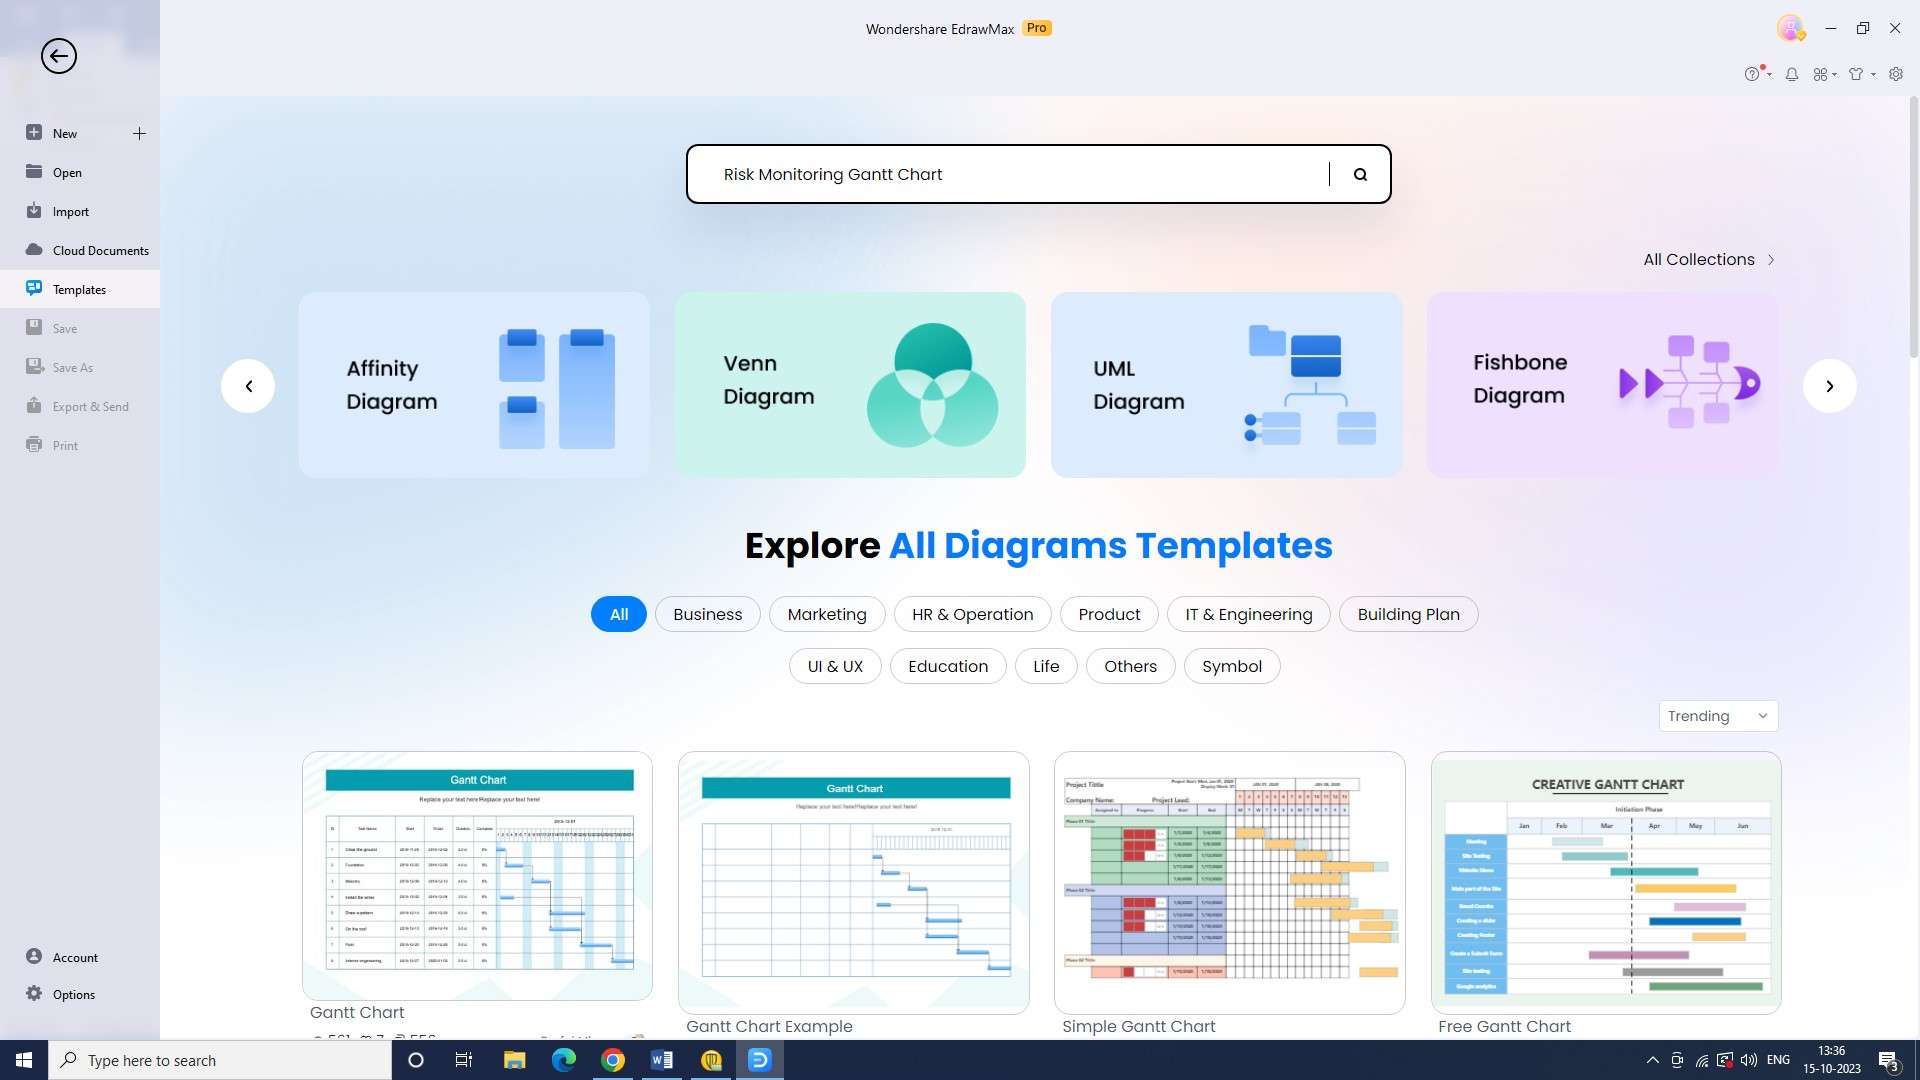
Step 3: Now go to the “Templates” section of the tool and search for a risk monitoring Gantt chart template. You will be able to find a Gantt chart template for monitoring risks from the list of templates to start creating your Gantt chart.
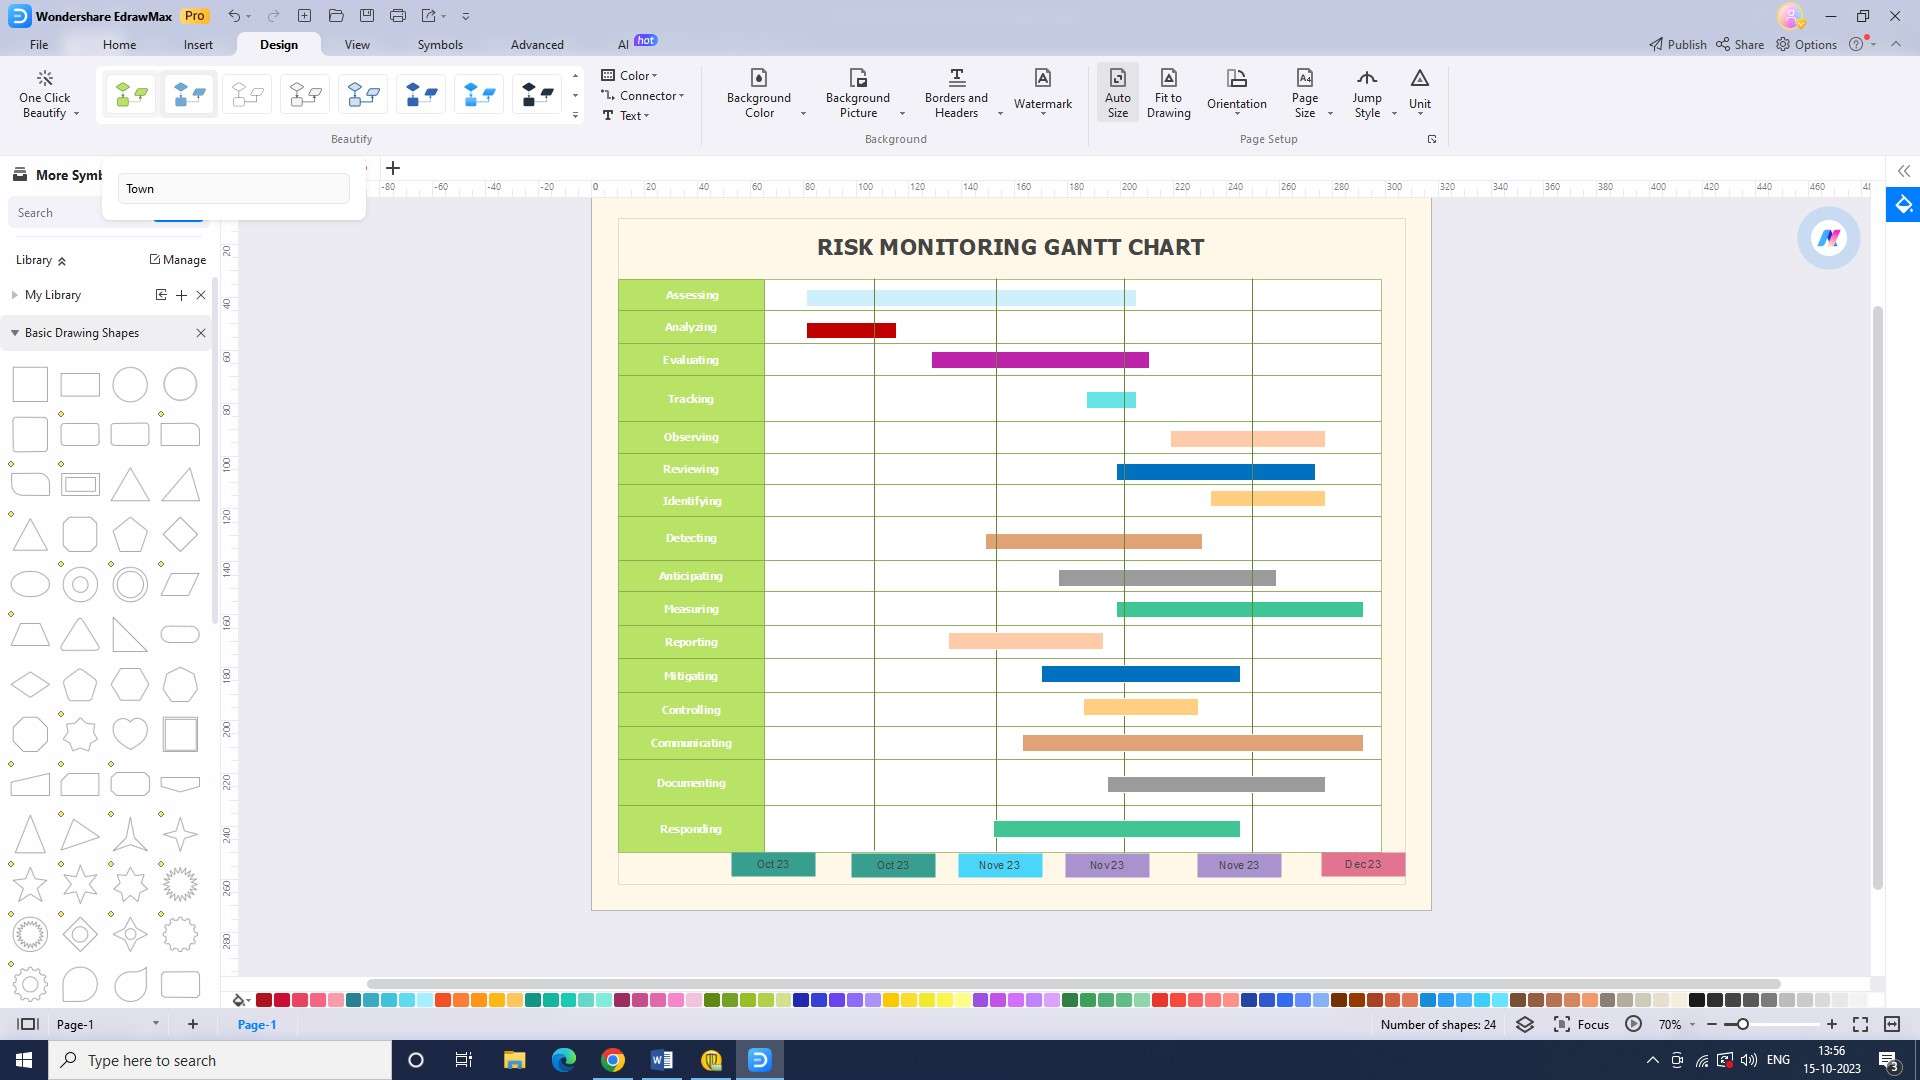
Step 4: Once the template is open, you will be able to add tasks to the Gantt chart. You can add tasks, assign resources, and add dependencies to the tasks.
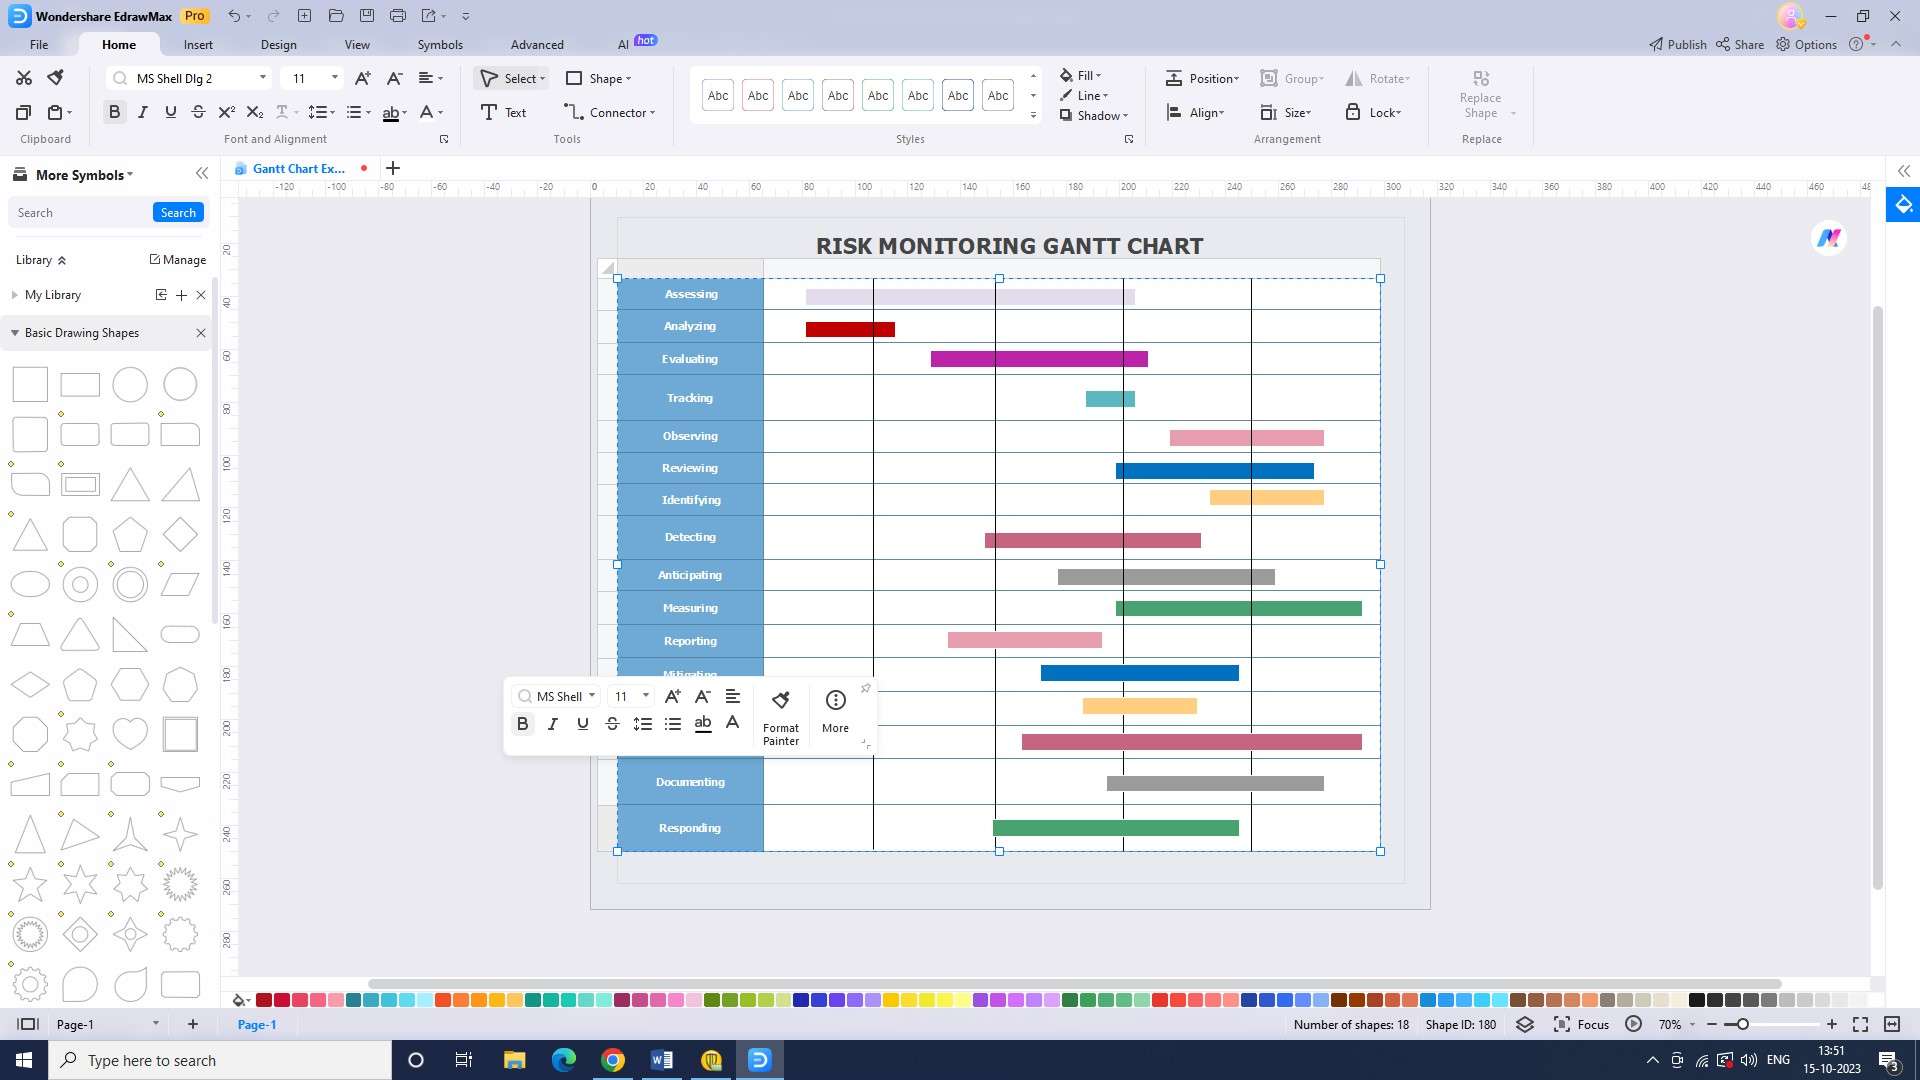
Step 5: Once all the tasks have been added to the Gantt chart, you can add dates to the tasks. This will help you visualize the timeline of the project.
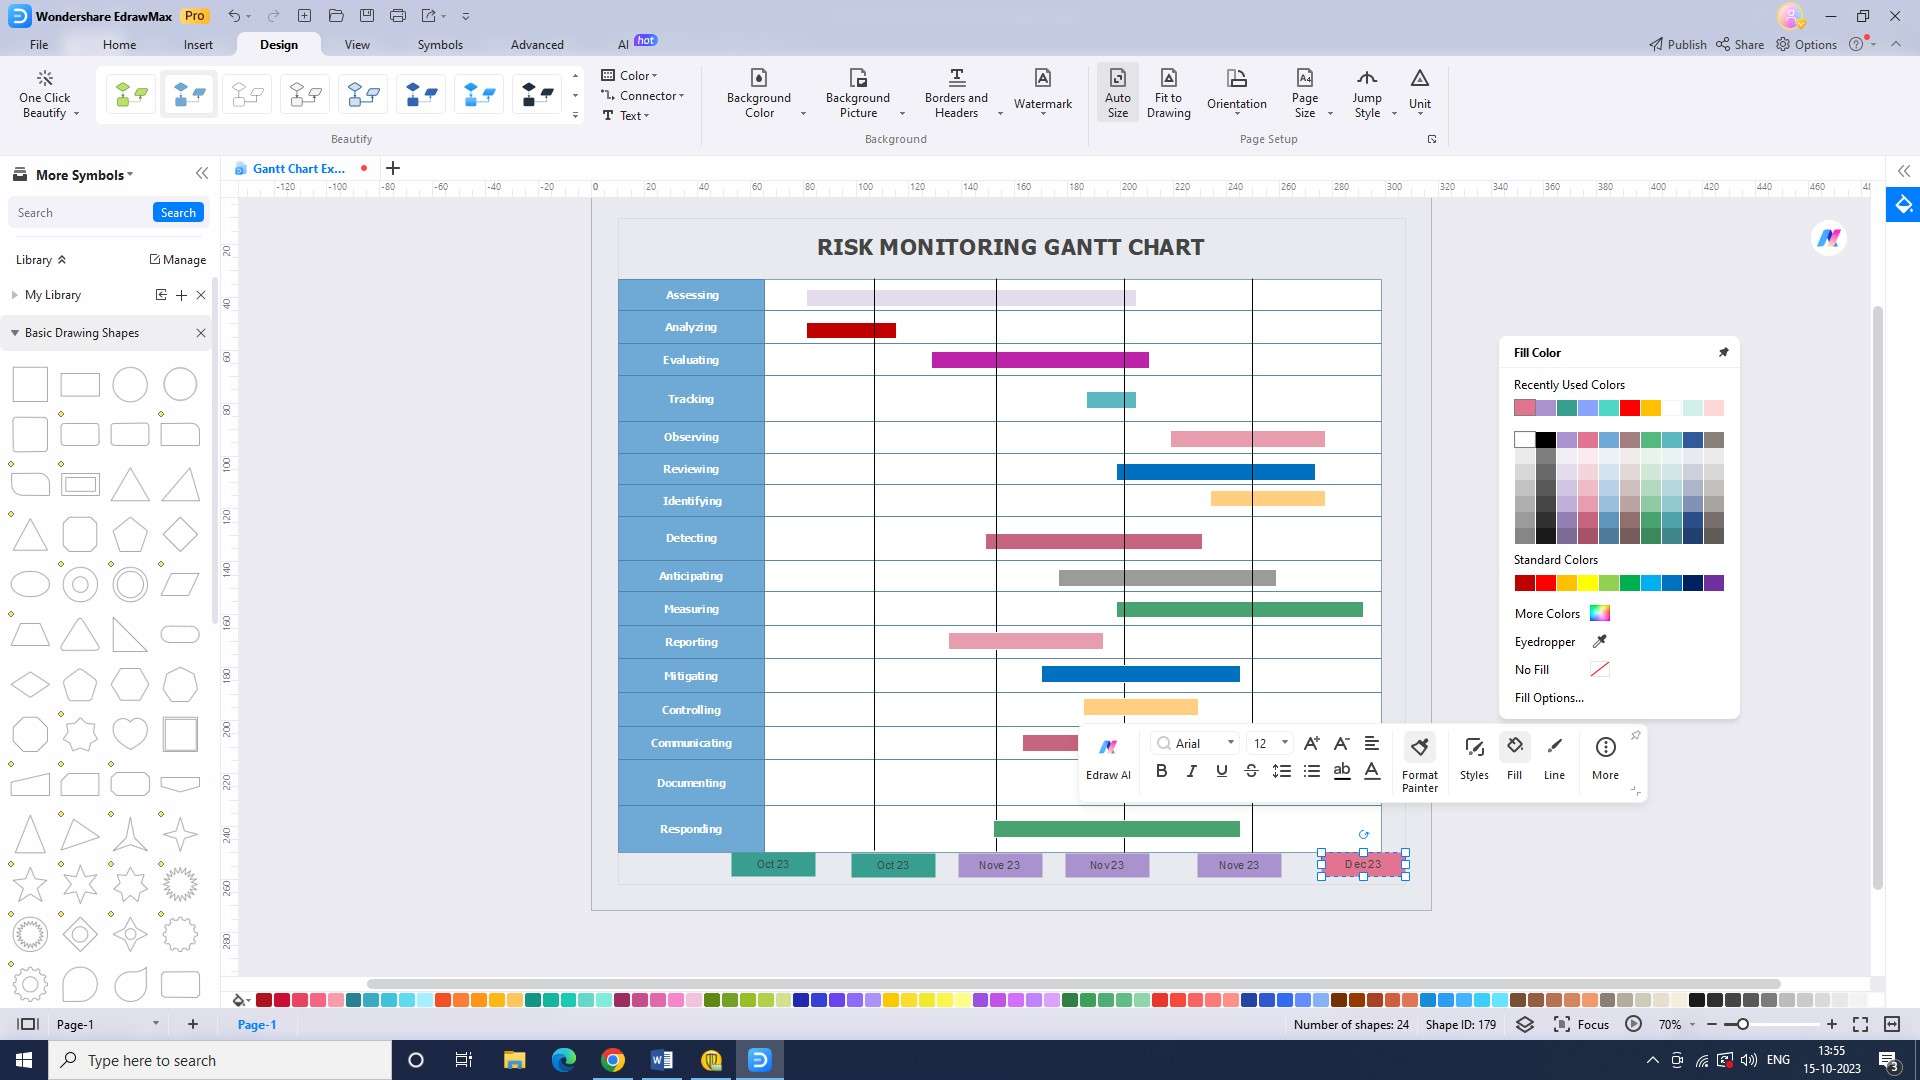
Step 6: After the dates have been added, you can customize the chart to fit your needs. You can change the colors, fonts, and other design elements to make the chart more visually appealing.
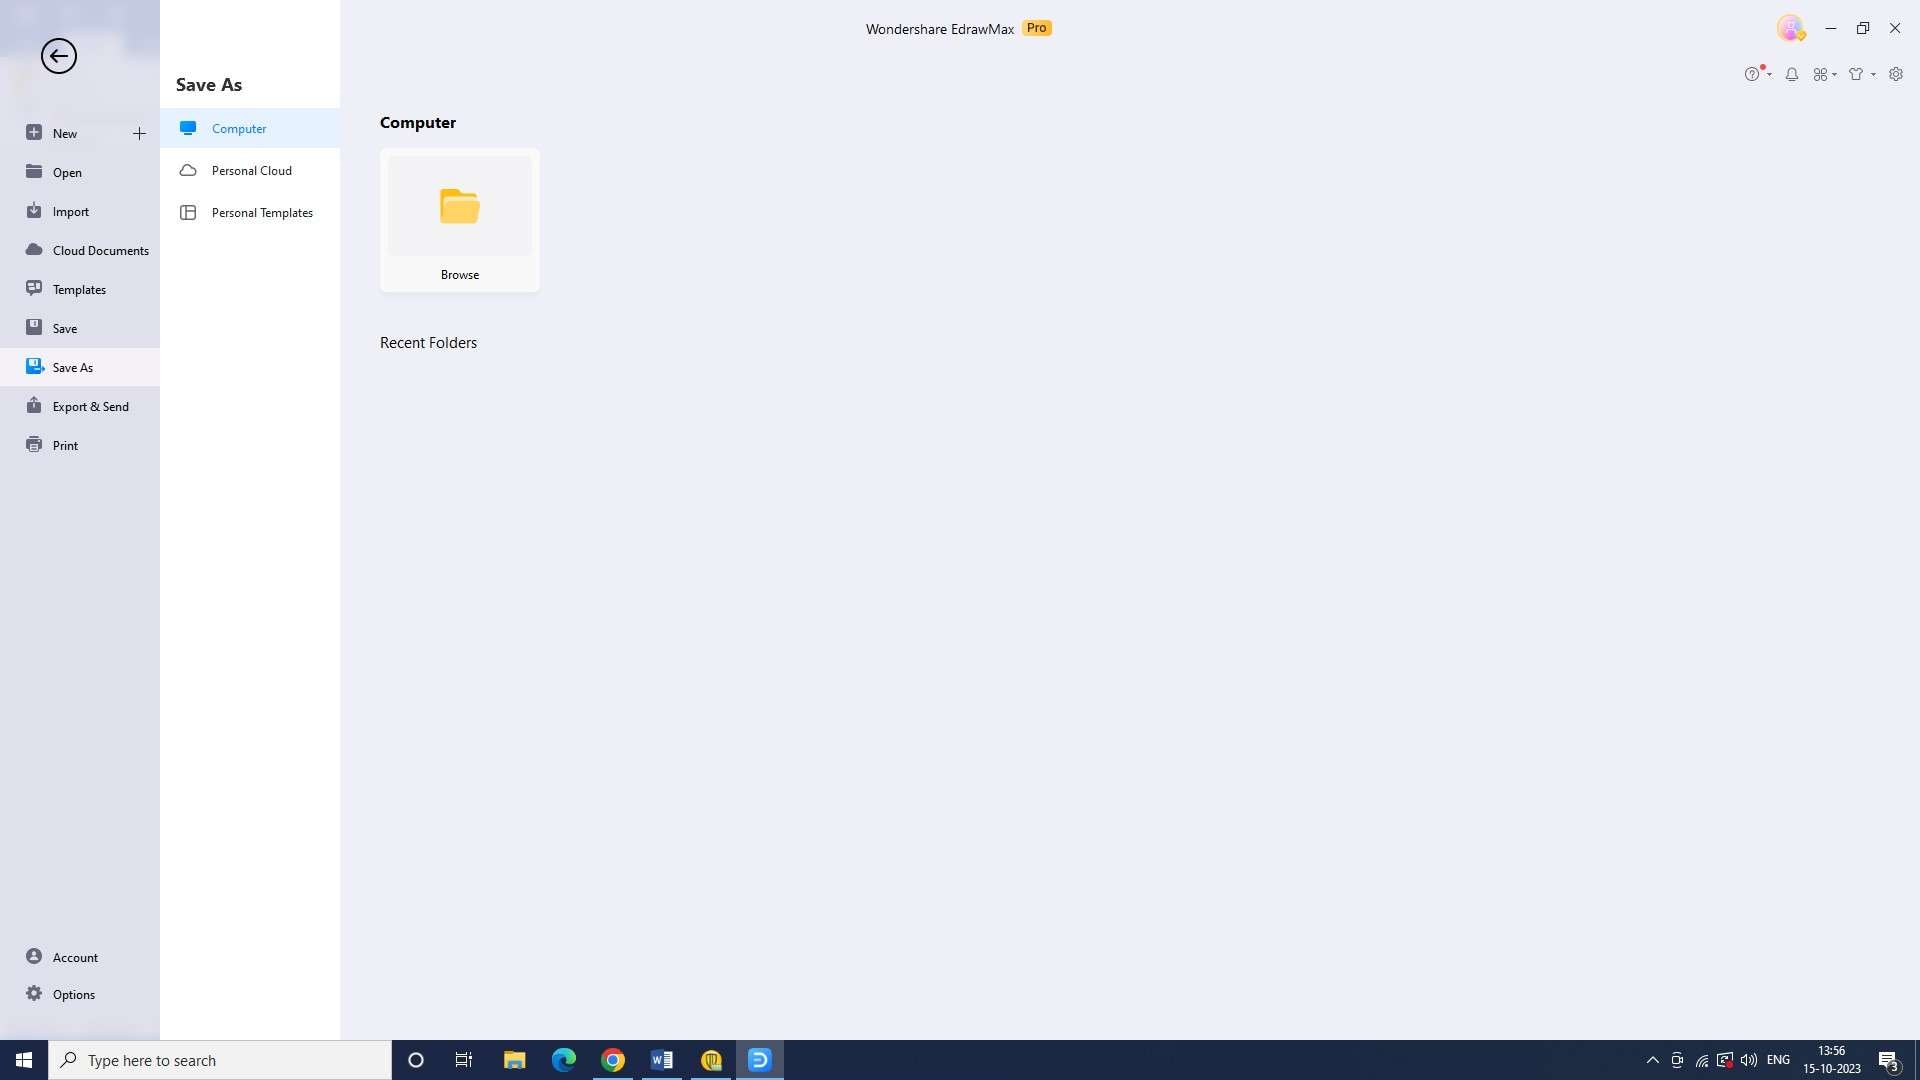
Step 7: Once you are happy with the design of the chart, you can save the chart to your account. This will allow you to access the chart whenever you need it.
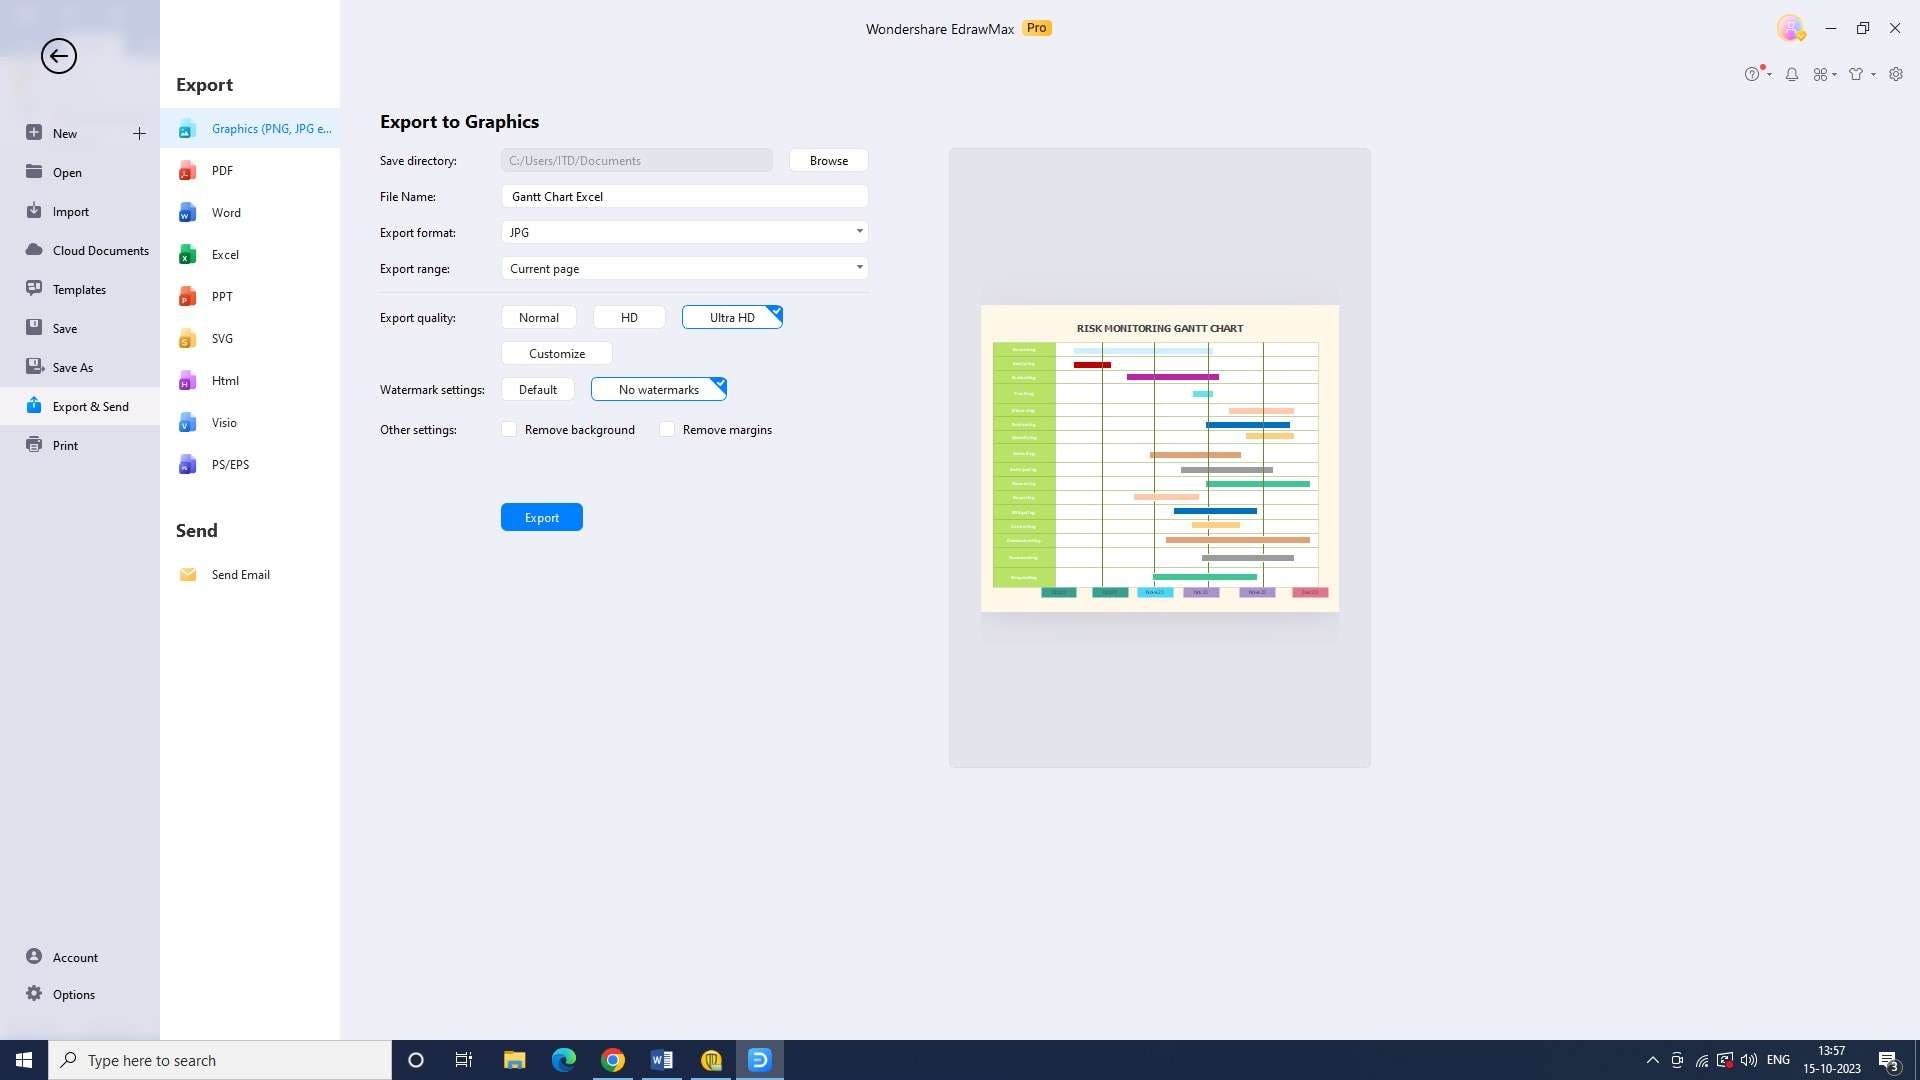
Step 8: After saving your chart you can export the chart as an image or a PDF. You can also export the chart to other applications such as PowerPoint and Excel.
Conclusion
Organizations face various risks that can impact their operations, financial stability, and reputation. Monitoring risks is a proactive approach that helps organizations identify, assess, and manage potential risks. By continuously monitoring risks, like model risk, organizations can take timely actions to mitigate their impact and protect their interests.
