
About this UML sequence diagram for client server communication template
This template provides a clear visual map of network interactions. It details how users authenticate and request information from a database. By using this layout, teams can identify potential bottlenecks and ensure that communication between different system components remains secure and efficient.
Main System Participants
This section identifies the primary actors involved in the communication cycle. The diagram features a human client, a processing server, and a backend database. Each participant plays a vital role in handling user requests and managing data.
- Client: Initiates the process by sending requests.
- Server: Acts as the middleman to process logic.
- Database: Stores and verifies sensitive information.
Authentication Sequence
Security is the first step in any client-server interaction. The client sends a request to the server, which then checks the database for valid credentials. This ensures only authorized users can access the system's sensitive data or features.
- Send authentication request to the server.
- Validate credentials with the database.
- Receive success or failure notification.
Data Query Logic
Once the user is logged in, the system handles data requests. The diagram uses alternative blocks to show different outcomes. It covers cases where data is found or missing. This logical flow helps developers prepare for various system responses.
- Send data request to the server.
- Query data from the backend database.
- Return requested data to the client.
- Send error message if data is not available.
FAQs about this Template
-
Why use a sequence diagram for client-server communication?
Sequence diagrams are essential for visualizing the order of events in a system. They show exactly when the client, server, and database interact. This clarity helps developers find bugs in the logic before writing code. It also makes it easier to explain complex processes to stakeholders. By using this tool, you can improve system reliability and overall software design.
-
What do the horizontal lines represent in this UML diagram?
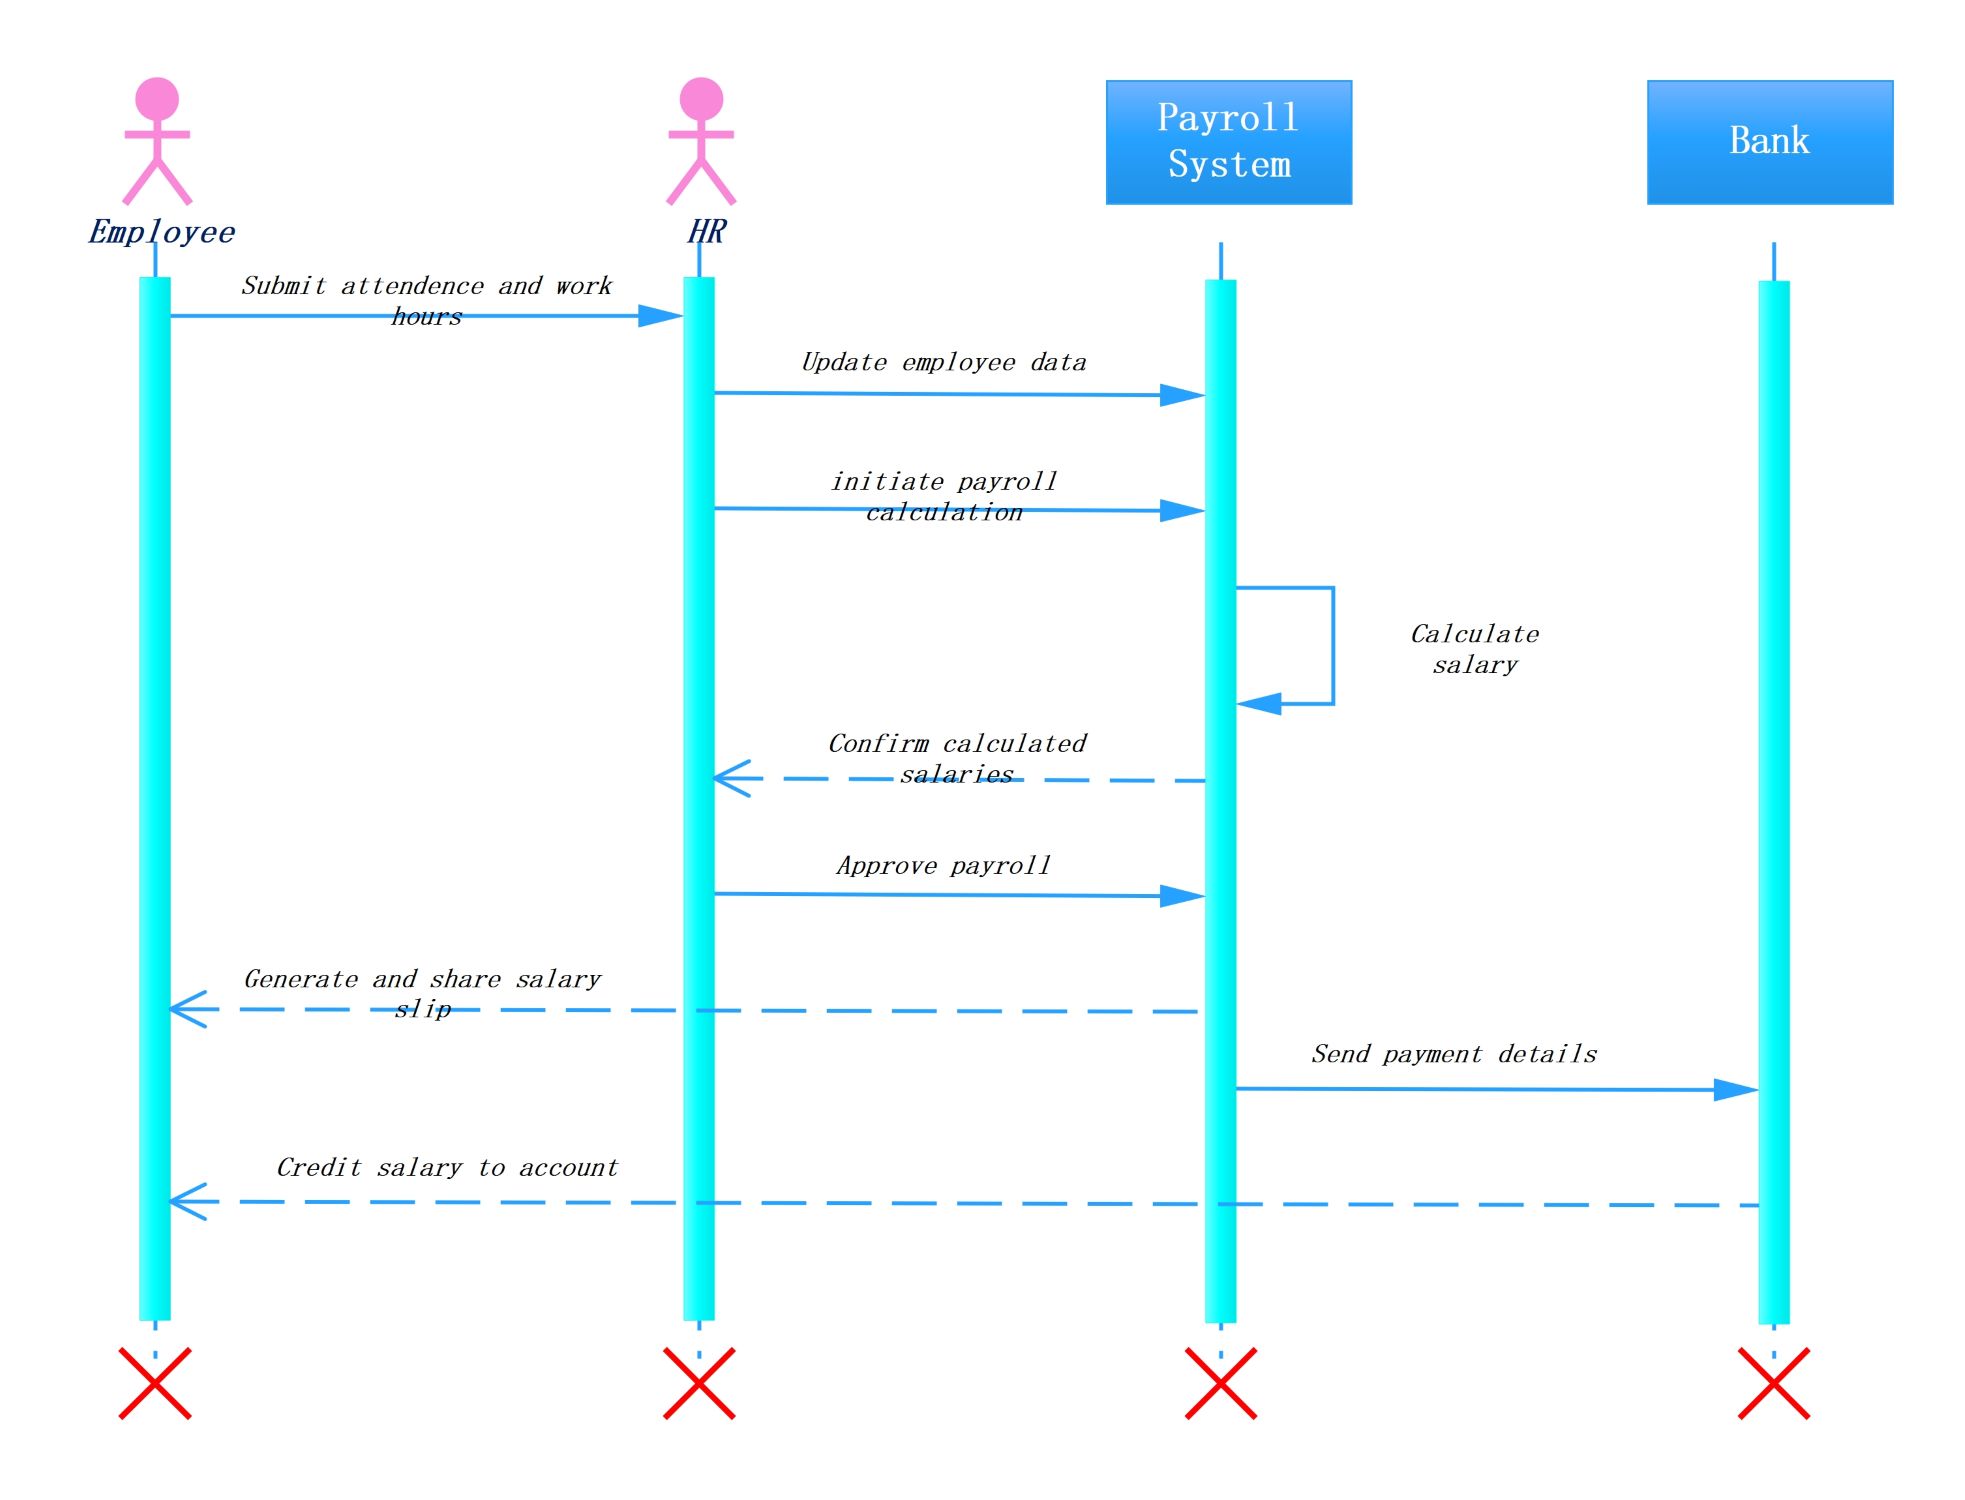
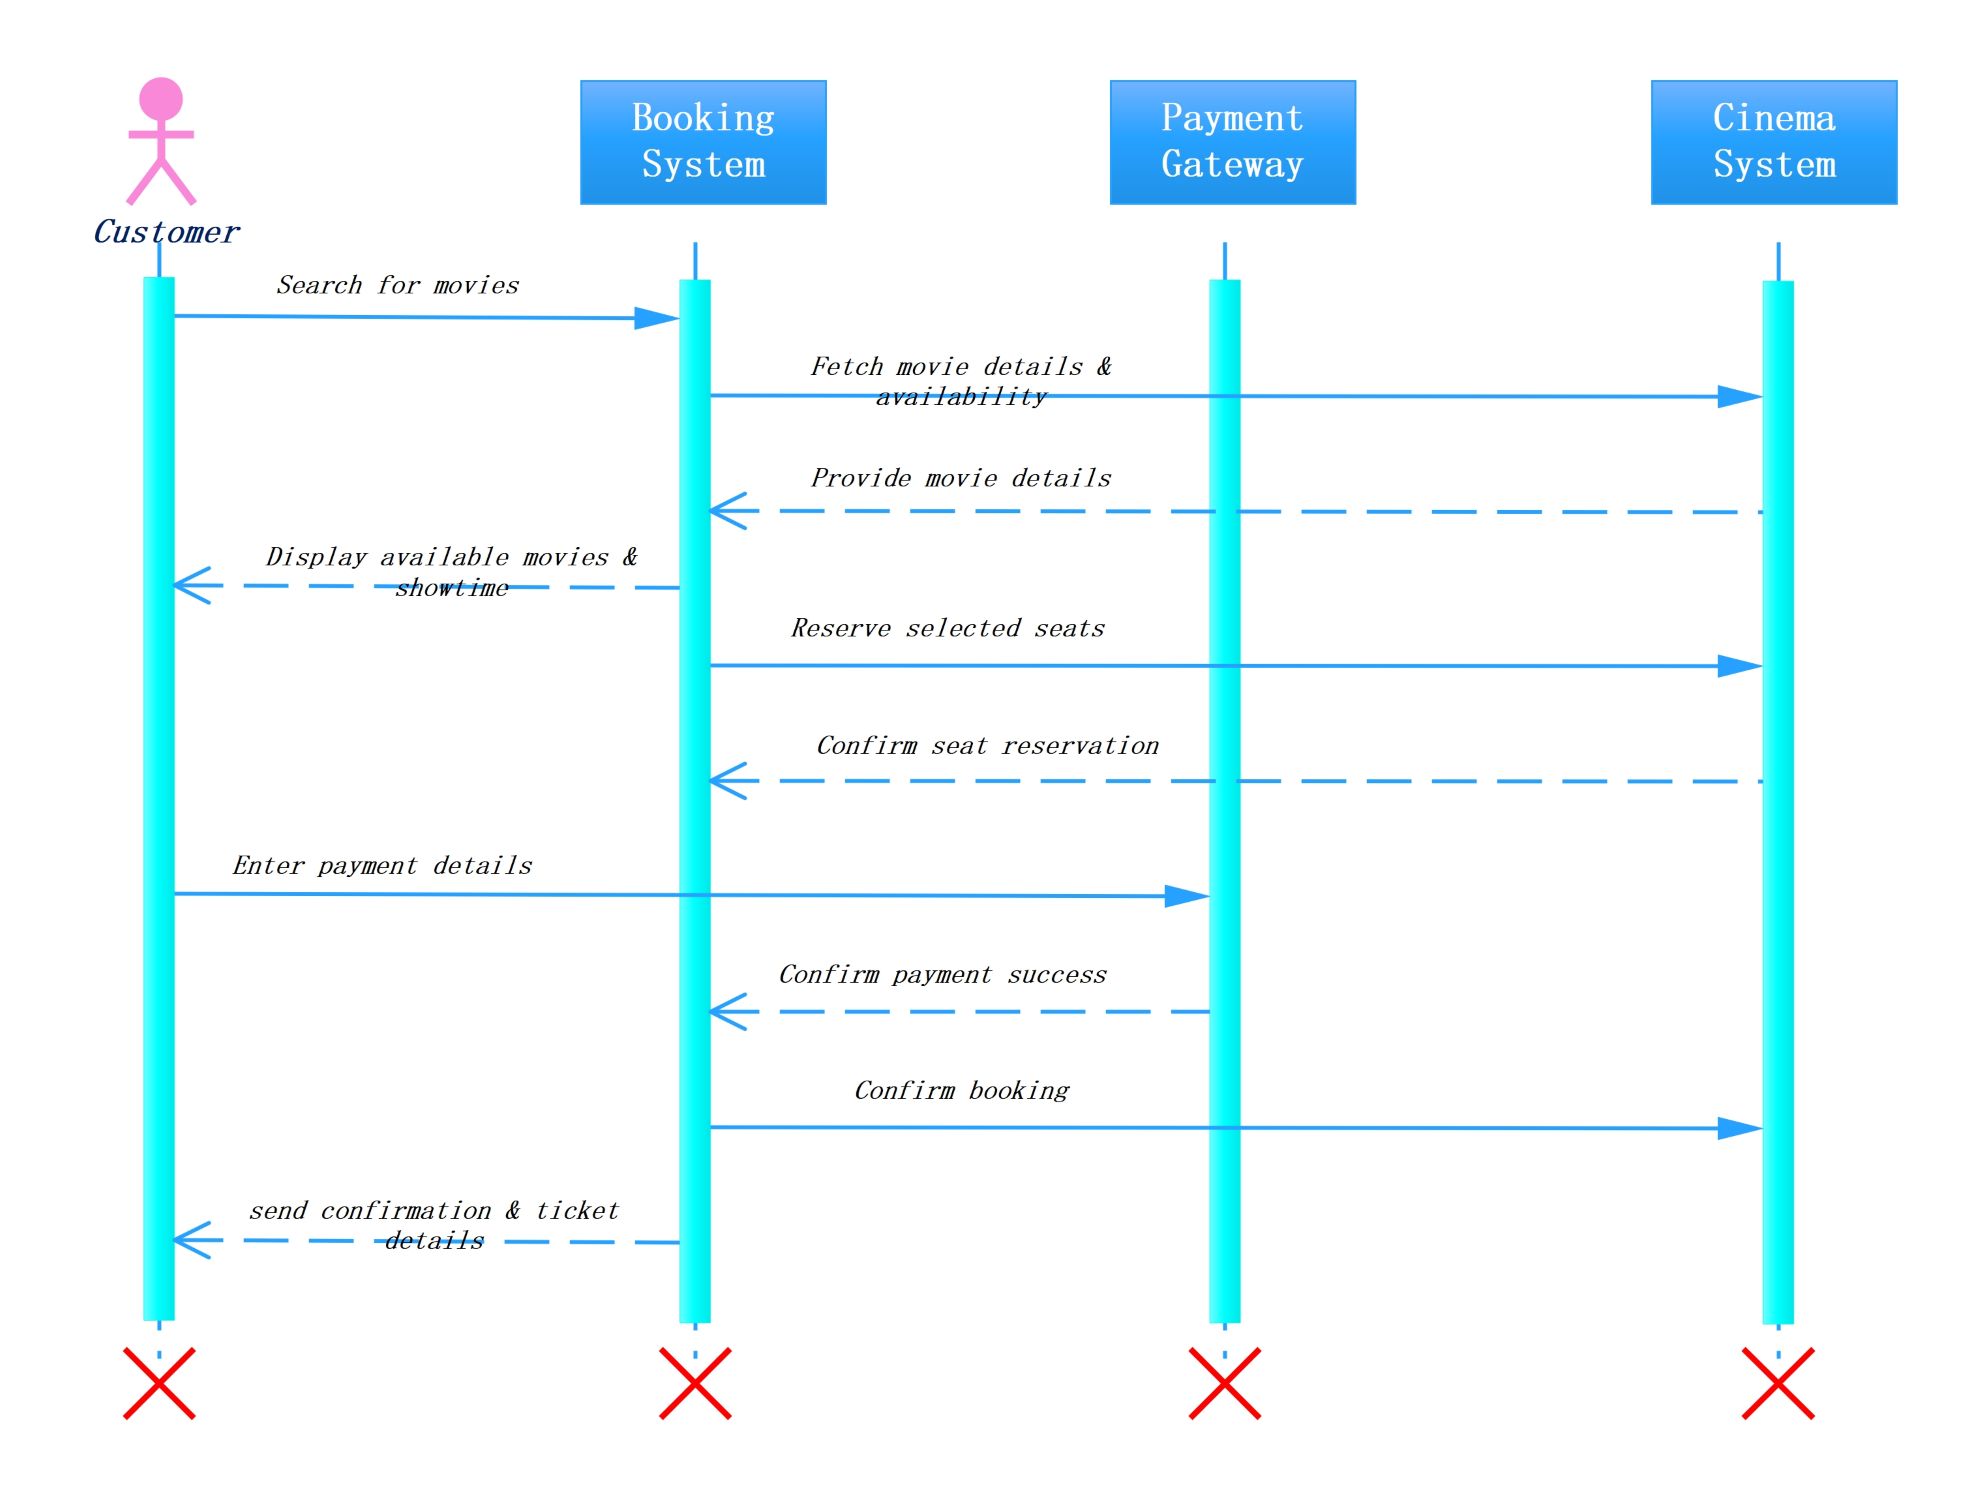
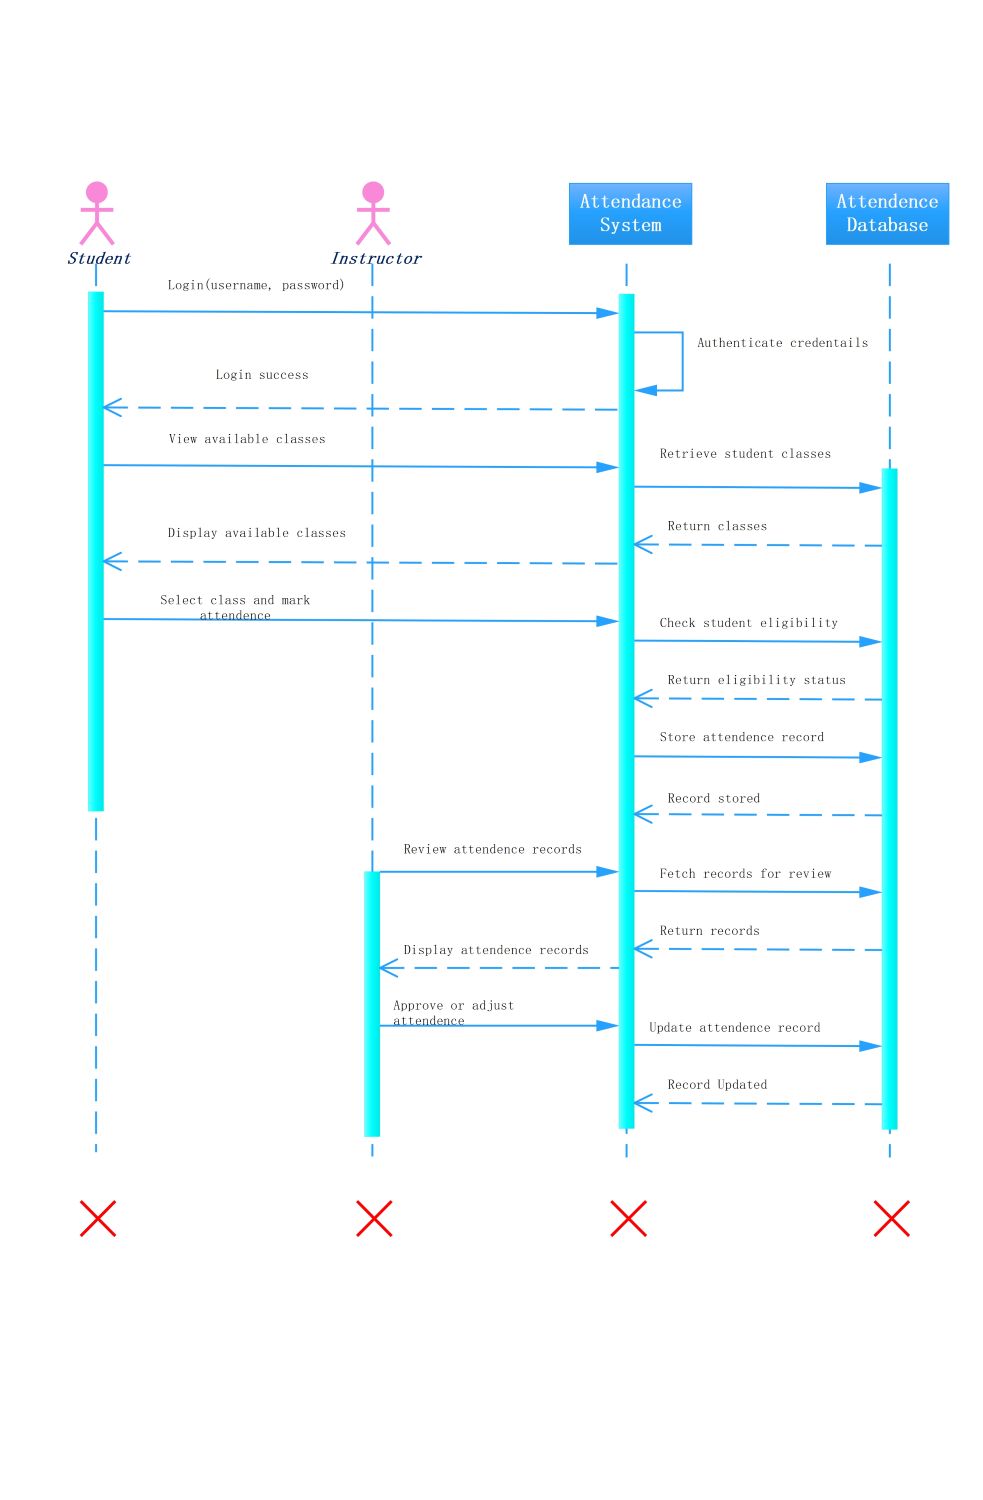
The horizontal lines represent messages passed between the different system parts. Solid lines with arrows show a call or request, while dashed lines show a return message. These arrows indicate the direction of data flow. Understanding these lines is key to reading the timing and sequence of the entire communication process between the client and the server.
-
How do alternative blocks improve the design of a sequence diagram?
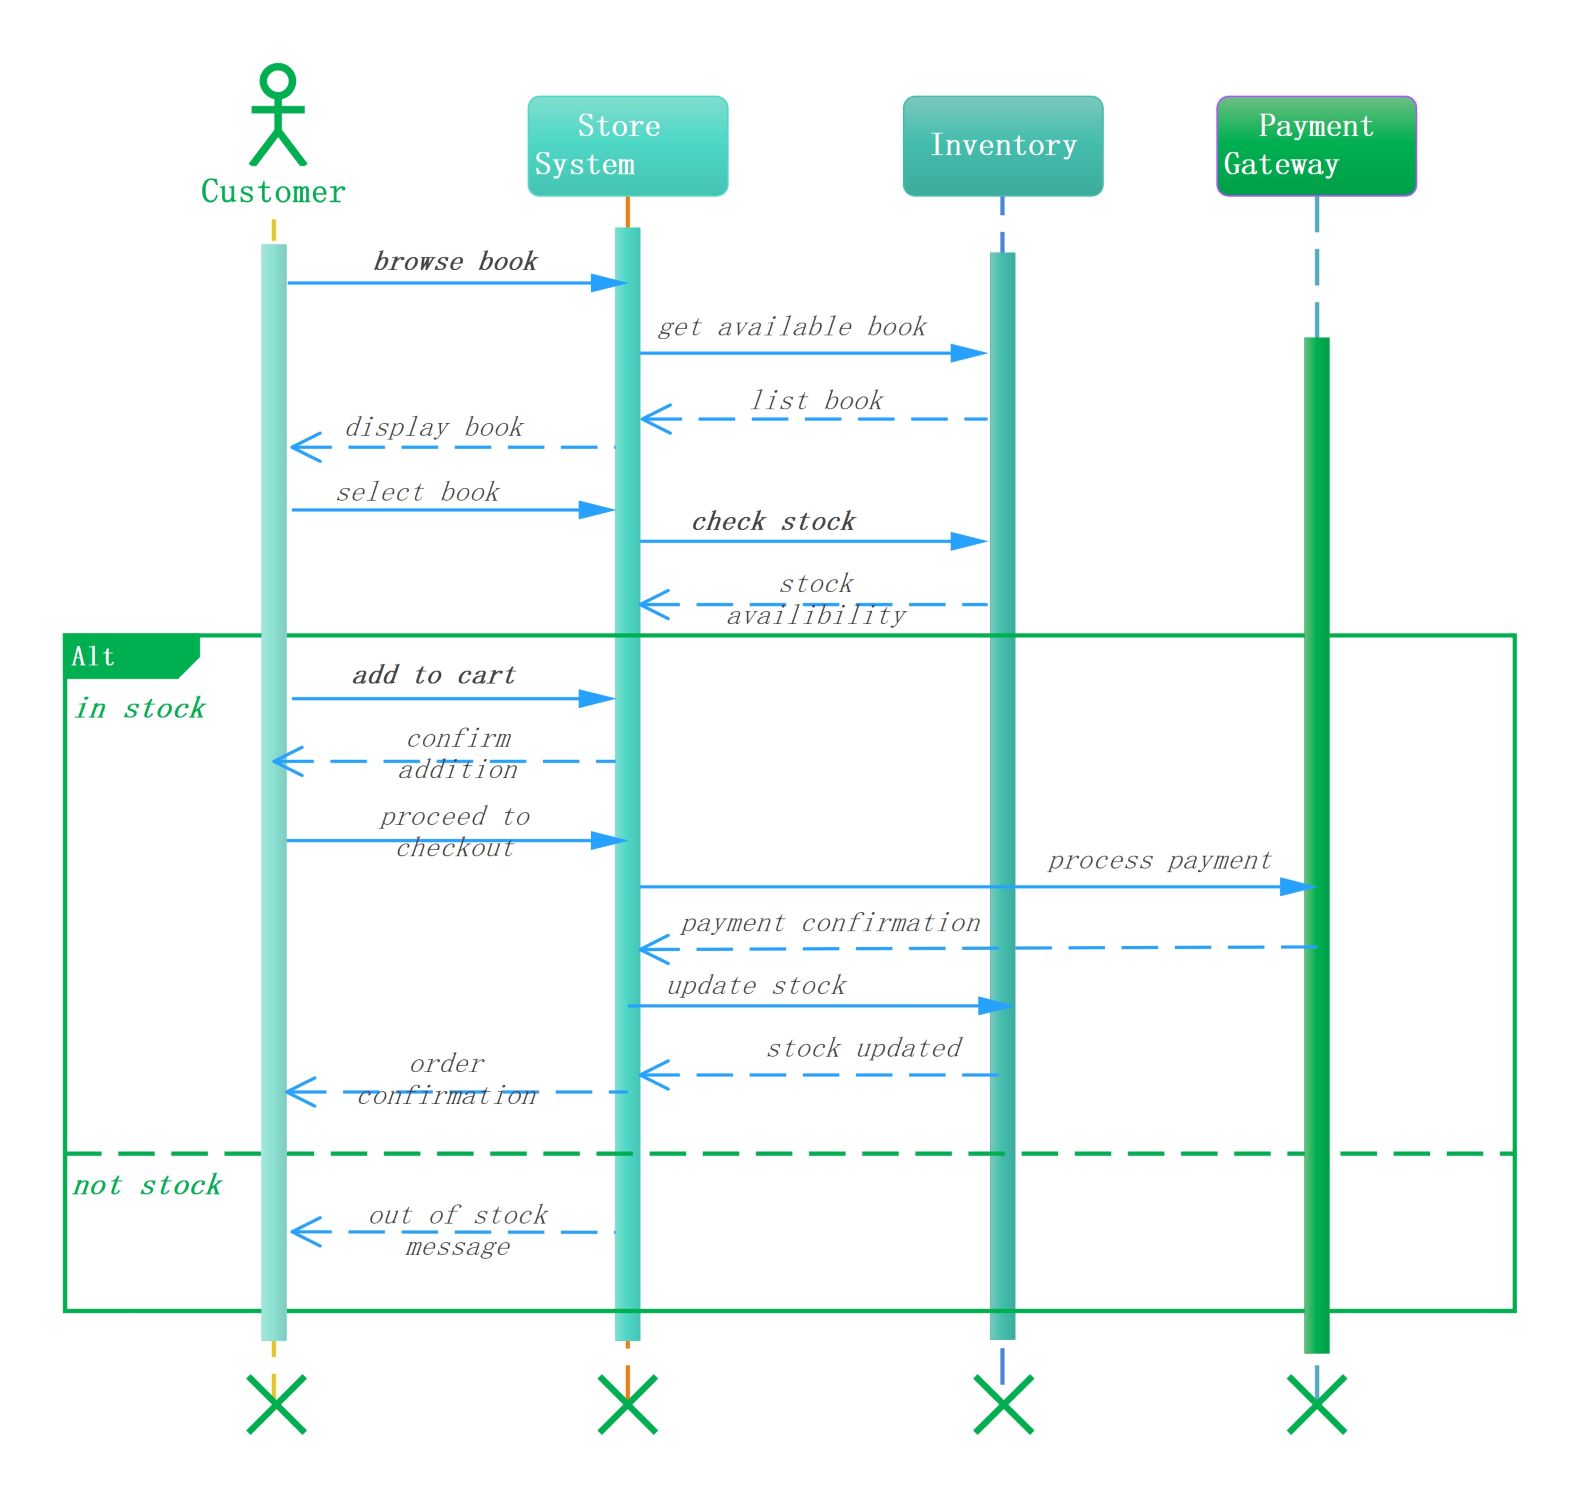
Alternative blocks, often labeled as "Alt," allow you to show conditional logic. In this diagram, they handle success and failure paths for login and data searches. This makes the diagram more realistic because it covers every possible scenario. Without these blocks, the diagram would only show the perfect path, which is not how real-world software systems actually function.
 (AI & Web)