One of the most important components of a problem-solving strategy is the ability to determine the cause of the problem in the first place and address it appropriately. This helps the organization progress and develop.
However, distilling this systematically is made easy by the 6M Method, which allows teams to investigate all the aspects that contributed to a problem. The 6M Method categorizes all possible reasons for a problem into six manageable types, thus providing a clear approach to tackling multifaceted issues.
The 6M Method, refinement of the 5WH Method, is introduced in this article, along with its background, advantages, and uses so you can perform the root cause analysis effectively.
In this article
Part 1: What is the 6M Method?
The 6M Method is a structured approach for performing root cause analysis by examining six potential sources of process variation.
This technique enables the teams to conduct a structured or even methodical search for the causes of a problem and allows the implementation of proper solutions. The method originated from the quality management sphere and is connected with the detailed background of the Fishbone Diagram, known as the Ishikawa Diagram.
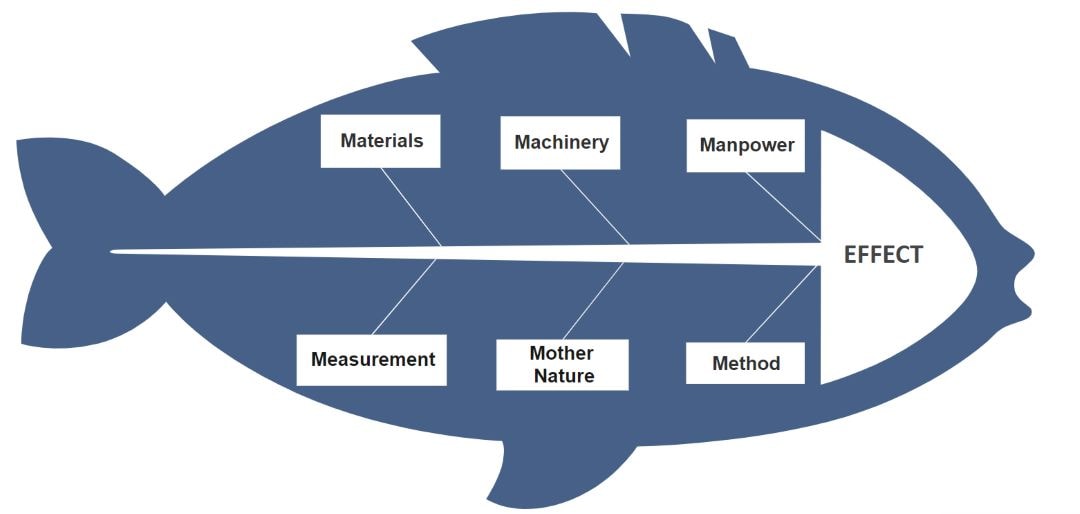
The Fishbone Diagram was developed in the 1960s by Dr. Kaoru Ishikawa, who referred to the diagram as a key ingredient in Quality Control. Applicable to Japanese production, it became famous as a tool for discovering the roots of problems and deviations in quality.
The term “6M” stands for six Ms– the six categories the method seeks to investigate to identify the root cause of a problem. Originally, these categories evolved to solve diverse types of production patterns. Thus, the method has been further extended and applied to numerous industries and areas, such as healthcare, service, and software.
What are the 6 Ms of the Technique?
The six M’s are Machines, Materials, Manpower, Mother Nature, Measurements, and Methods.
The 6M method categorizes potential causes into six key areas, allowing teams to explore different aspects of a problem thoroughly:
- Machines: This category includes all the machinery, types of equipment, and technologies geared toward the process. Possible causes in this area might be the breakdown of the machines, mechanical failure, or negligence in maintenance.
- Materials: Materials encompass the ingredients, parts, and stock in use as the process implies. Challenges in this category may be associated with material quality, specification, or supply.
- Manpower: Manpower is on factors related to people engaged in the process. Potential causes associated with manpower might be inadequate training, mistakes, shortage of employees, or ineffective communication.
- Mother Nature: The external factors are called Mother Nature as they have to do with the environmental factors. This could range from temperature and humidity conditions, natural disasters, or any other change of law that affects the organization.
- Measurements: This category encompasses the ways and means of assessing the process and measuring and evaluating tools that could be effectively employed in this circumstance. Any deviations of results due to errors in measurements, faulty instruments, or incorrect data are also in this category.
- Methods: Methods include the steps, policies, and processes involved in the process. Potential causes related to methods may include the following: The techniques used in the organization could be outmoded, slow, or uncoordinated.
Solutions arising from brainstorming and evaluating six categories help teams develop many factors for approaching and solving a problem since numerous factors can be associated with any category.
Part 2: Benefits of the 6M Model
The 6M Method offers several advantages that make it a valuable tool for root cause analysis:
- Comprehensive analysis: It provides systematic and comprehensive coverage that potential causes of variation may exist anywhere in a process.
- Structured approach: The 6M method efficiently organizes the possible causes by dividing them into categories.
- Improved problem-solving: The method involves working with teams to develop several approaches to a problem, providing stronger solutions.
- Facilitates collaboration: The 6M method strengthens the teamwork paradigm by engaging many actors in the analysis phase.
- Versatile application: The method can be generalized for different industries and areas of specialization, so it is relevant in any organization.
- Enhances understanding: When the causes are categorized into various groups, teams develop a broader perspective on several aspects responsible for a given issue.
Part 3: 6Ms for Cause and Effect Analysis
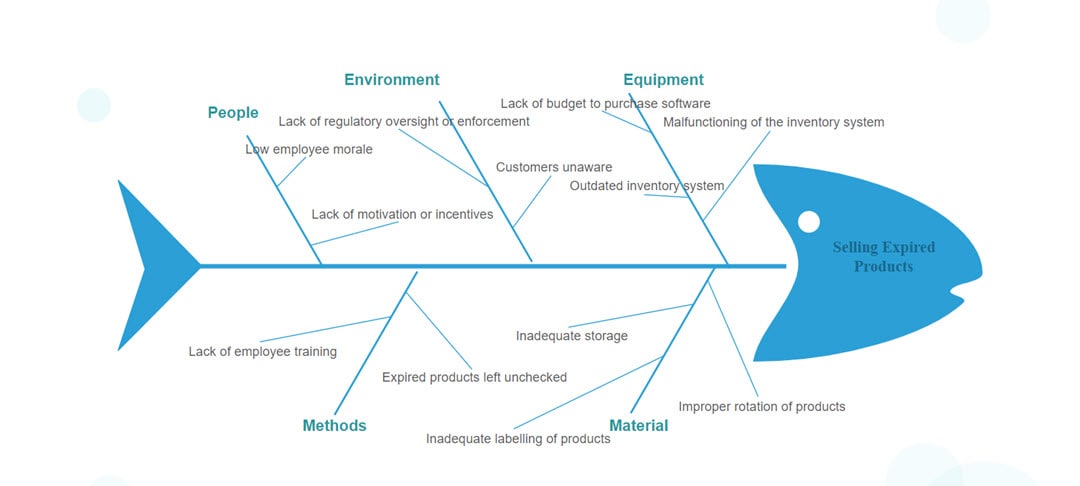
The 6Ms in cause and effect analysis make up a diverse strategy for fixing difficulties in organizations and industries. The process contains a fishbone diagram called the Ishikawa diagram, where the problem becomes the head of the fish, and the branches hold all the possible solutions lying in 6M categories.
The following is an example of how a manufacturing company facing a high defect rate in the manufacturing process can use 6Ms for cause and effect analysis:
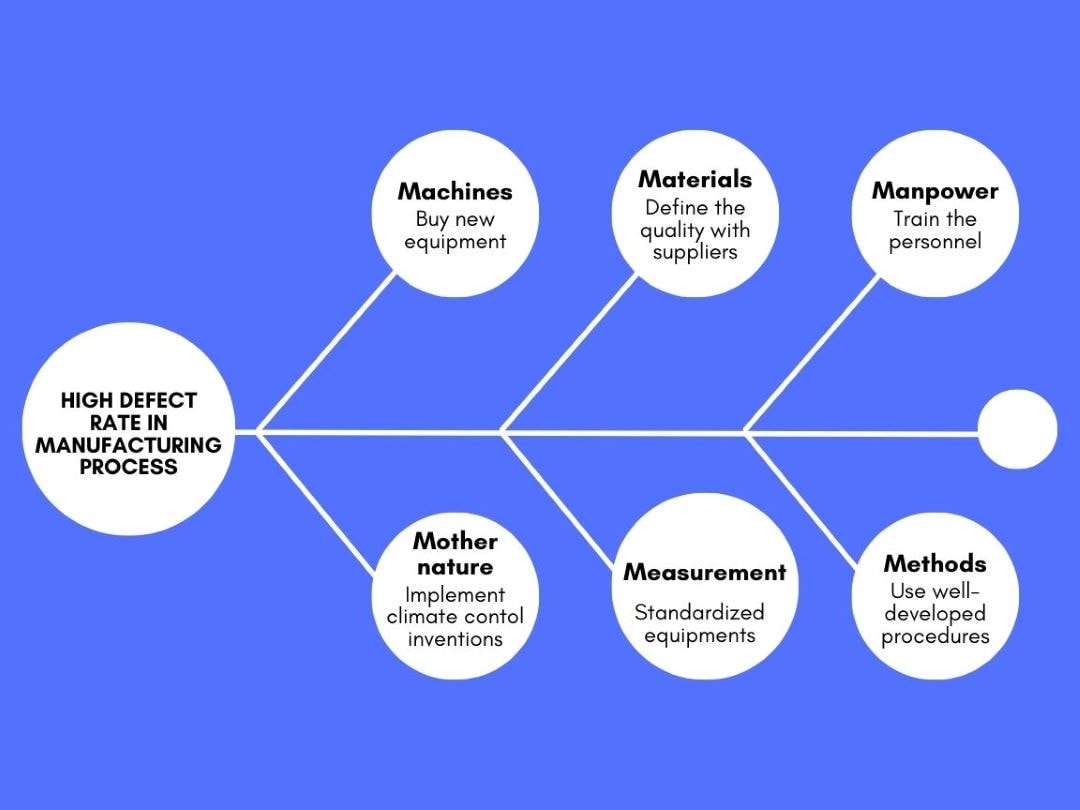
- Machines: Ensure that new equipment is bought and schedules are set fast to ensure the equipment is checked if it is likely to fail soon.
- Materials: Ensure that quality with suppliers is defined before you start production and adhere to check on the quality maturing periodically.
- Manpower: It is necessary to train the personnel to provide adequate skill, efficient client service, and product knowledge.
- Mother nature: Climate control inventions should be implemented to ensure the environment remains standard.
- Measurements: Ensure that the measurement instruments are standardized occasionally and obtain better-quality instruments.
- Methods: Use well-developed procedures, processes, and patterns that are intended to facilitate share of similar production processes.
Generally, the assessments and measurements made under each category can guide the company in the early detection of defects and the possibility of offering a comprehensive solution to enhance production.
Part 4: How to Draw a Cause and Effect Diagram Using the 6M Method
Creating a cause-and-effect diagram using the 6M Method is a straightforward process that involves the following steps:
- Define the problem: State what you want to address in as much detail as possible. This will be the ‘head’ starting point for the fishbone diagram.
- Identify the 6M categories: Draw a horizontal line from the problem statement and label the six branches with each of the 6Ms– Mother Nature, Measurements, Manpower, Machines, Materials, and Methods.
- Brainstorm potential causes: Discuss possible reasons for each category mentioned with your colleagues. Discuss the issues and get ideas from all the key participants in the problem.
- Organize and prioritize causes: Categorize the causes in groups to which one should belong and then rank them according to the possibility of their occurrence and their effect on the problem at hand.
- Analyze and identify root causes: Evaluate the possible causes in each formed category to recognize the causes that lead to the problem.
- Develop solutions: It is time to integrate work with your team to formulate good strategies for the newly specified causes.
- Implement and monitor solutions: Ensure that all the solutions have been put into practice and then supervise their efficiency for the long term.
With the help of these steps, you can develop an efficient cause and effect Diagram that can illustrate the causes of a certain issue without excluding any factors and help your team make the right decision.
Part 5: Cause and Effect Diagram Templates from EdrawMax
To help you get started with creating cause and effect diagrams using the 6M Method, here are several templates available from EdrawMax that you can use:
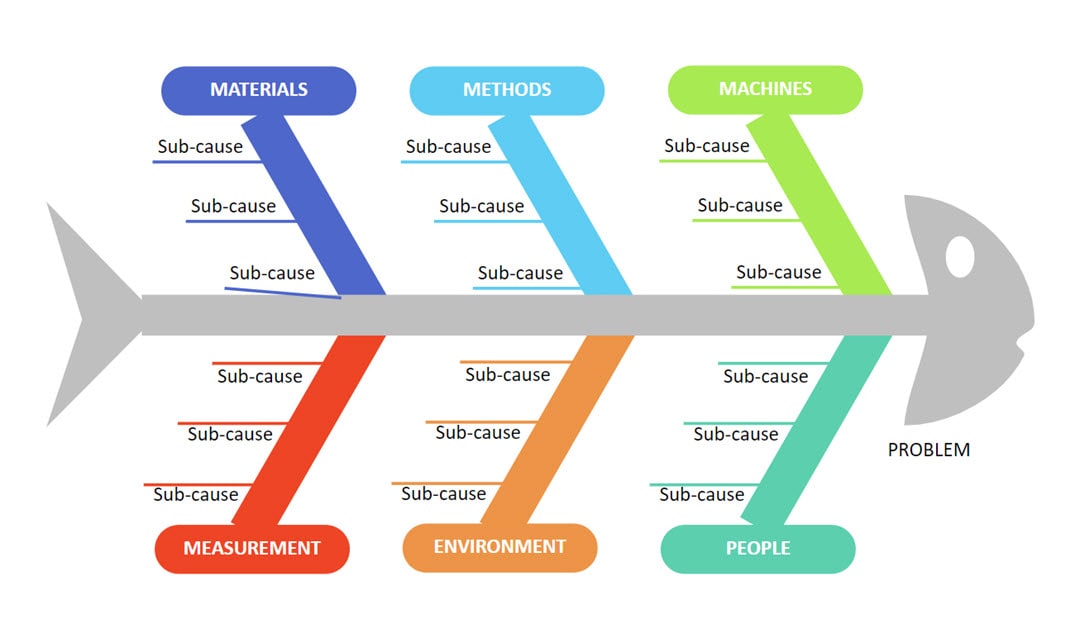
Fishbone diagram for family relations
These branches are incorporated in this template. There are six branches: Machines, Materials, Manpower, Mother Nature, Measurements, and Methods. This is a basic structure of the analytical approach suitable for simple issues.
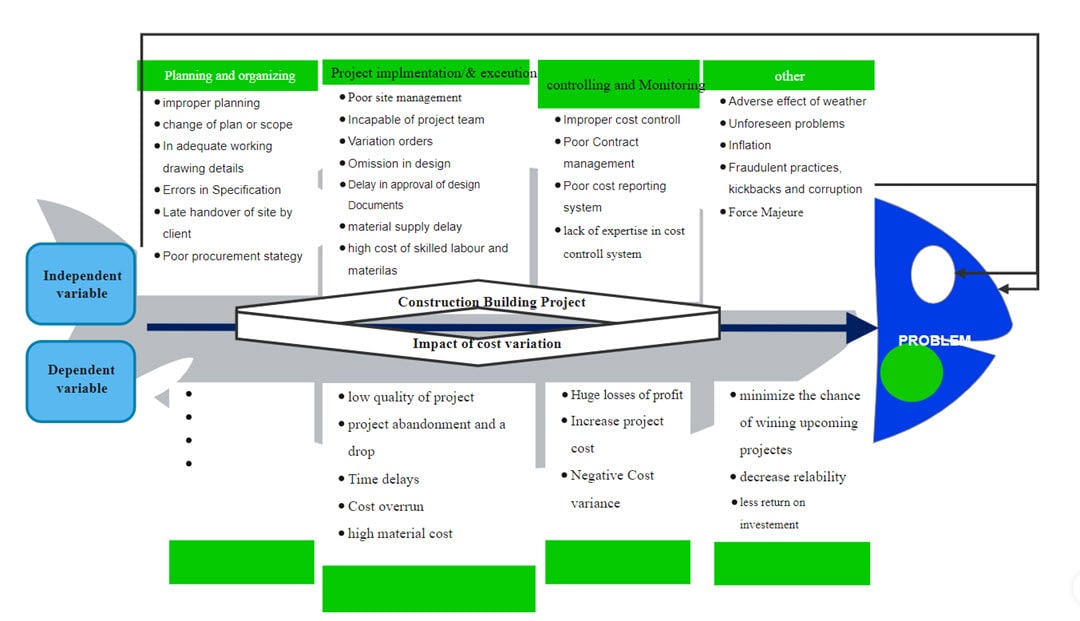
Fishbone diagram for project managemenr
A more elaborate structure would enable the creation of two or more levels of subcategories under each category. This template is appropriate when the problem being solved is large and complex and needs a lot of sub-cause analysis.
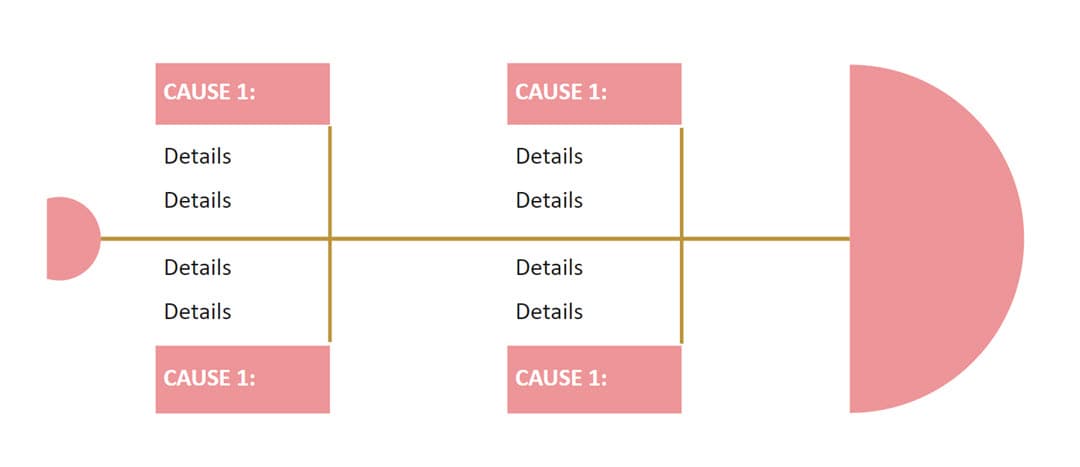
Blank fishbone diagram
Color schemes enable one to distinguish between different categories while, at the same time, the format of the template is appealing to the eyes. This template also increases the degree of focus, making it easier for the teams to identify priorities.
Cause and effect diagram with details
An electronic form can be submitted, edited, and used in cases where collaboration and management are done online from different locations. This template can be used for remote meetings and discussions because it involves generating ideas.
Template 5
The company-specific template is based on the type of business, such as healthcare-related, manufacturing, or IT. It involves categories and sub-causes by industries so you can perform a more relevant analysis.
Conclusion
The 6M method is one of the most effective approaches to conducting the root cause analysis and applying correct actions. Studying possible causes in six broad areas helps teams better understand what led to the issue.
Thus, no matter in what field you operate, be it manufacturing or healthcare, and even if you are not in industry at all, the 6M Method may serve as a transparent and, at the same time, rather useful problem-solving framework.
If you want your team to confront complex issues at work successfully, study the different cause-and-effect diagrams and delve into the templates offered by EdrawMax for increased performance and optimization of your organization’s outcomes.


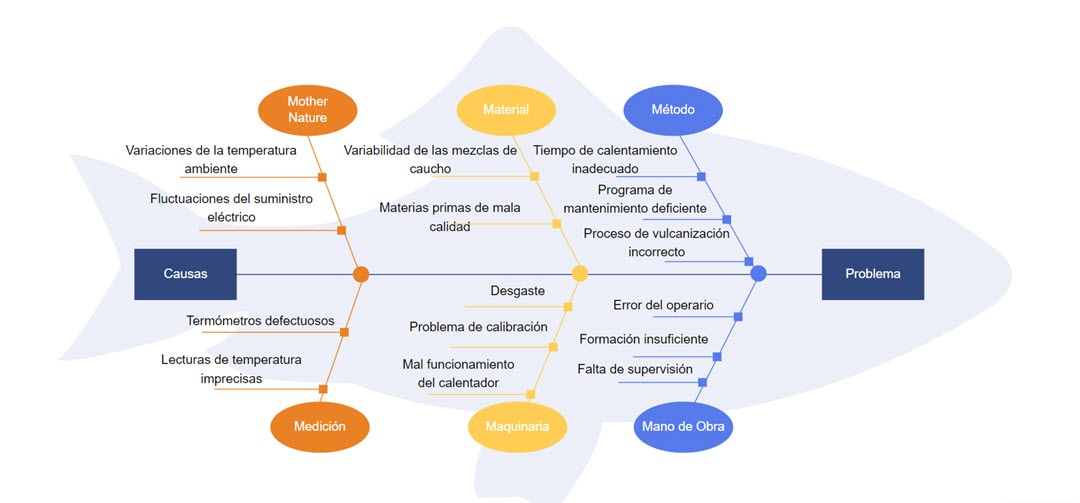
 below.
  below.