


Quantitative risk analysis is a systematic approach that utilizes numerical data and mathematical models to assess and measure risks in a project or business process. By analyzing the probability and impact of identified risks, organizations can make informed decisions and prioritize risk management efforts.
With advanced methods and models, analysis of quantitative risks enables companies to effectively analyze risks and enhance overall performance. In this article, you will learn everything related to the analysis of quantitative risks.
In this article
Part 1. Defining Quantitative Risk Analysis
Quantitative risk management is a systematic approach to assessing and measuring risks in a project or business process by using numerical data and mathematical models. It involves analyzing the probability and impact of identified risks to estimate the overall level of risk.
By quantifying risks, organizations can make informed decisions and prioritize risk management efforts. This method provides a more accurate understanding of risks compared to qualitative analysis, which relies on subjective judgment.
Part 2. Methods and Models for Quantitative Risk Analysis
Quantitative risk analysis has certain methods and models. Organizations follow these to guarantee that quantitative risks are analyzed effectively. These methods and models are advanced in nature and have been proven beneficial time and again.
1. Probability and Impact Assessment:Evaluating the likelihood and consequences of risks.
2. Monte Carlo Simulation:Using statistical analysis to model uncertainties and simulate multiple scenarios.
3. Sensitivity Analysis:Identifying the most influential factors and their impact on the project’s outcome.
4. Expected Monetary Value Analysis:Calculating the expected value of each quantitative riskby multiplying its probability with the potential impact.
5. Decision Trees:Visualizing and analyzing different decision options and their associated risks.
Part 3. Benefits and Limitations of Quantitative Risk Analysis
The applications of quantitative risk analysis are diverse. It is used in a lot of areas. With its help, quantitative risks can be mitigated easily and with efficiency.
1. Project Management:Assessing and managing risks in project schedules, budgets, and resource allocation.
2. Financial Risk Analysis:Evaluating investment risks, portfolio management, and pricing financial instruments.
3. Supply Chain Management:Analyzing risks in the supply chain, such as demand variability and supplier disruptions.
4. Safety and Environmental Risk Assessment: Estimating risks associated with hazardous materials, industrial processes, or natural disasters.
Quantitative risk management has a lot of benefits. These benefits enable companies to analyze risks beforehand and take measures accordingly. However, it also has certain limitations, and those concerned should be aware of it.
Benefits:
- Provides a quantitative understanding of risks.
- Enables more accurate risk prioritization and decision-making.
- Helps in resource allocation and contingency planning.
- Facilitates communication and stakeholder engagement.
- Enhances overall project or business process performance.
Limitations:
- Requires quality data and information for accurate analysis.
- Can be time-consuming and resource-intensive.
- Relies on assumptions and simplifications, which may introduce uncertainties.
- Limited applicability to complex and uncertain environments.
- Difficulties in quantifying certain types of risks, such as reputational or strategic risks.
Part4. Creating A Quantitative Risk Management Chart With EdrawMax
Wondershare EdrawMax is a risk management flowchart creation tool that helps users create professional-looking qualitative and quantitative risk analysis flowcharts in a matter of minutes. It features a library of symbols that allow users to quickly and easily create flowcharts that accurately reflect their risk management process. Here are the steps to create a quantitative risk management flowchart using the tool:
Step 1: Pick out a suitable template and open it
- Look for a template that specifically caters to quantitative risk managementor risk assessment. Edrawmax provides a wide range of templates, so search for one that suits your requirements.
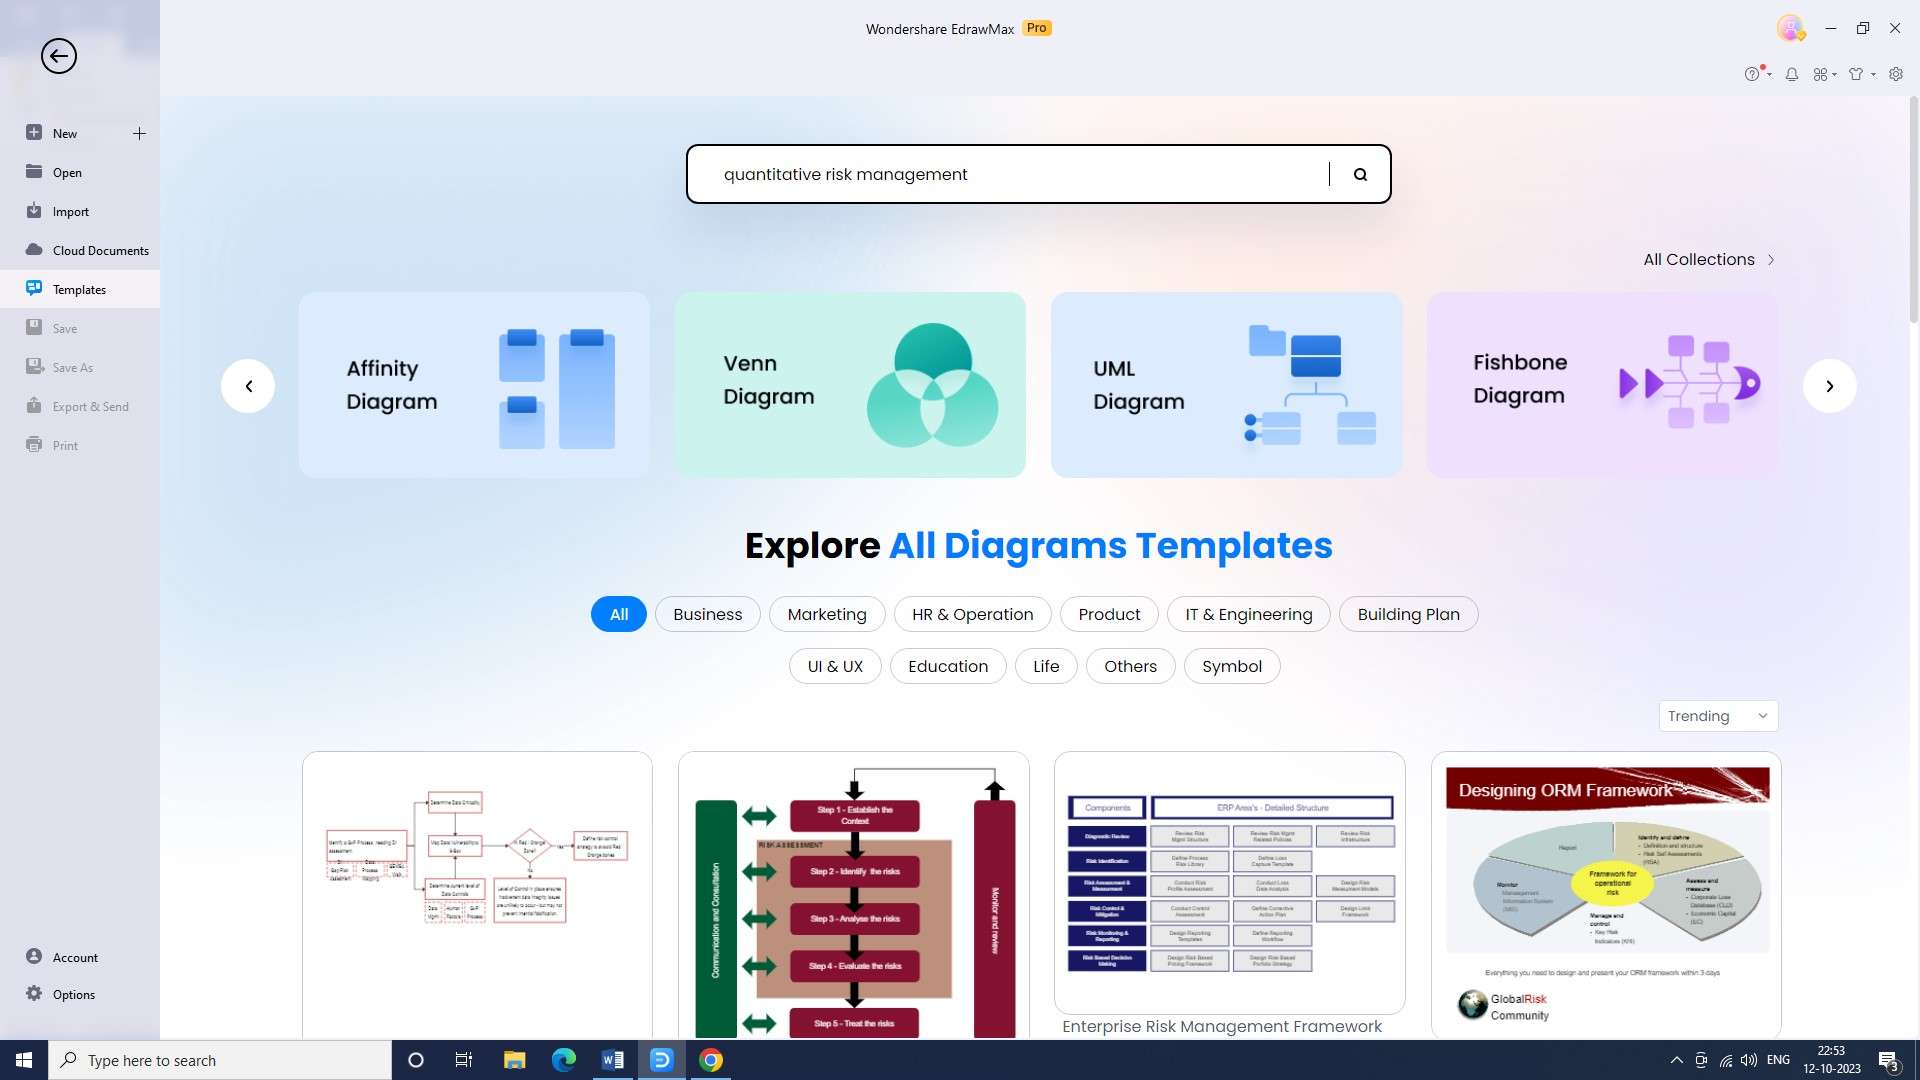
- Once you have found a suitable template, open it in the tool. This will provide you with a pre-designed structure and elements that you can modify according to your needs.
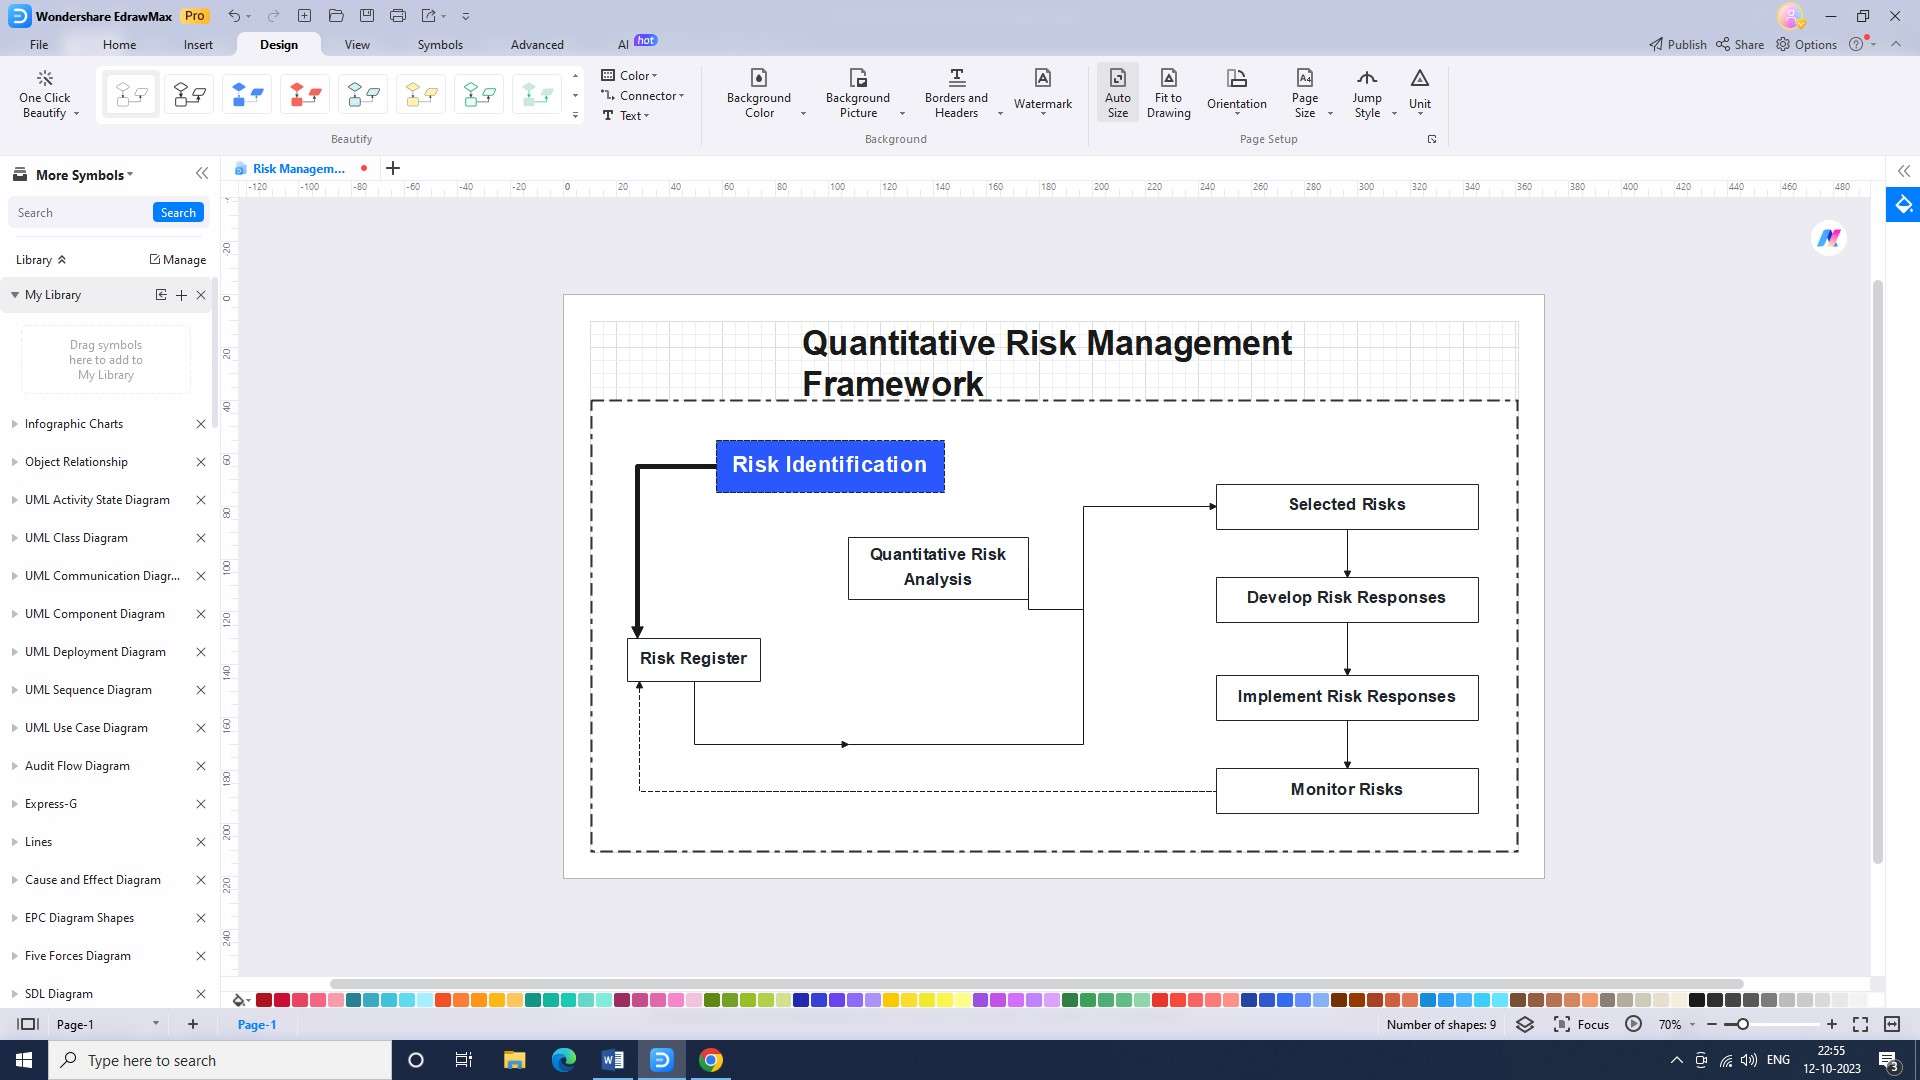
Step 2: Customize the flowchart
Modify the template to reflect the specific risk management process of your organization. Add or remove elements as needed, and ensure that the flowchart accurately represents your risk management framework.
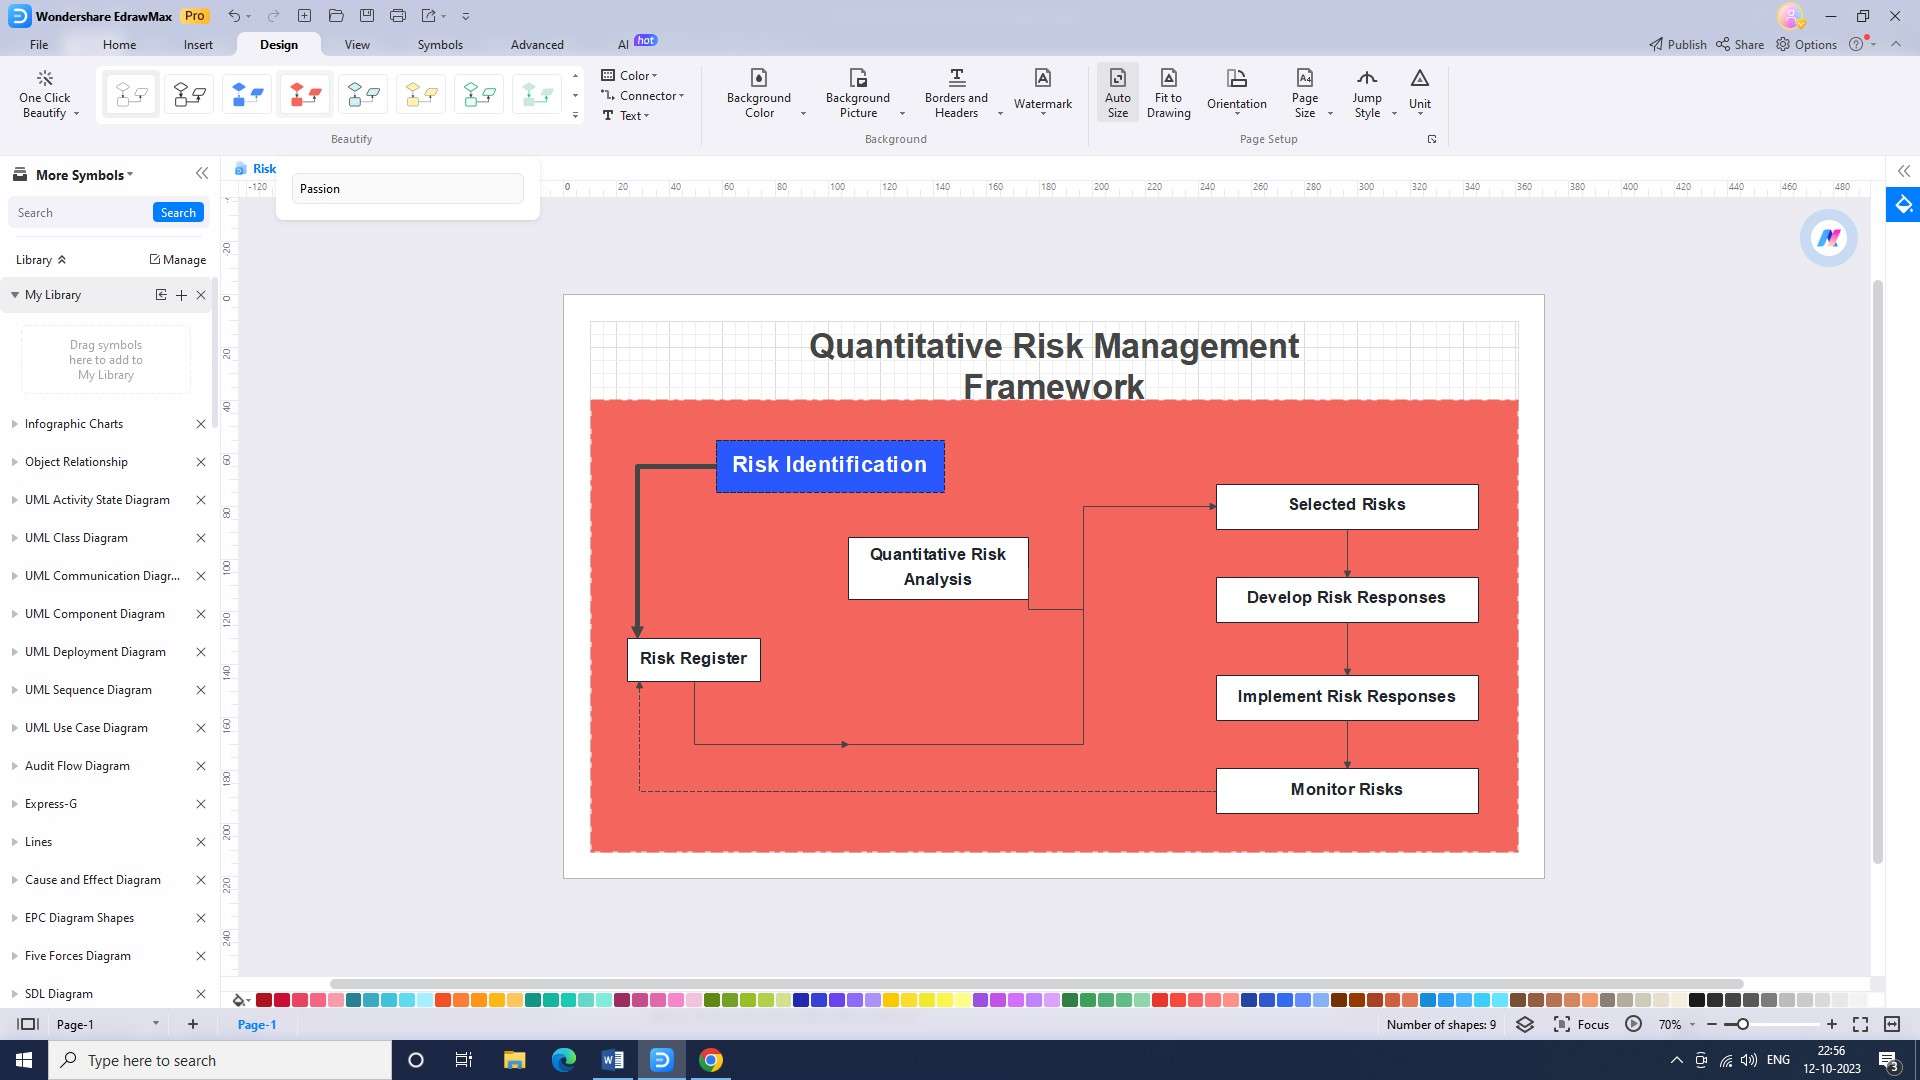
Step 3: Add details
Fill in the details of your risk management process within each element of the flowchart. This may include naming the steps, describing risk assessment methodologies, modifying colors, specifying probability and impact scales, and outlining mitigation strategies.

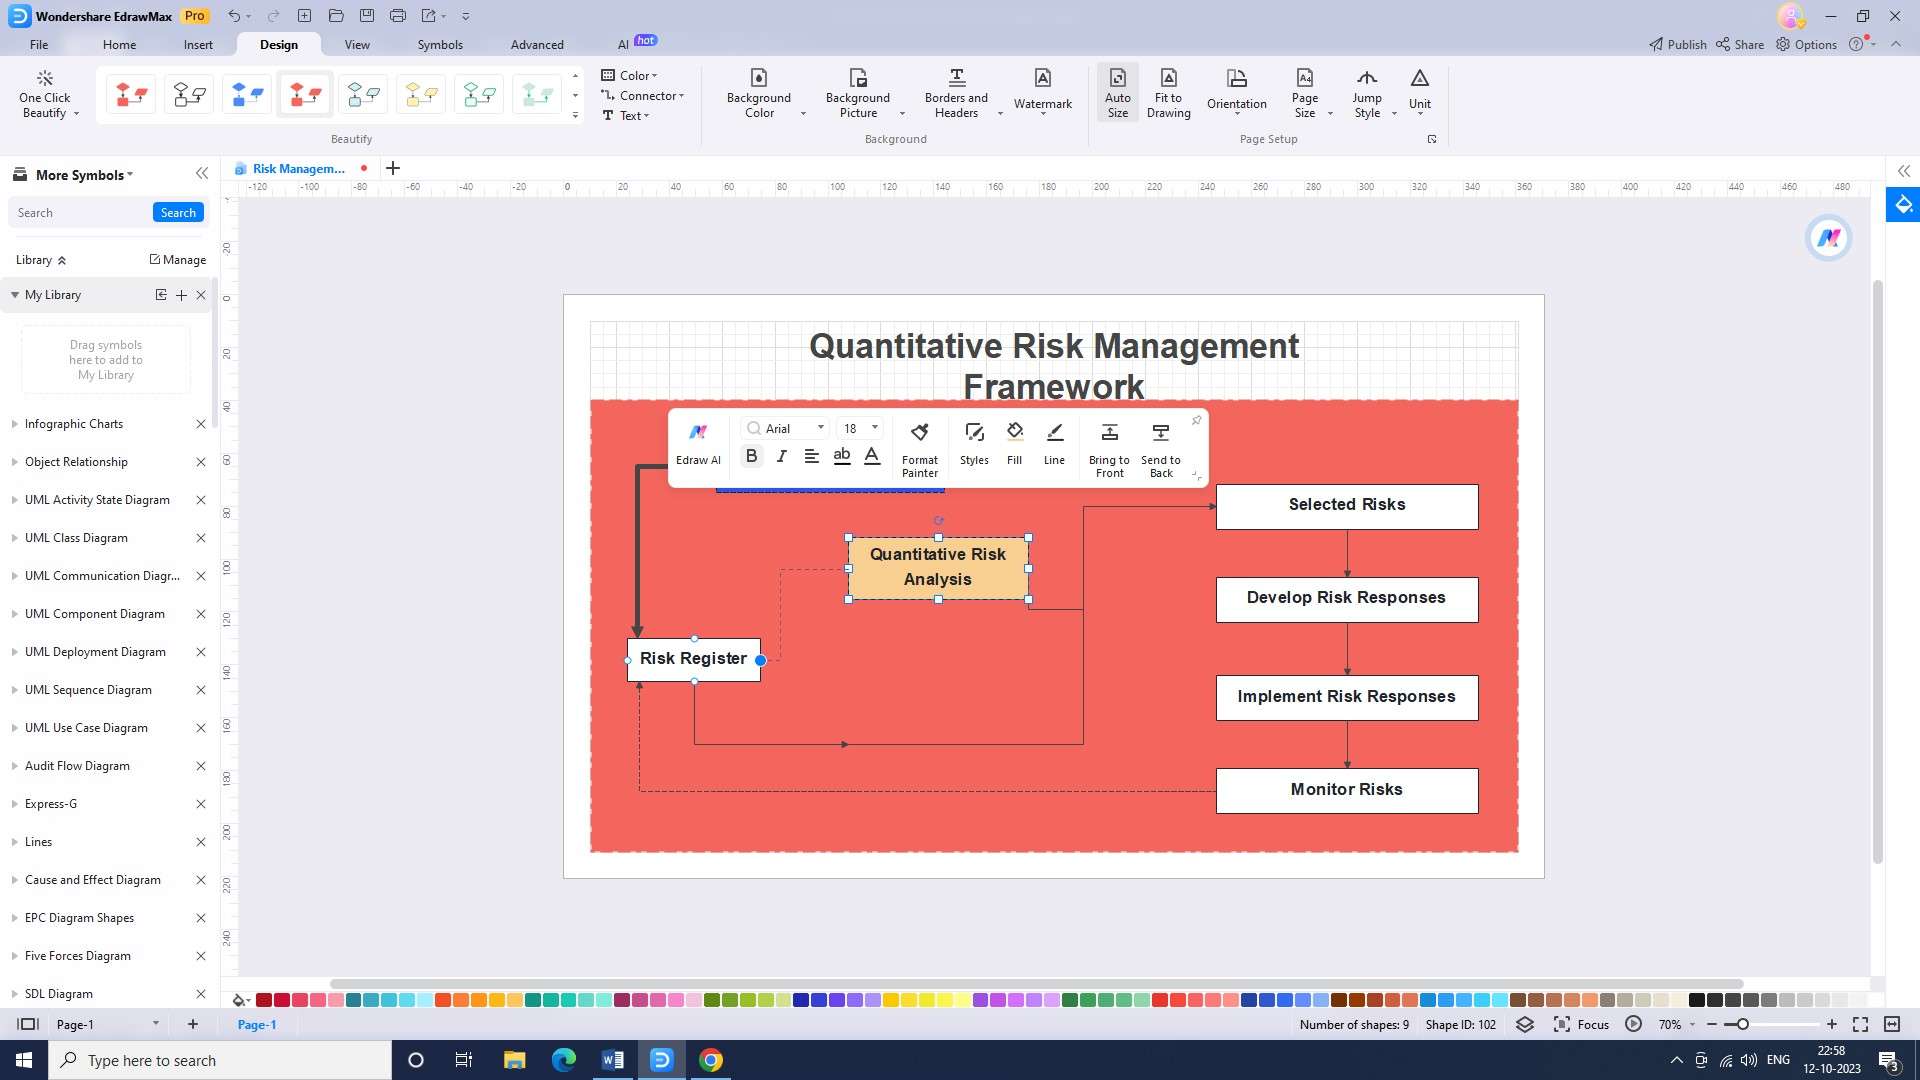
Step 4: Connect the elements
Use arrows or connectors provided by the tool to link the flowchart elements in a logical sequence. This will show the flow of the risk management process and help users understand the relationships between different stages.
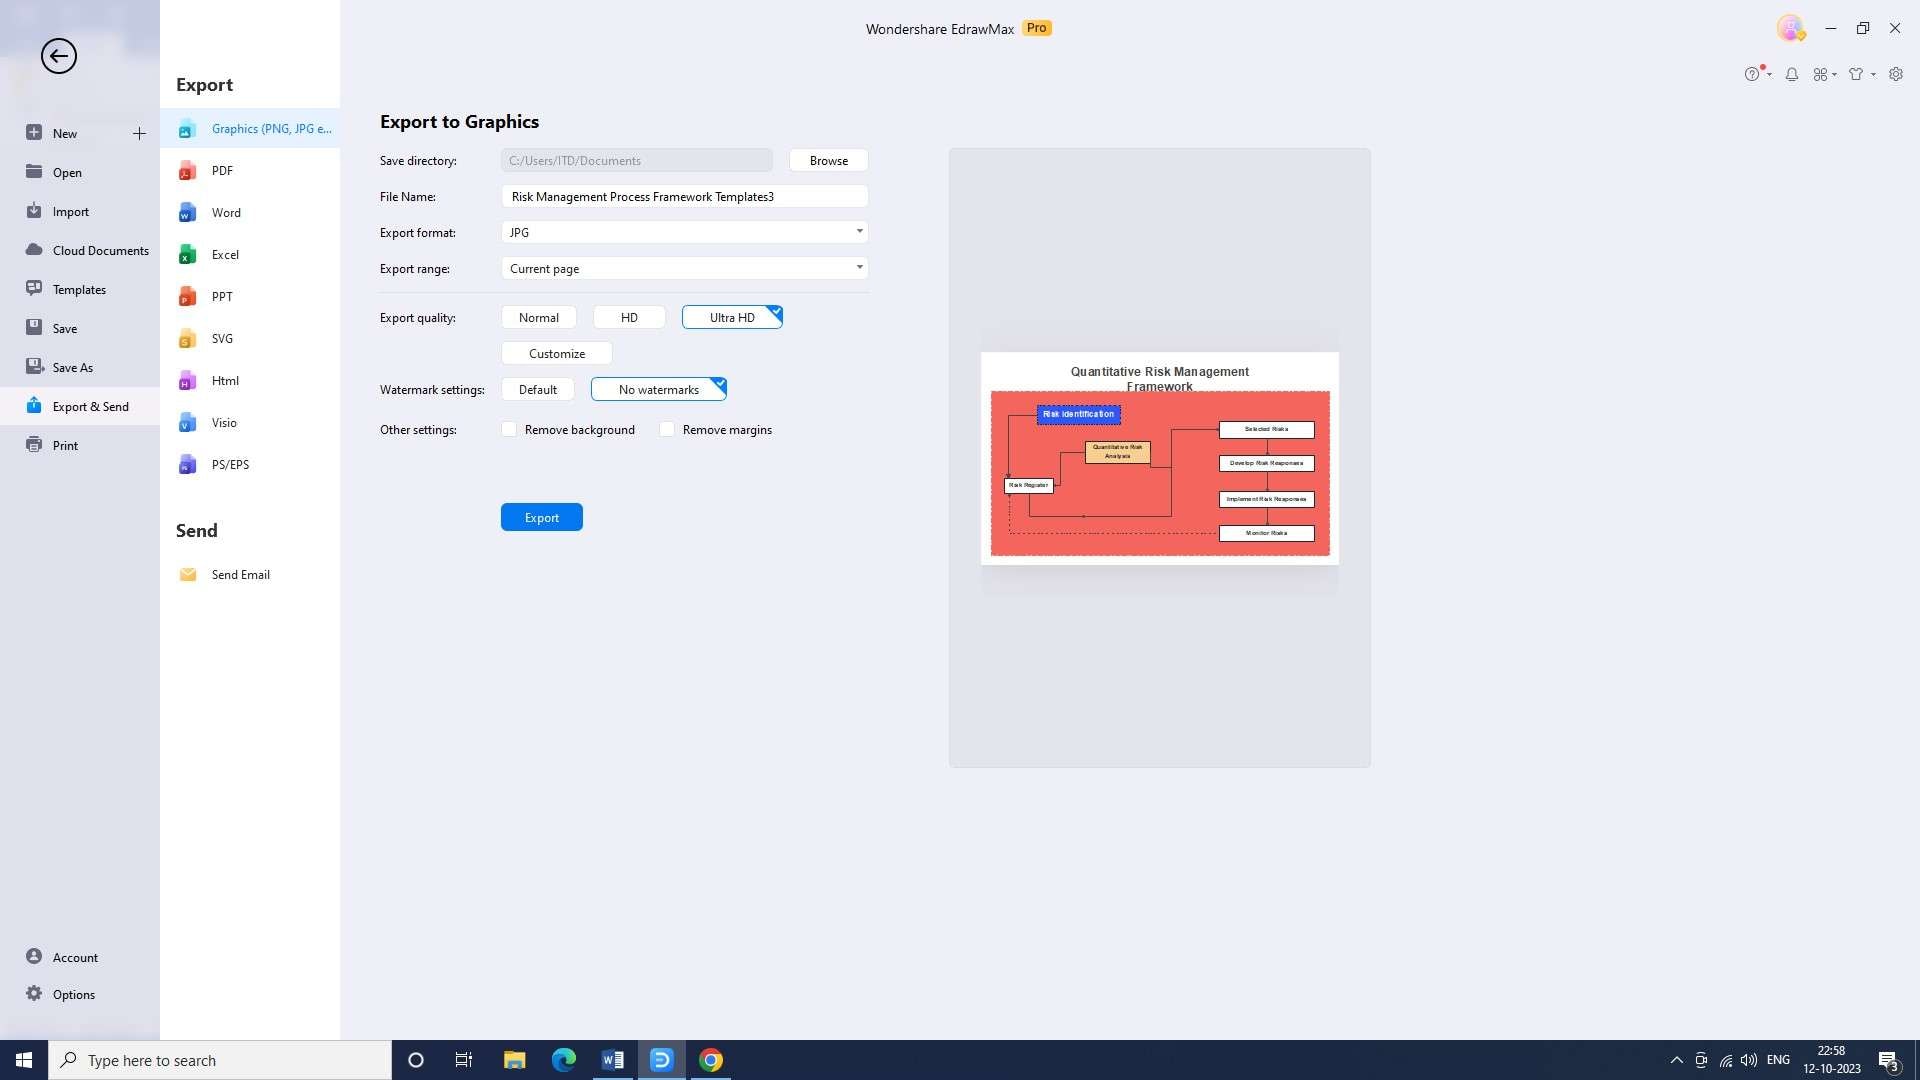
Step 5: Export the flowchart
After finalizing the flowchart, export it in a suitable format (e.g., PDF or PNG) to ensure that it can be easily shared and accessed by others. This will allow you to distribute the flowchart to those who may not have access to EdrawMax or prefer a different file format.
Conclusion
Project risk register flowcharts play a crucial role in managing and mitigating risks. By outlining a step-by-step process, these flowcharts provide a structured framework for identifying, analyzing, and evaluating risks. They enhance decision-making processes, facilitate effective communication, and enable stakeholders to prioritize risks and allocate resources accordingly.
