


Flow charts are valuable tools for visualizing and documenting risk management in project management. They provide project managers with a clear and sequential representation of the steps involved in identifying, assessing, and mitigating risks. By using flow charts, project teams can enhance communication, ensure consistency, and improve the overall effectiveness of their risk management strategies.
In this article
Part 1. What are Flow Charts for the Risk Management Process?
Flow charts offer a graphical representation of the sequentialsteps involved in the risk management process. They help project managers withvisual risk assessment in project management at differentstages. Flow charts for risk management allow for clear documentation of theprocedures that should be followed, enhancing communication and ensuringconsistency among team members. Theytypically consist of several key elements.
1. Identifying Risks
Flow charts facilitate risk identificationin project management by listing possible risk events and theirpotential impacts on the project. By visually mapping these risks, projectmanagers gain a comprehensive understanding of the potential threats that could hinder the project's success.
2. Assessing Risks
Flow charts guide project managers in assessing the likelihood andseverity of identified risks. Each risk event is evaluated based on theprobability of occurrence and its potential impact on various project objectives.
3. Mitigating Risks
Flow charts help in formulating effective strategies for risk mitigation in project management. By visually representing the various risk treatment options and their potentialoutcomes, project managers can make informed decisions.
Part 2. Methods for Risk Assessment in Project Management
Risk assessment is a crucial aspect of effective projectmanagement. While flow charts provide a comprehensive framework for the riskmanagement process, project managers need to utilize specific methods for riskassessment. Here, we will discuss two widely adopted methods:
1. Quantitative Risk Assessment
Quantitative risk assessment involves the use of mathematicalmodels and statistical analysis to quantify specific risks. It entailsassigning numerical values to likelihoods and impacts, allowing projectmanagers to prioritize risks based on their severity. This method isparticularly useful when dealing with complex projects that require preciseinformation.
2. Qualitative Risk Assessment
Qualitative risk assessment focuses on assessing risks based onsubjective judgments and expert opinions. Project managers use predefinedscales, such as high, medium, and low, to assess likelihood and impact. Whileless precise than quantitative assessment, qualitative risk assessment enablesproject teams to quickly evaluate risks based on their understanding andexperience.
Part 3. Adopting Flow Charts for Risk Management Process Improvement
The adoption of flow charts for risk management processimprovement offers numerous benefits for project teams. Some of these benefitsinclude:
1. Enhanced Communication
Flow charts provide a common visual language, enabling projectteams to communicate risk-related information clearly. This sharedunderstanding reduces misinterpretations and enhances collaboration among teammembers.
2. Improved Consistency
Flow charts ensure consistent application of the risk managementprocess across projects and teams. They serve as a reference point for projectmanagers and help maintain a standardized approach to risk identification,assessment, and creating risk mitigation plan in project management.
3. Facilitated Audits and Reviews
Flow charts make it easier to conduct audits and reviews of therisk management process. The visual representation of the mitigation plan in project management allowsstakeholders and external auditors to assess the effectiveness of riskmanagement strategies and identify any gaps or areas for improvement.
Part4. Create a Project Risk Management Flow Chart with EdrawMax
Wondershare EdrawMax is an intuitive project risk management flow chart creation tool. It helps users create risk management in project management flow charts quickly and easily with ready-made templates, interactive drag-and-drop features, and powerful drawing tools. It also offers other features such as exporting to multiple formats, sharing online, and more. Here are the steps to create a project risk management flowchart using the tool:
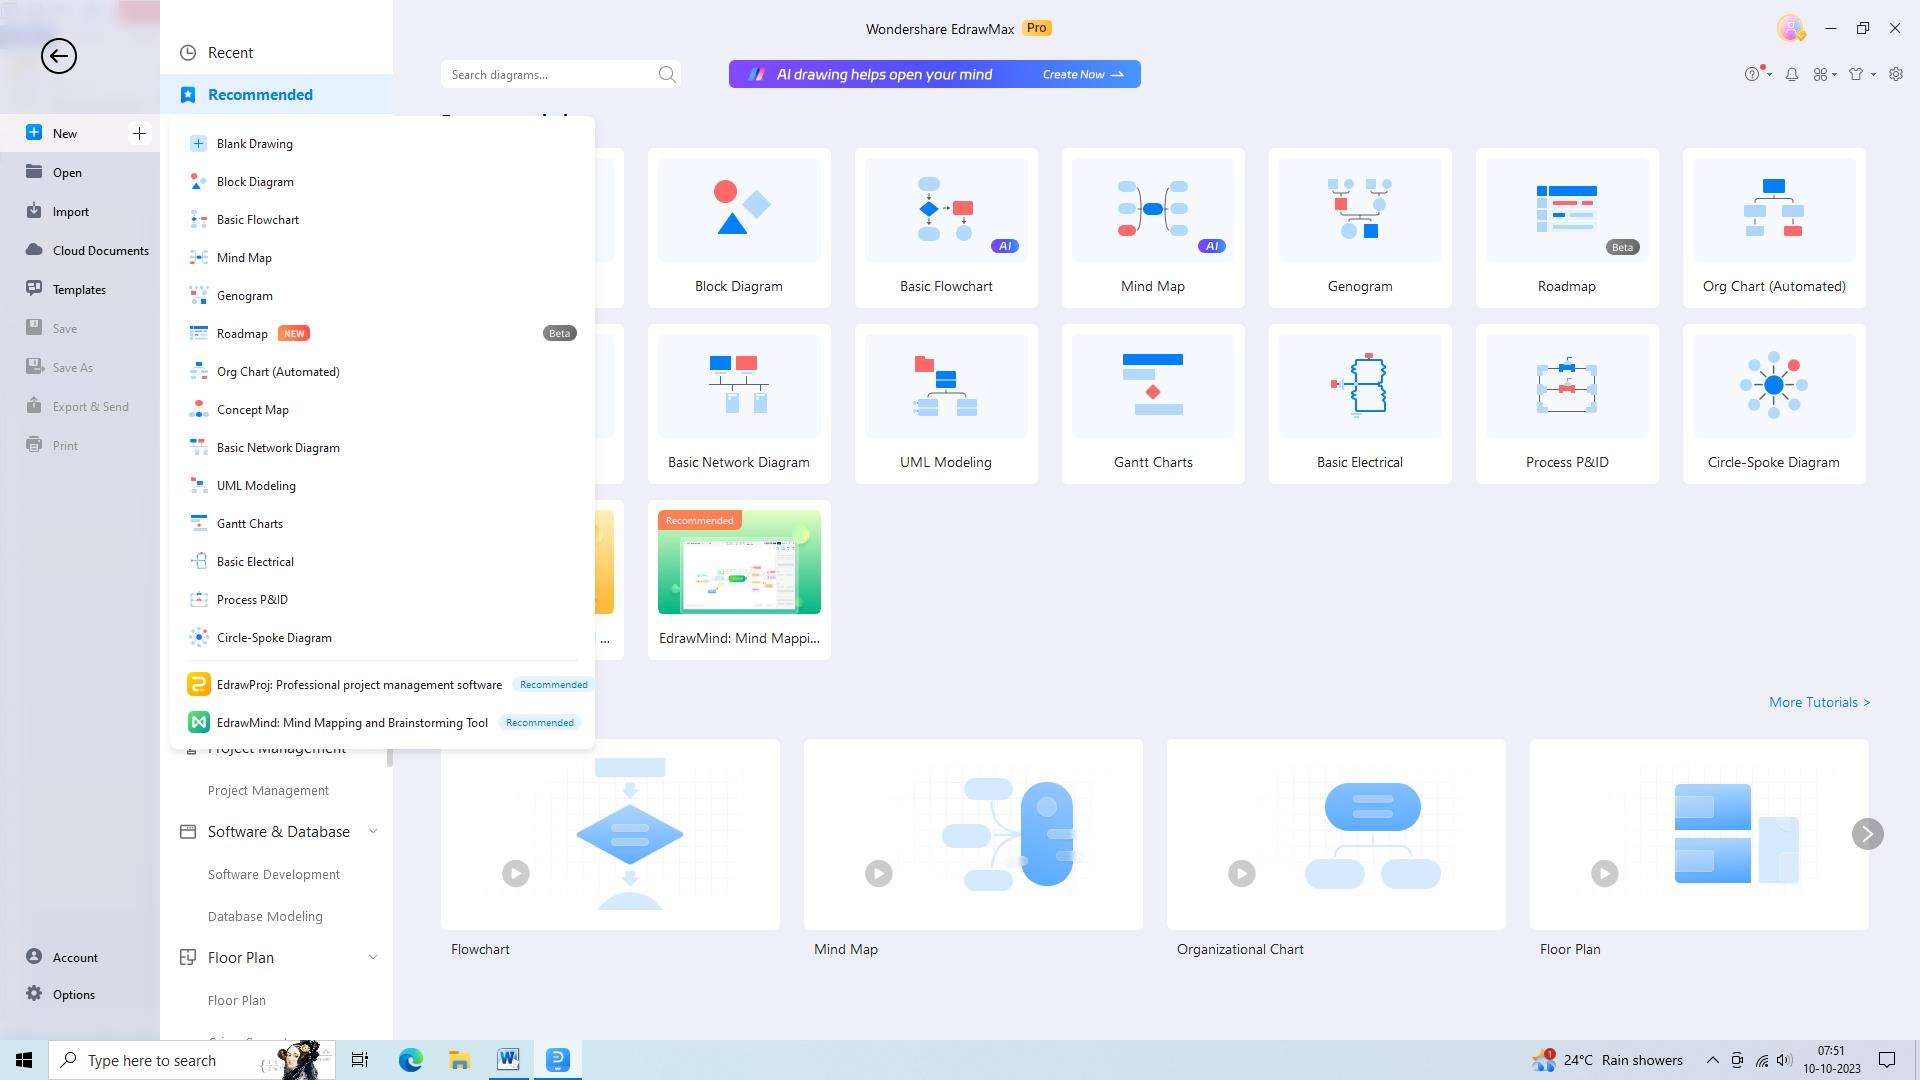
Step 1: Launch WondershareEdrawMax and create a new document
Begin by launching WondershareEdrawMax on your computer. Locate the "New" button within the interface and click on it to initiate the creation of a new document.
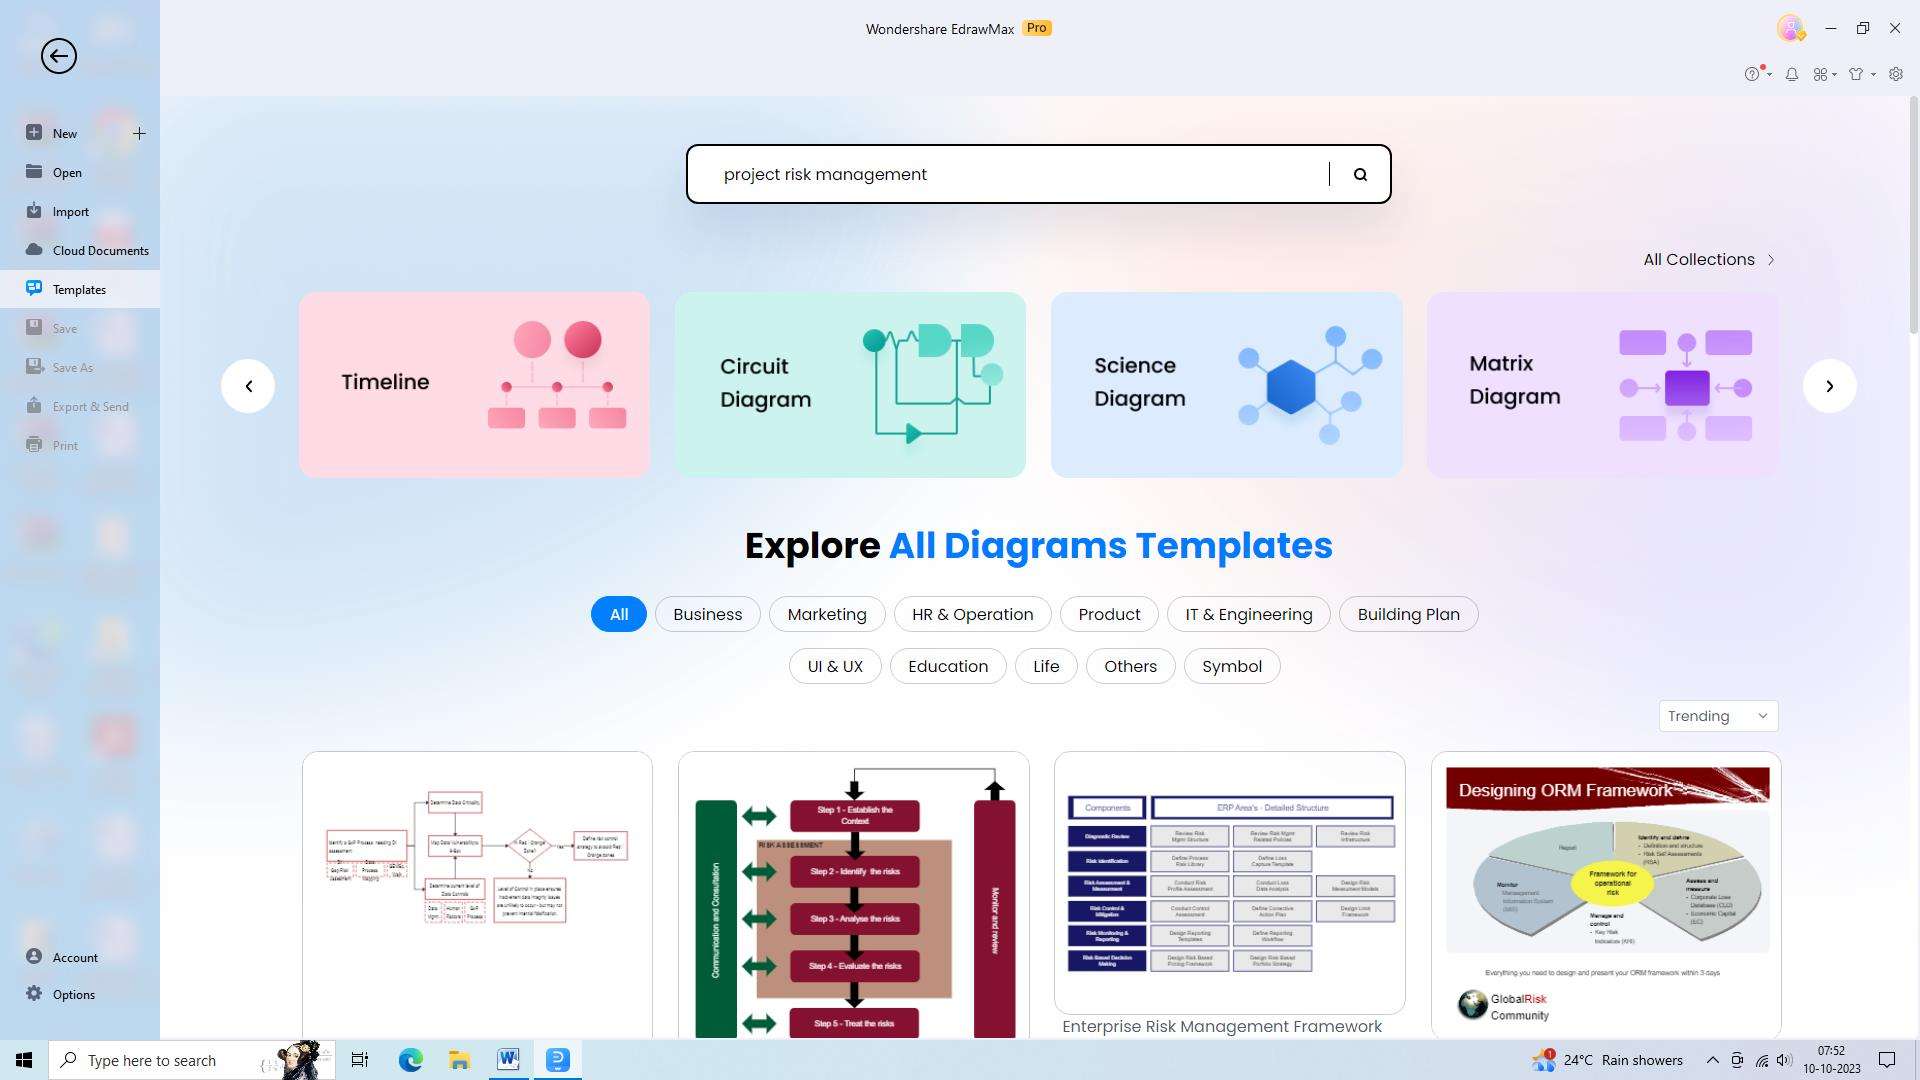
Step 2: Search and select a suitable "project risk management" template
Within the template search bar, enter "project risk management" as your query. From the list of suggested options, carefully choose the most appropriate template that aligns with your requirements.
Step 3: Drag and drop shapes to build the flow chart
Utilize the convenient drag-and-drop functionality provided by EdrawMax to effortlessly incorporate various shapes into your project risk management flow chart. Consider utilizing rectangles or circles to represent different elements within your flow chart.

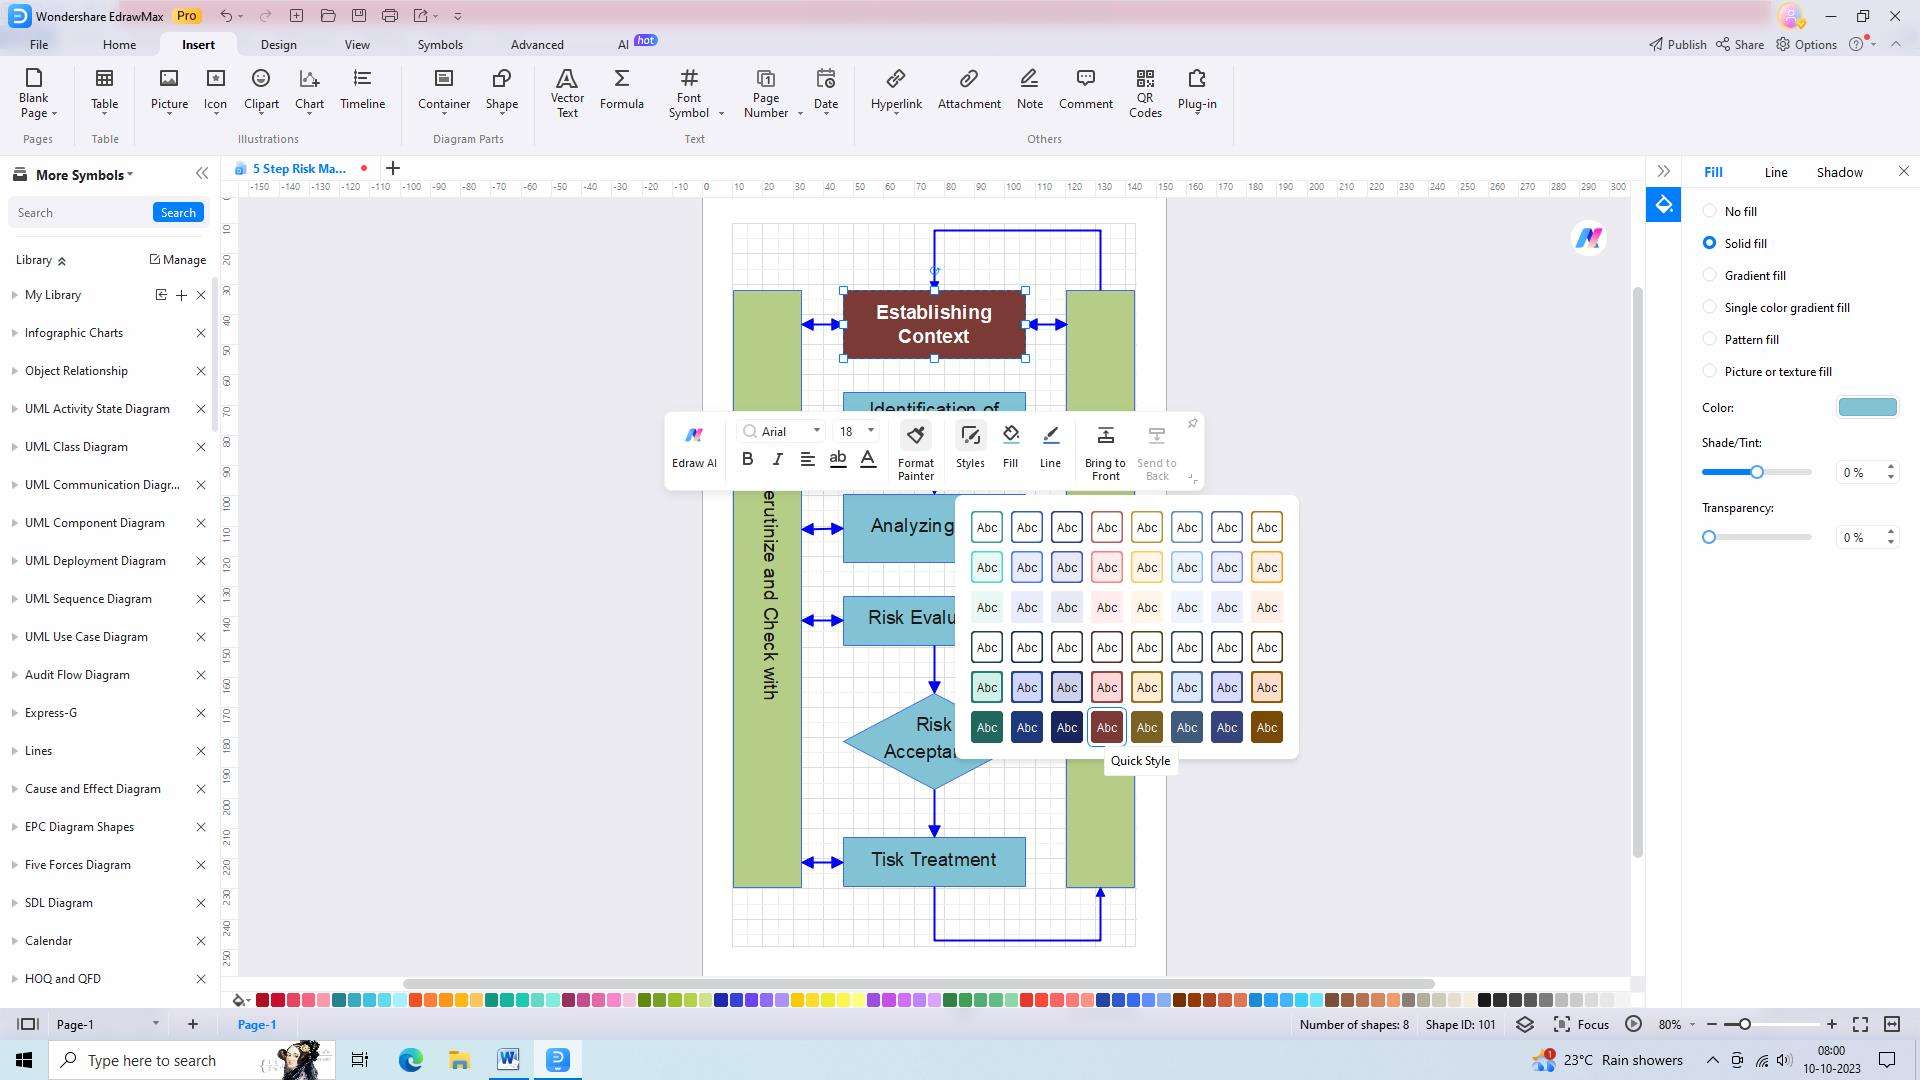
Step 4: Customize the appearance of the shapes
Take advantage of the extensive customization options available to you in order to tailor the appearance of the shapes to your liking. Modify their size, color, or text as desired by simply selecting the shape and utilizing the formatting options provided within the toolbar.
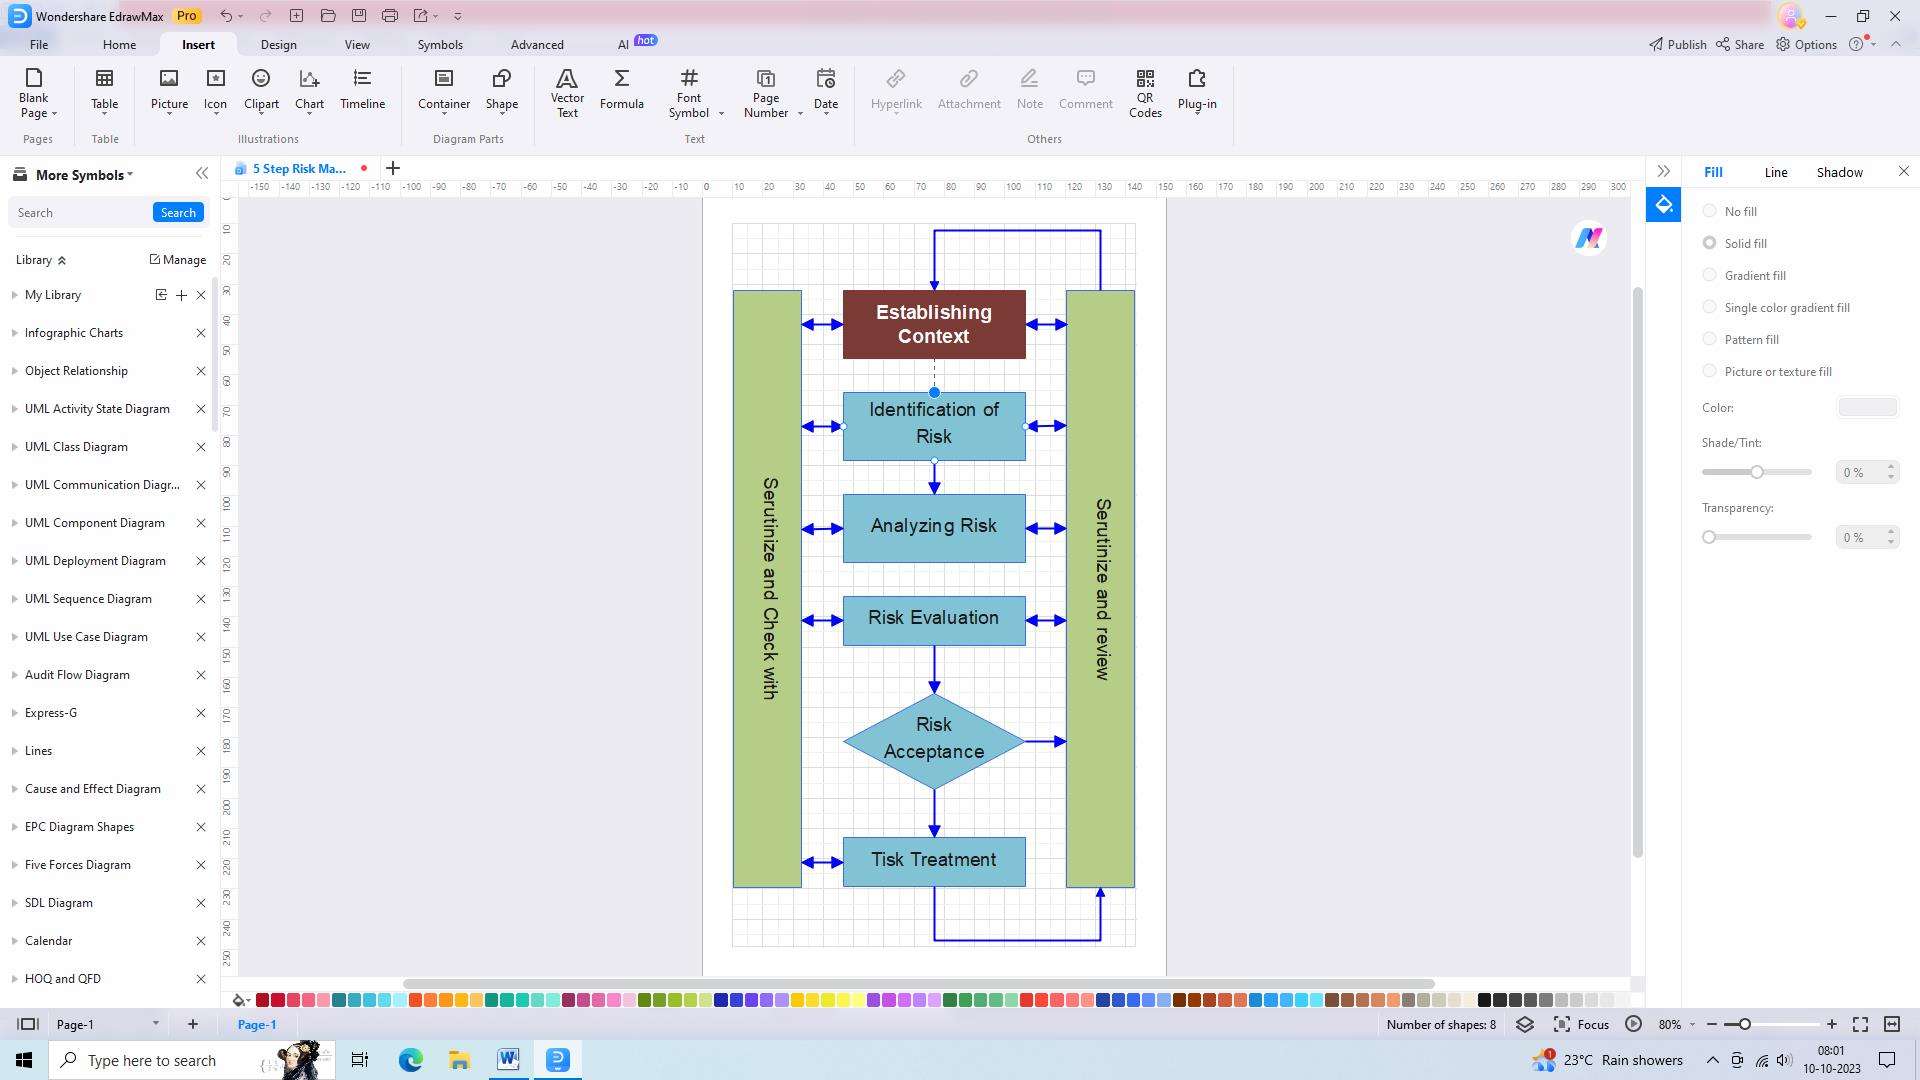
Step 5: Connect the shapes with lines or arrows to show relationships
Establish connections between the shapes within your flow chart by incorporating lines or arrows that effectively illustrate the relationships between different elements. To add lines, locate the "Line" tool within the toolbar, click and hold the mouse button, and then drag the line between the relevant shapes.
Step 6: Save or export the project risk management flow chart
Once you have achieved the desired outcome with your project risk management flow chart, ensure its preservation by saving it. Simply click on the "Save" button or export it in a variety of formats, such as PDF or image files, to suit your needs.

Conclusion
Flow charts offer a practical and efficient approach to risk management in project management. They enable project teams to identify and evaluate potential risks, formulate effective mitigation strategies, and maintain consistency across projects. By adopting risk register in project management flow charts, project managers can enhance communication, improve decision-making, and ensure the successful execution of their projects.
