
- All templates
- Pie charts
- Basic pie chart template
About this basic pie chart template
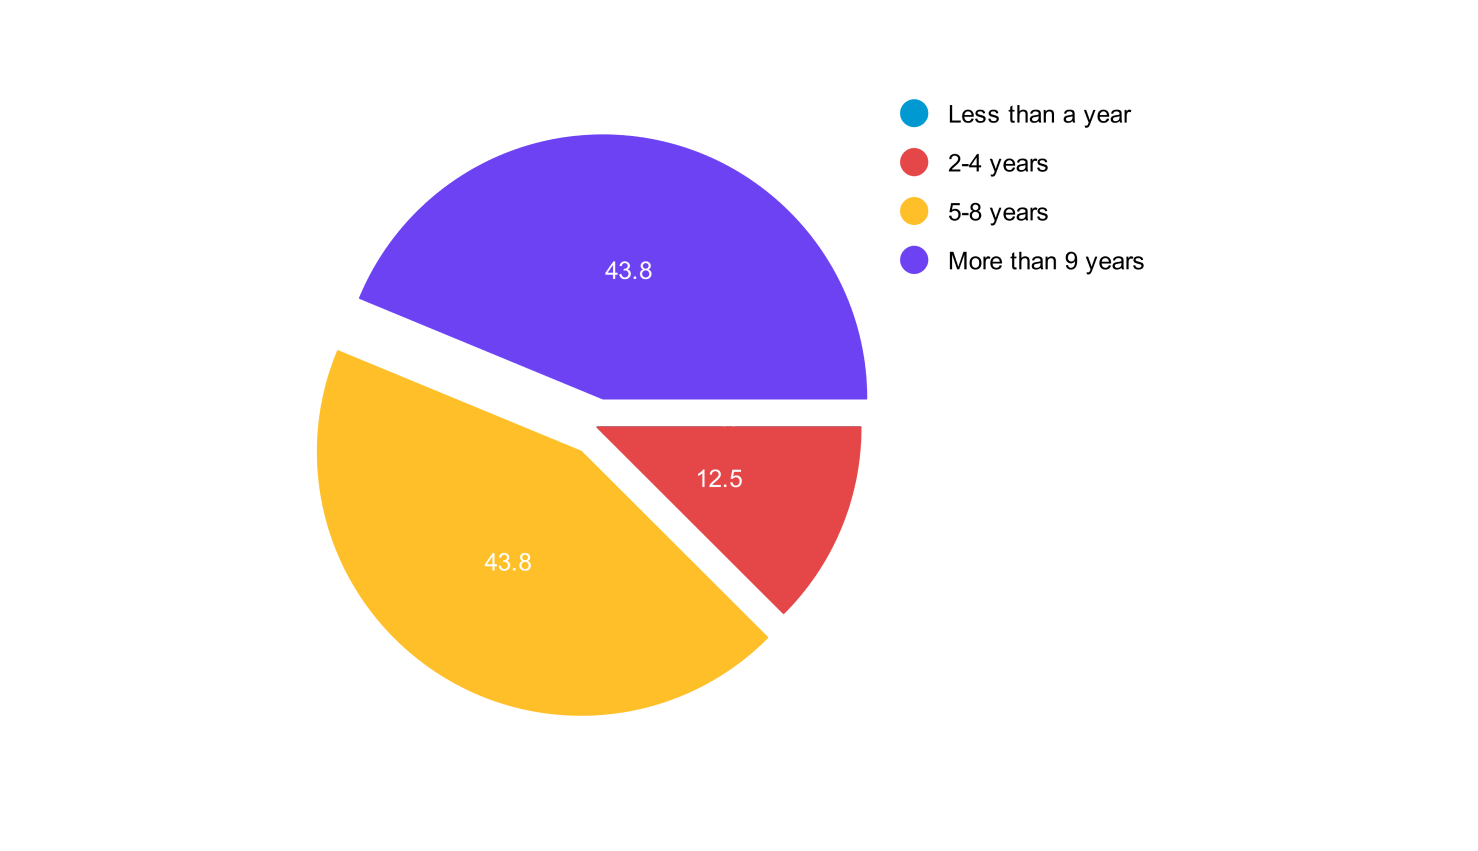
This basic pie chart template is your go-to for clear and simple data visualization. Its minimalist simple design makes it perfect for sharing information with anyone.
Whether you're a professional, teacher, or student, it is versatile enough for various data types. Think market share, survey results, budgets - anything you can break down into categories. It's especially helpful when your audience might be unfamiliar with complex charts.
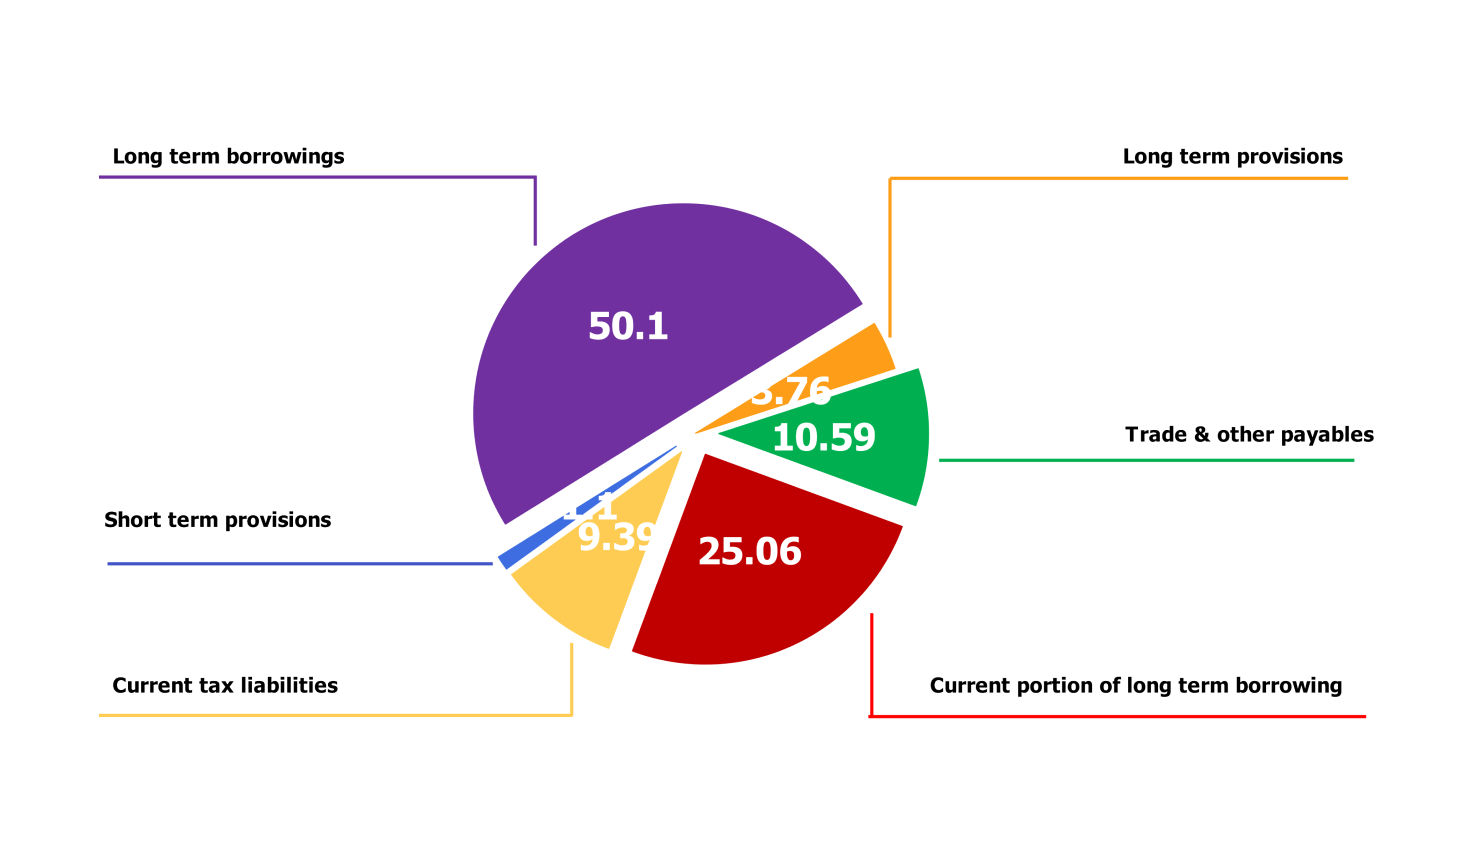
By turning numbers into a visual pie, this template makes it easy to see and compare categories. It's perfect for highlighting important points and making rational decisions.
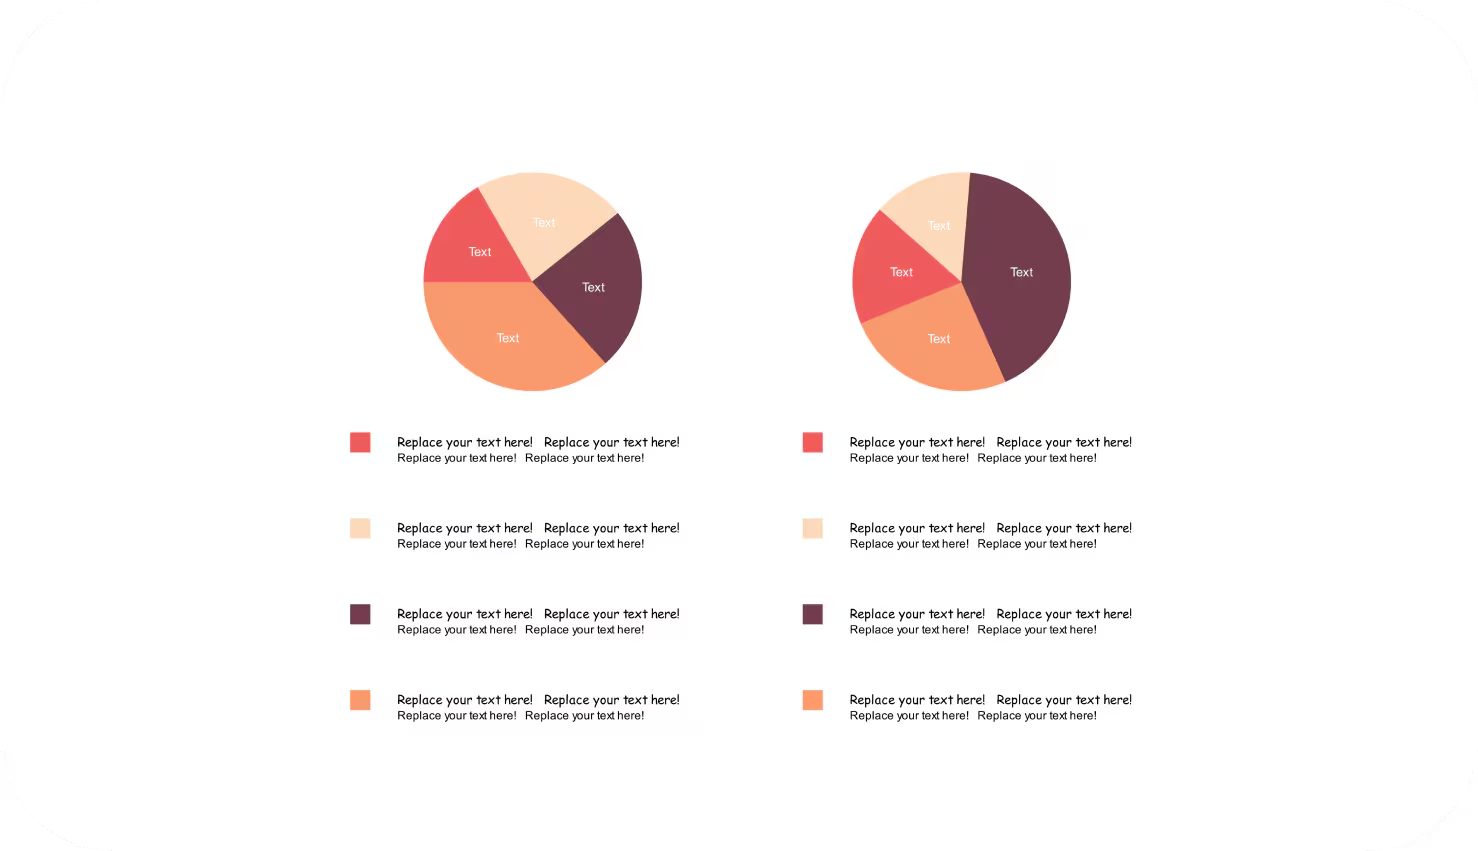
Plus, you can customize it to fit your needs. Change colors, labels, and sizes to match your data and style. Add labels and percentages for clarity. Include questions to get your viewers thinking about the data.
It is all about making your data clear, accessible, and impactful.
Related templates


Get started with EdrawMax today
Create 210 types of diagrams online for free.
Free Download Free Download Draw a diagram free Draw a diagram free Draw a diagram free